Partners
CQG M on Phones
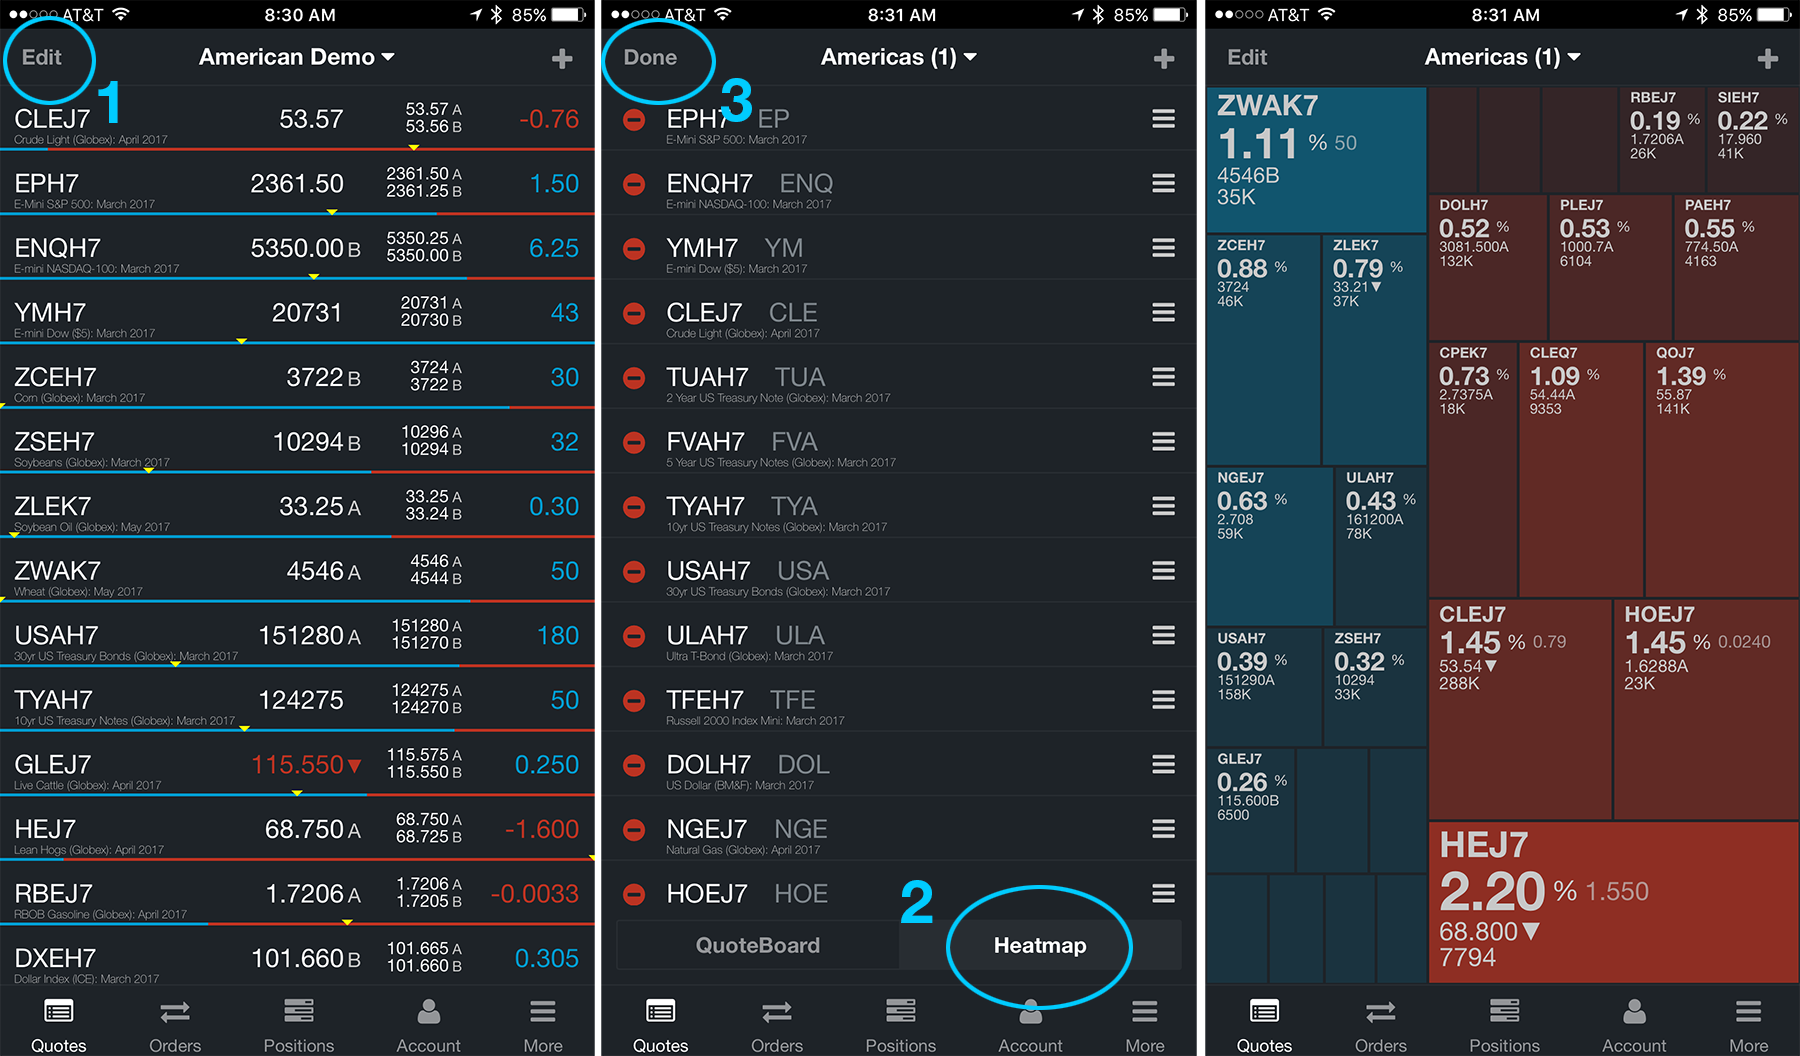
Heatmap view for quotes: Experience dynamic real-time data visualization.
Chart
Custom time intervals: Enter custom intraday time intervals on charts.
Trading
Improved drag… more

CQG, a global provider of high-performance trade routing, reliable market data, and advanced technical analysis tools, announced today that it will launch connectivity to the Warsaw Stock Exchange (… more
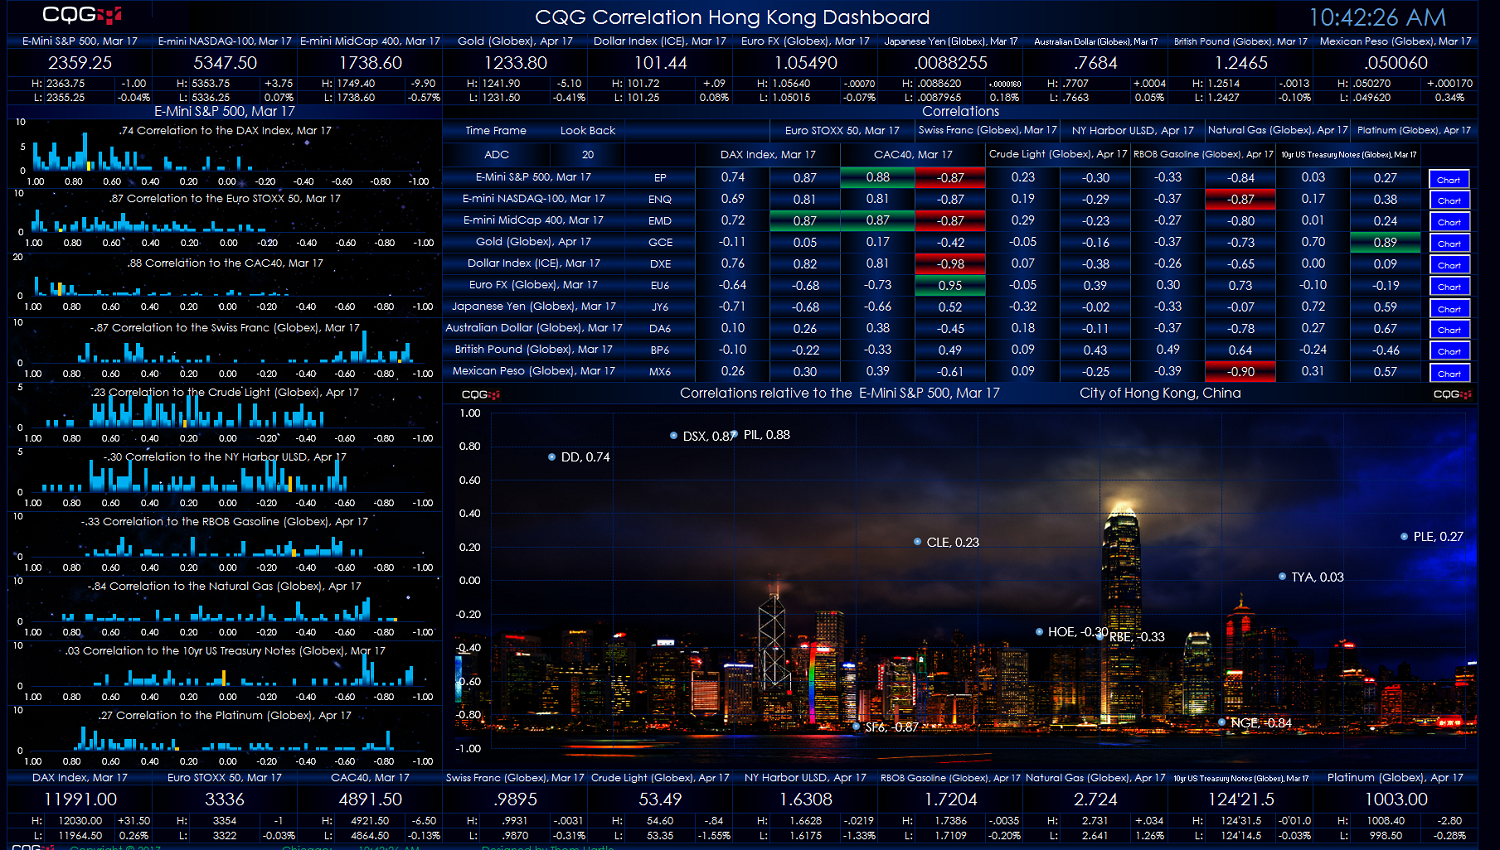
This macro-enabled Microsoft Excel® spreadsheet presents a ten-by-ten correlation matrix, a scattergram chart of the correlations by row, and frequency distribution charts of the correlations. In… more
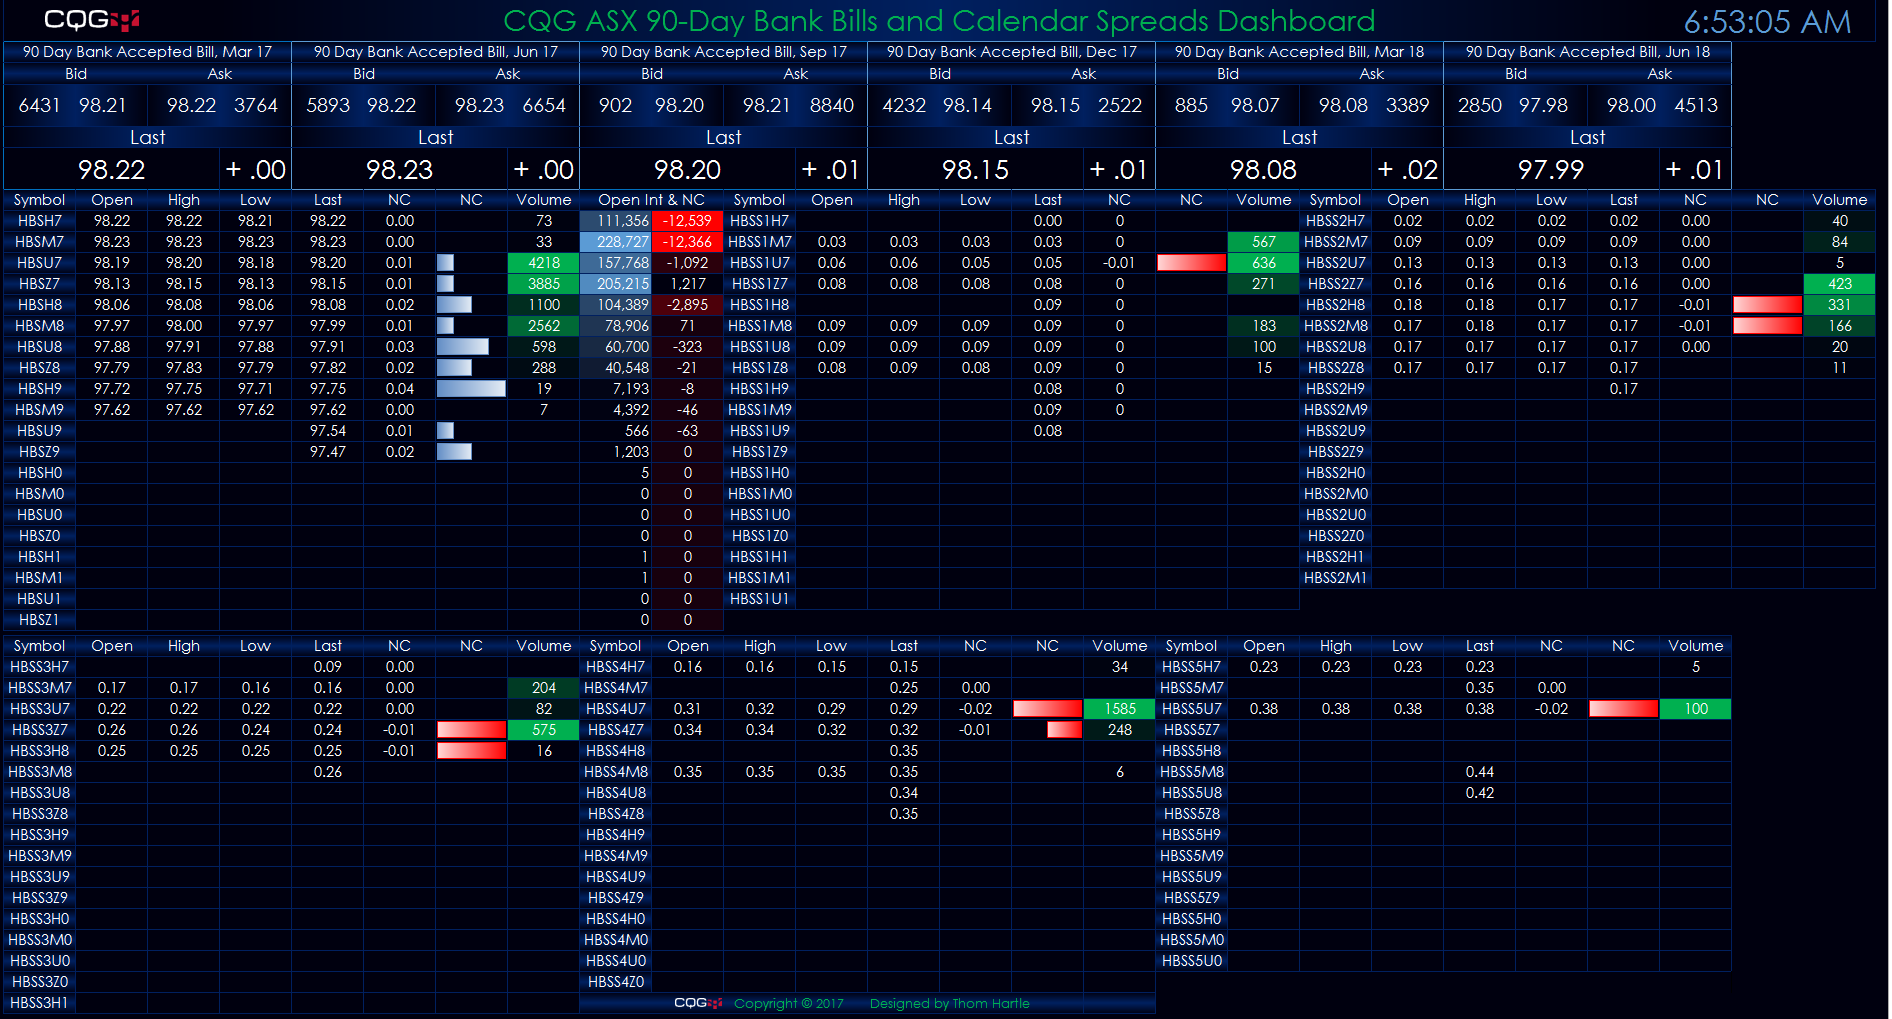
This Microsoft Excel® dashboard displays 90-day bank bills and exchange-traded spreads traded on ASX. The inside market for the front six contracts is detailed along the top. The open, high, low,… more
Alli Brennan, CQG Director of Marketing and Product Management, recently authored an article for TabbFORUM titled Finnovation – The Hot Topic With Great Impact.
Brennan writes:
… more
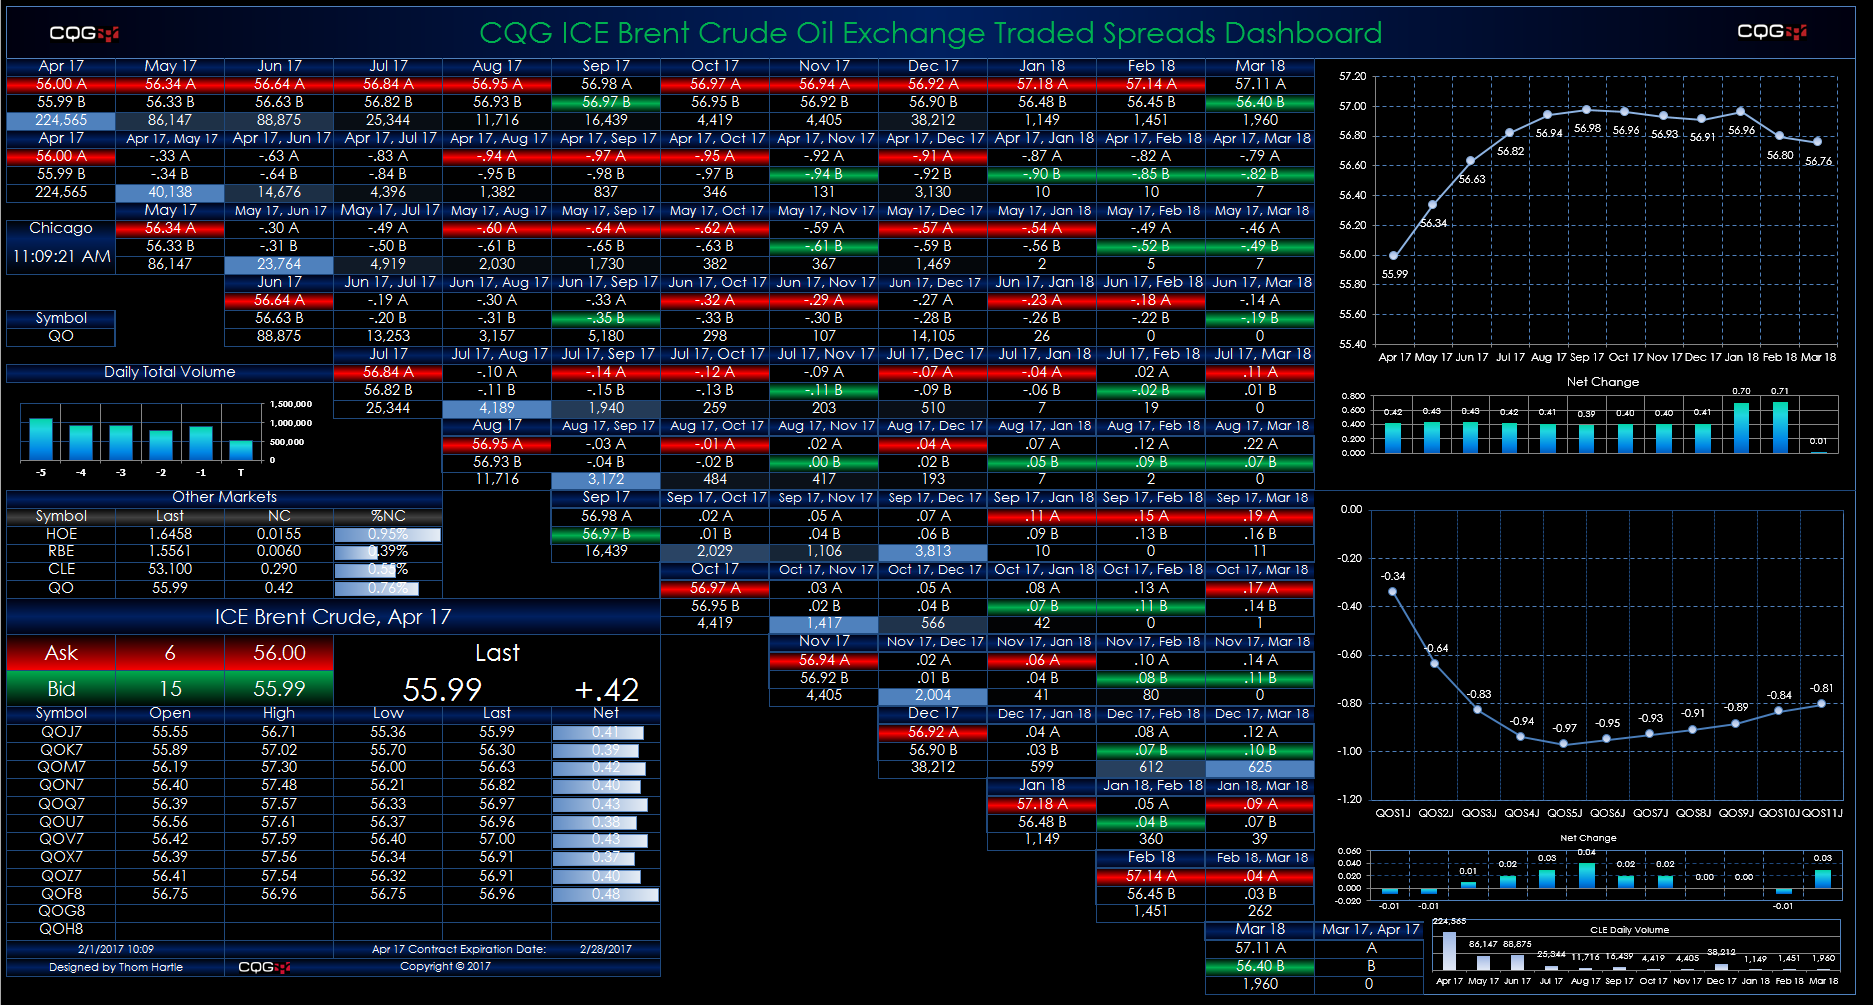
This Microsoft Excel® dashboard displays market data for crude oil spreads traded on the ICE platform using a matrix-style format. The outrights are along the top row and the start of each… more
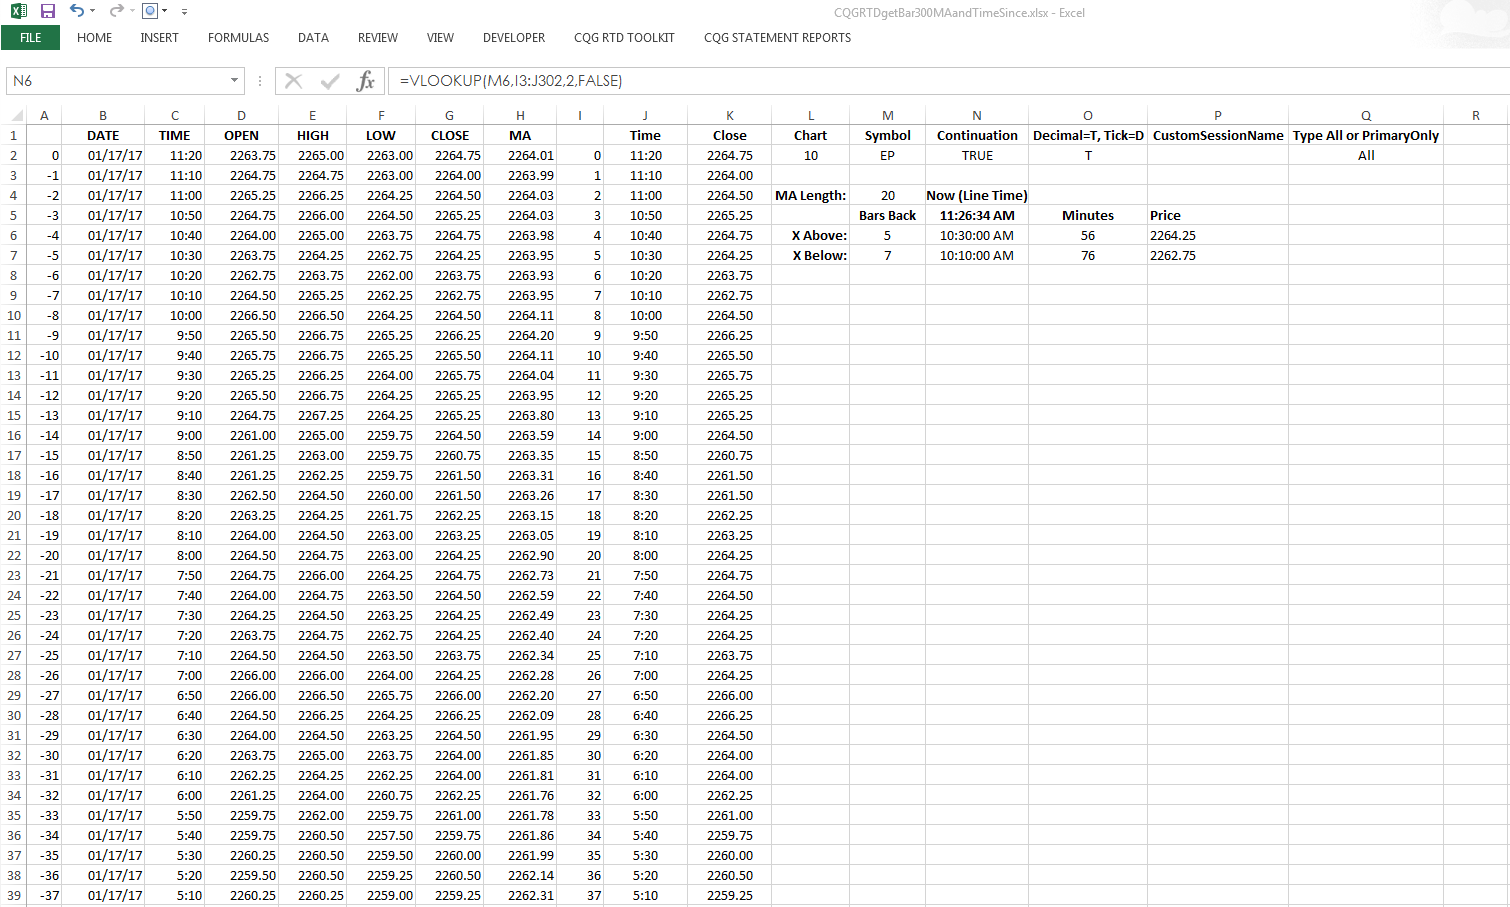
CQG formulas include a crossover feature, and CQG can determine the number of completed bars back since a signal occurred. For example, using “Barssince(EP xabove Ma(EP,Sim,20),1,300)” as the… more
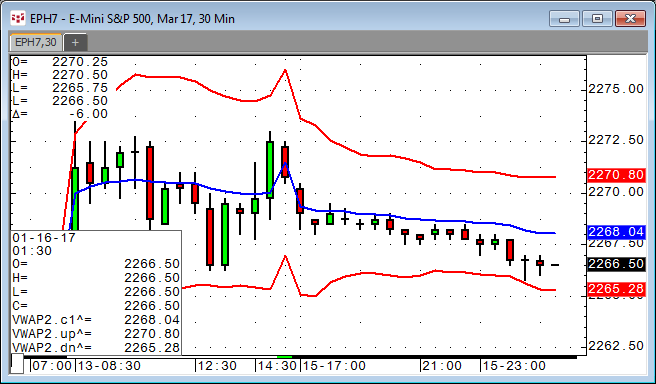
Here is a special version of the Volume-Weighted Average Price (VWAP) study including standard deviation bands.
VWAP is the volume-weighted average price for a futures contract… more
Kase and Company, Inc. today announced a major update of its award-winning StatWare® indicators. These indicators are available in CQG Integrated Client through CQG’s Charting API.
The… more
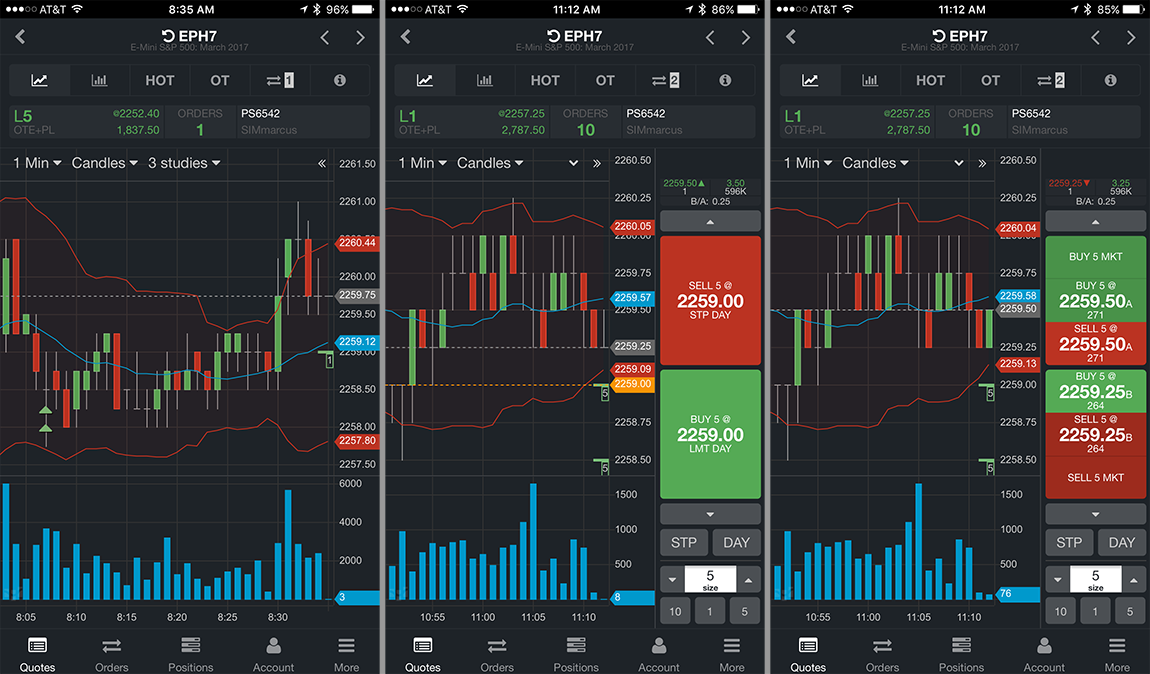
Here are some of the exciting new features available in CQG M version 2.9.
CQG M on Phones Details page layout improvements. Trading buttons moved from the top of the details page to the… more