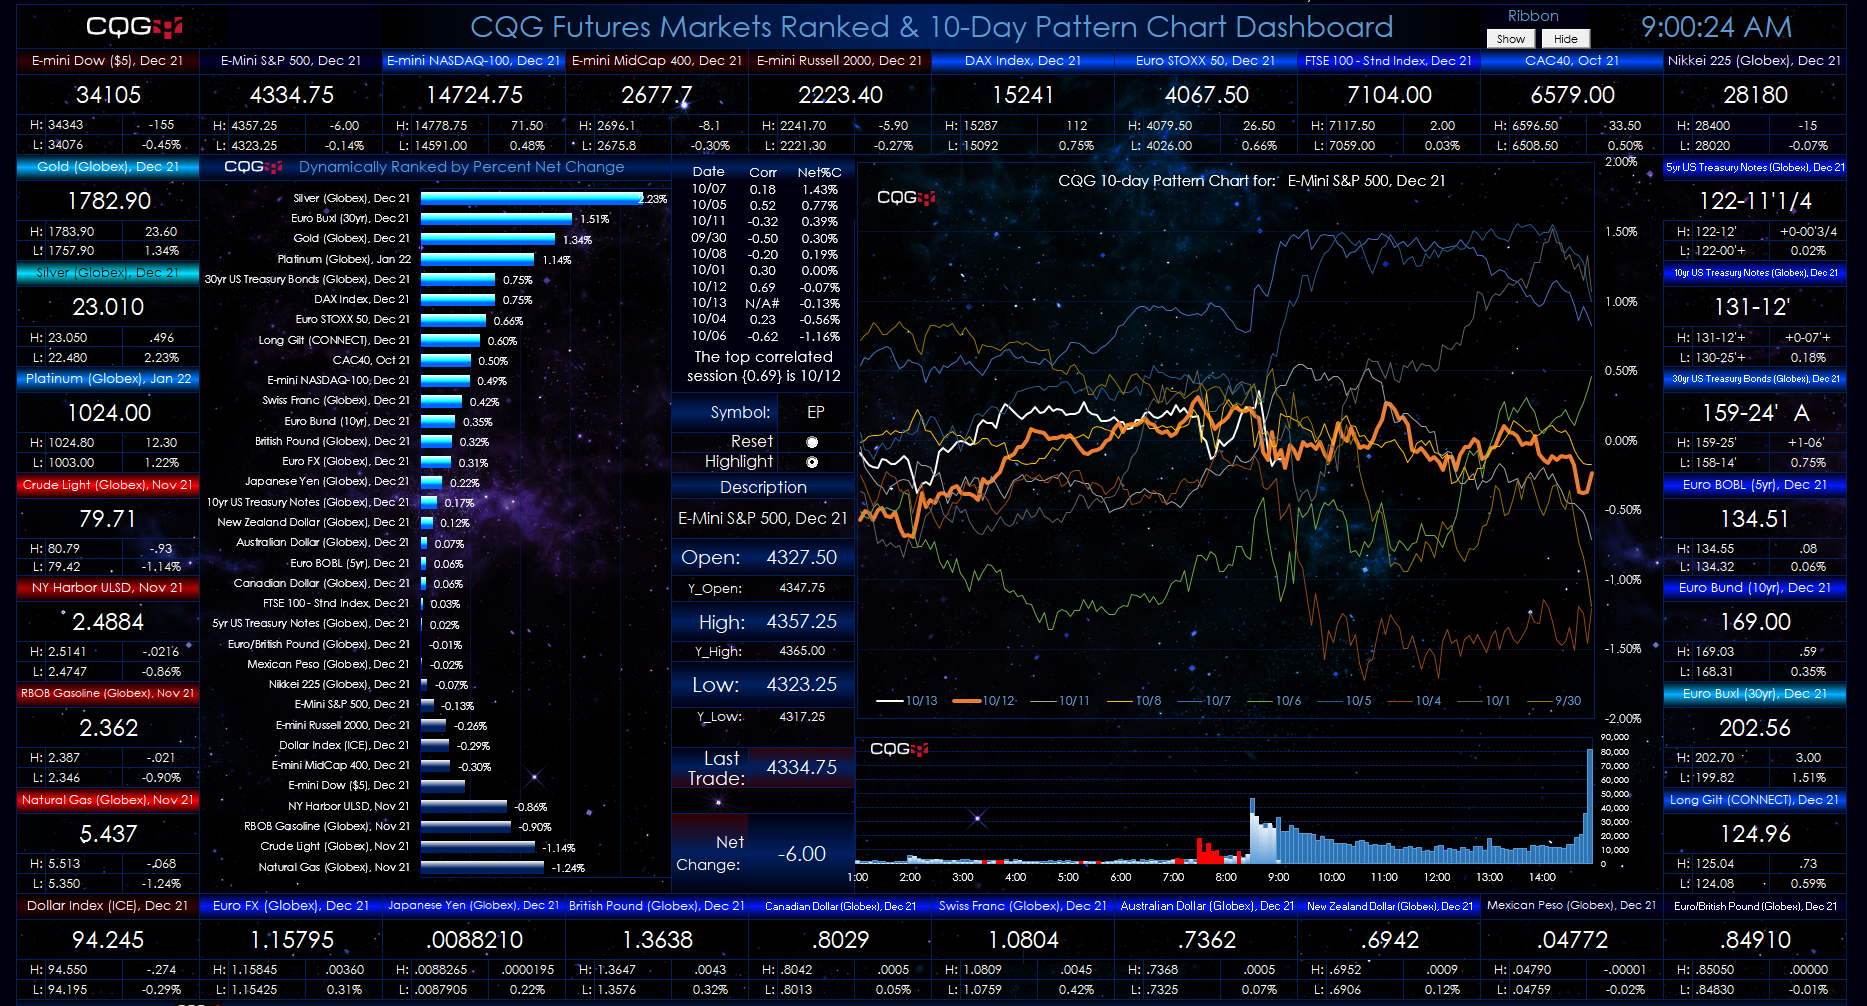
This Microsoft® Excel dashboard has a number of features. The primary feature is the 10-Day Pattern Chart. This chart displays the percent net change on a 5-minute basis for today (the white line… more
Futures

Day trading futures outright is one of the most difficult forms of speculation with little room for error, generally high leverage, and fierce competition.
Watch this webinar to hear Carley… more
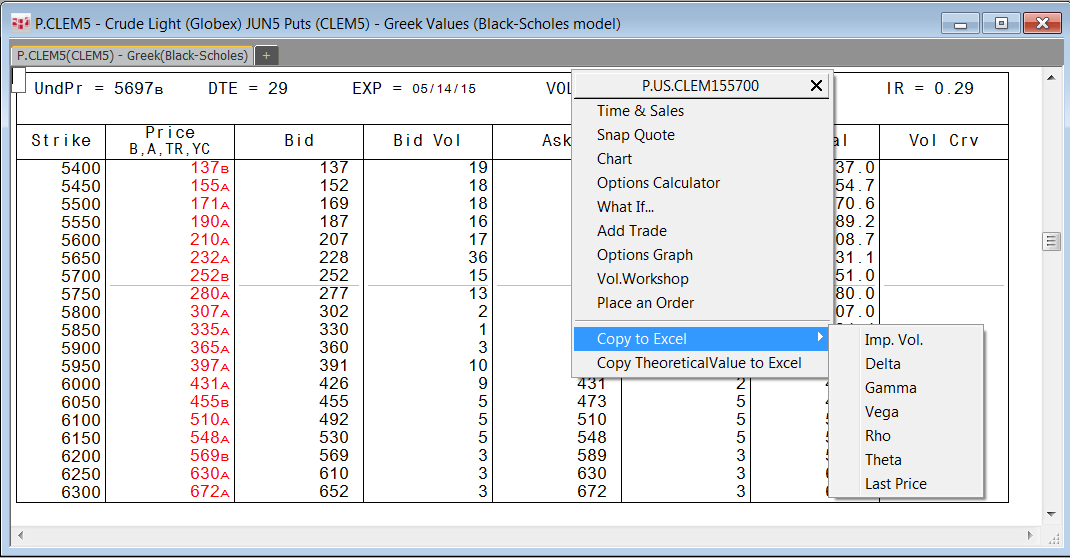
You can use Microsoft Excel® and data from CQG to expand the features of your own market display dashboards. This powerful combination can be tailored to your specific needs. This article shows… more