CQG offers exclusive TFlow® charts that show the inside market. There are RTD formulas to pull the TFlow chart data into Excel. While Excel cannot display the CQG TFlow chart data, it can use the market data as the basis for a candlestick chart. This spreadsheet details the RTD formulas for displaying a candlestick based on a five-bar aggregation TFlow chart.
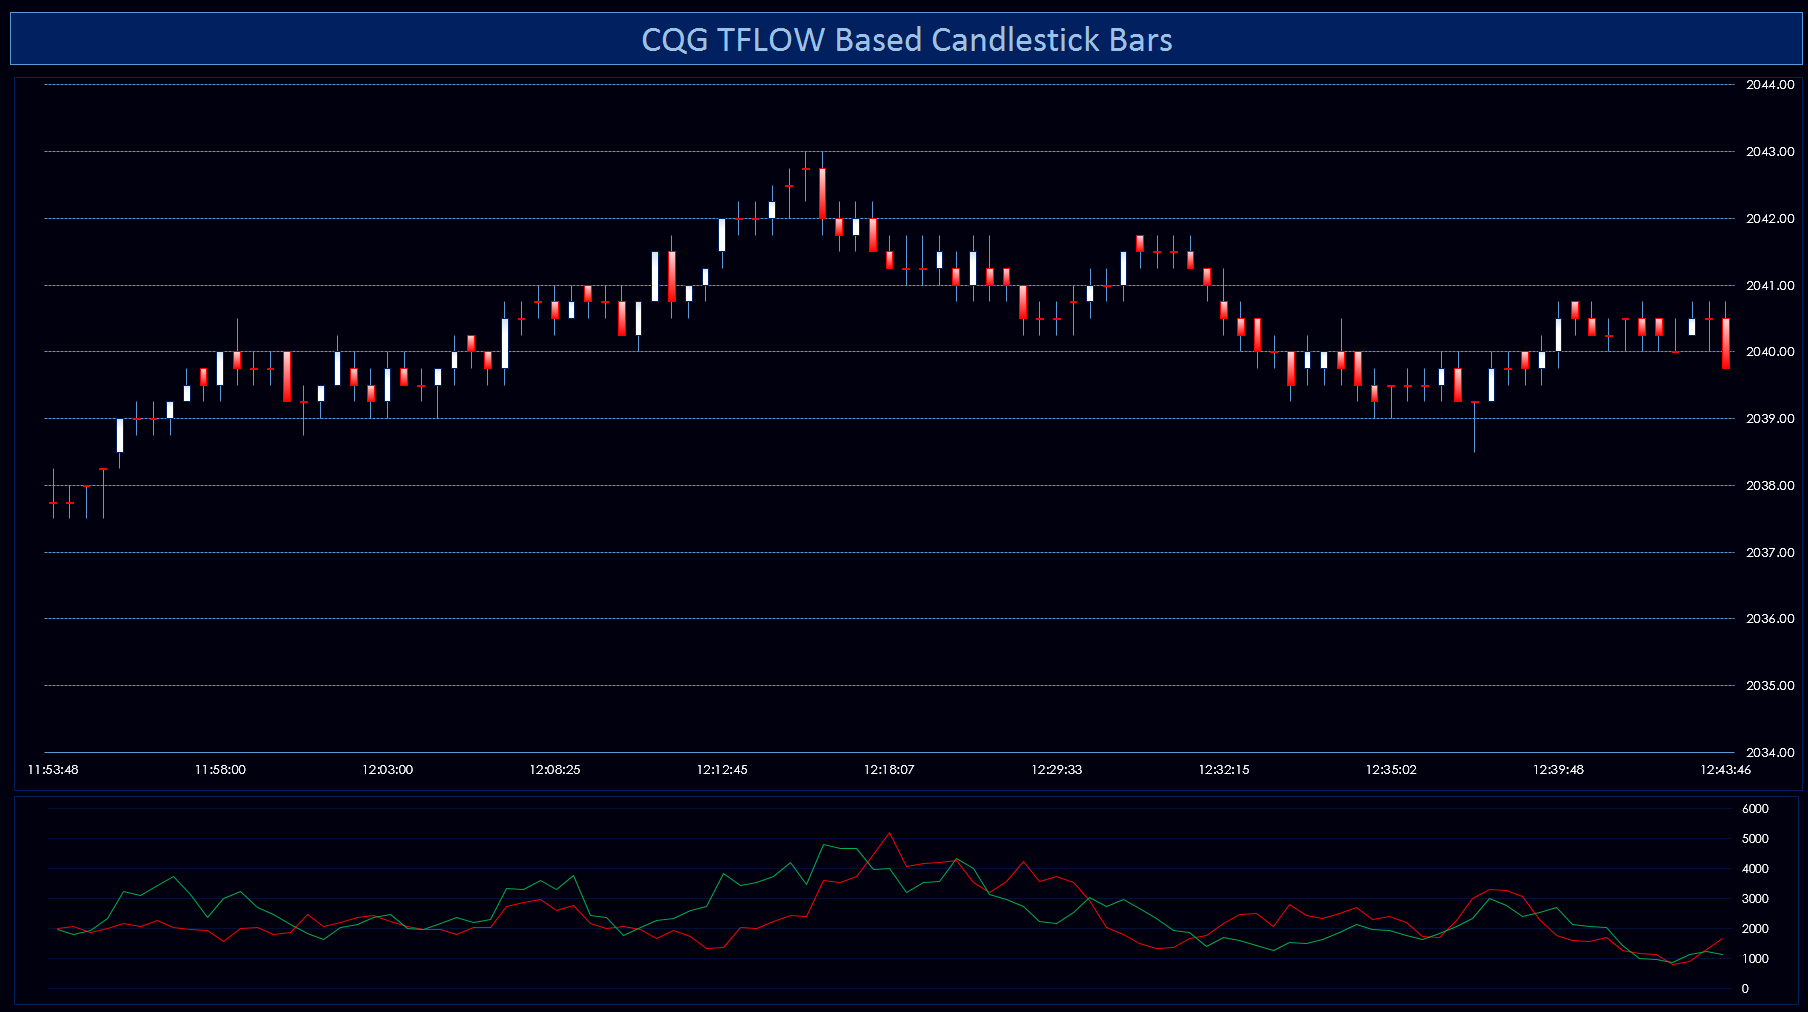
The five-bar aggregated TFlow chart can often display better-defined support and resistance levels than traditional open, high, low, and close bars. The same value can be displayed using candlestick bars based on the TFlow data.
In addition, below the candlestick chart is a chart of the Bid/Ask Volume study.
Make sure to lower your Excel RealTimeData (RTD) throttle to 50 milliseconds or lower. Learn how to do that here.
Requires CQG Integrated Client version 16x and higher. 64-bit Microsoft Excel is recommended.