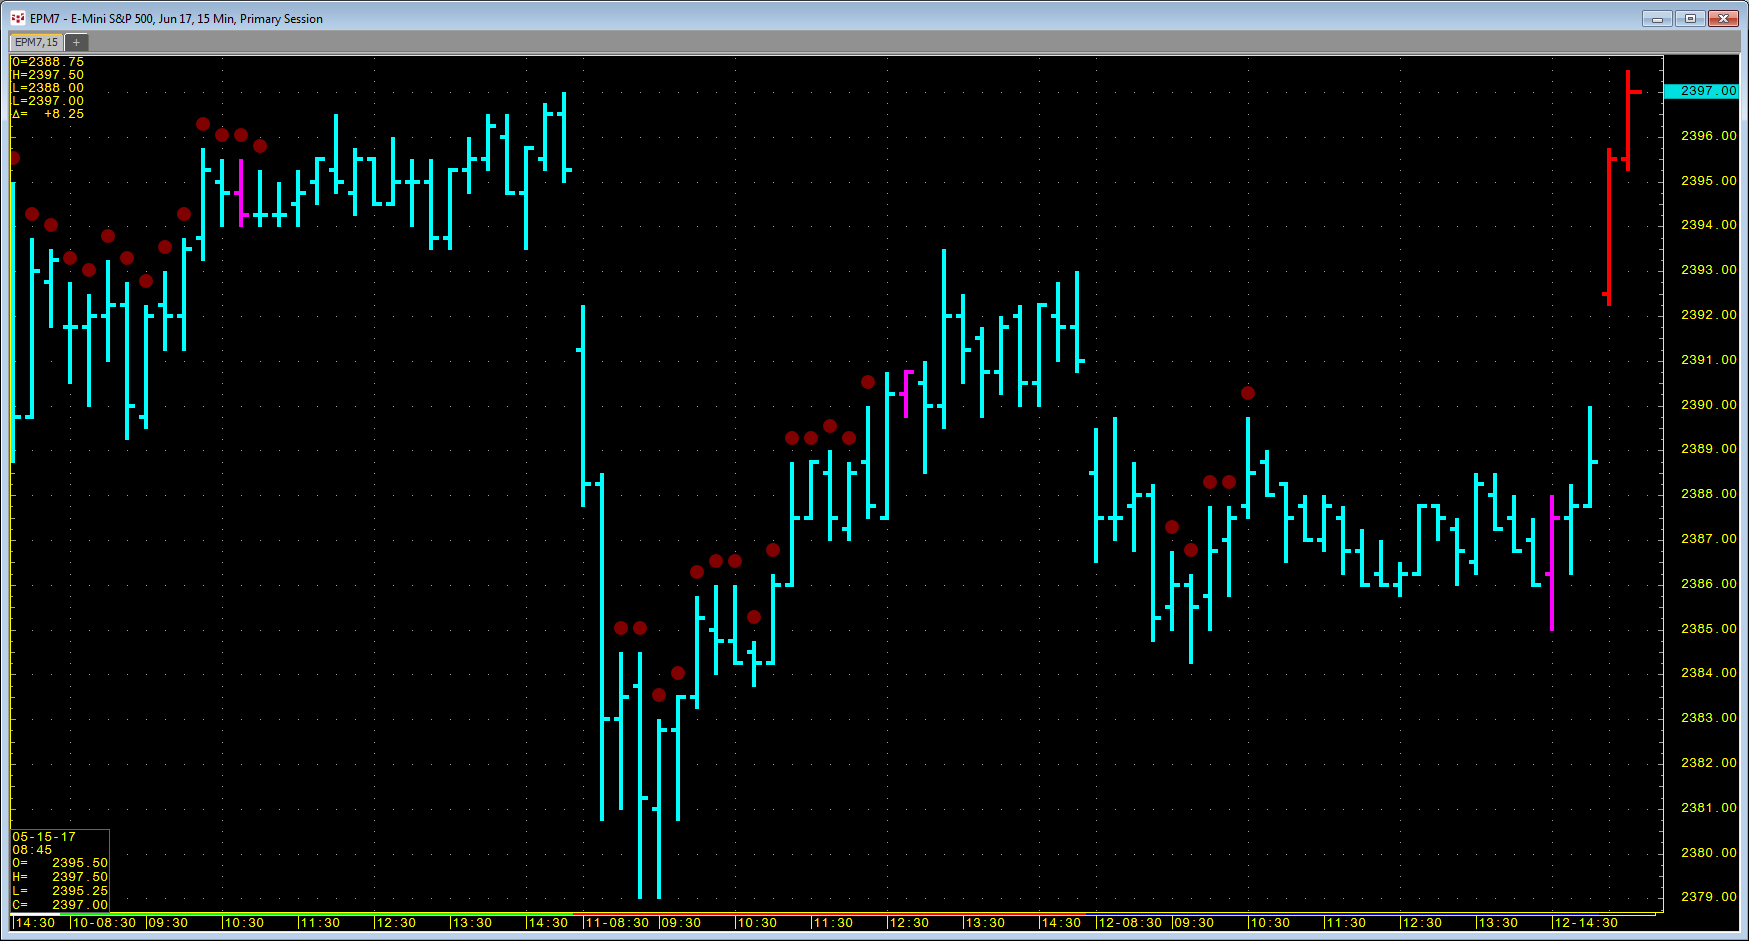
Traders can use pre-built conditions or create their own conditions in CQG to mark bars when a particular condition is met. They can then pull this information into Excel using RTD formulas. The RTD formulas are similar to study RTD formulas. The difference is that the letter B and a period are required (“B.”) in the symbol.
For example, here is the RTD formula to call for the CQG ADX High condition applied to a five-minute chart using the symbol EP:
= RTD("cqg.rtd",,"StudyData", "B.cqg.ADXHigh(EP,Period:=10,Threshold:=25)", "Bar",, "Close",5,0, "all", "", "","True")
When the ten-period ADX study is greater than 25, then a 1 is returned in the cell in Excel. When this is not true, a 0 is returned. As long as the condition remains true, the cell will contain a 1.
This next condition returns a 1 when the five-period moving average crosses above the 25-period moving average. The condition uses the CQG XAbove function and will be true for just one bar. If the five-period moving average is still above the 25-period moving average on the next bar, a zero is returned since it is not the bar the two averages crossed.
= RTD("cqg.rtd",,"StudyData", "B.cqg.MA1XAboveMA2(EP,MA1Period:=5,MA2Period:=25)", "Bar",, "Close","5","0", "all", "", "","True")
You can pull historical values by replacing the “0” with a negative number, such as “-1” for yesterday or “-5” for five days ago.
The downloadable CQG-powered Excel RTD spreadsheet pulls in three CQG conditions:
- CQG.ADXHigh
- CQG.RSIHigh
- CQG.MA1XAboveMA2
Requires CQG Integrated Client or CQG QTrader and Excel 2010 or more recent.
