The BarInt function can be useful when creating Custom Studies or Conditions which can be applied to different timeframe but where a point of reference may be different whether you are looking at an intraday chart or a Historical chart (Daily Weekly and above).
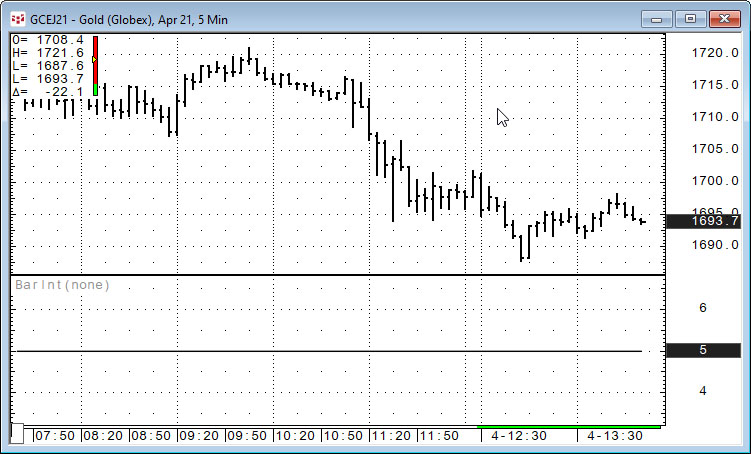
When applied to an intraday chart, the BarInt function will return the timeframe of that chart in numeral terms (the value “5” for a 5 minute chart).
For Historical timeframes, the function returns the following values:
| Chart Interval | BarInt Value |
|---|---|
| 5 min | 5 |
| 10 min | 10 |
| 15 min | 15 |
| 60 min | 60 |
| 120 min | 120 |
| Daily | 1440 |
| Weekly | 10080 |
| Monthly | 43200 |
| Quarterly | 129600 |
| Semi-Annual | 259200 |
| Annual | 525600 |
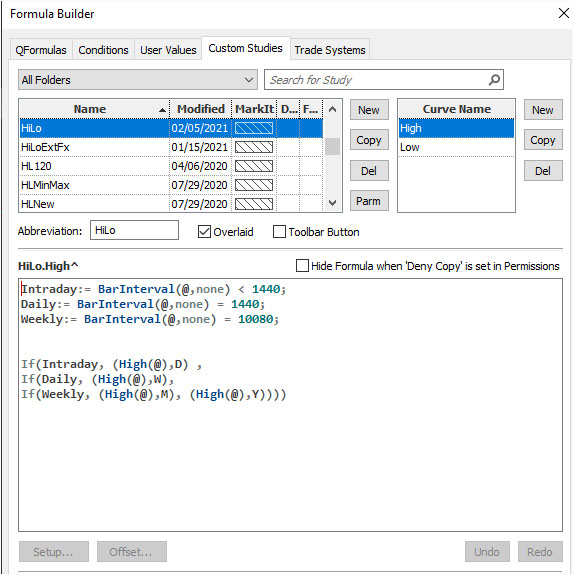
An example would be the ability to plot the High/Low of the previous day (if the Bar Interval is lower than daily), of the previous week (if the Bar Interval is Daily), of the previous month (if the Bar Interval is Weekly), and Annual for any other timeframe:
Curve High:
Intraday:= BarInterval(@,Interval:=none)  1440;

Daily:= BarInterval(@,Interval:=none) = 1440;

Weekly:= BarInterval(@,Interval:=none) = 10080;


If(Intraday, (High(@),D) ,

If(Daily, (High(@),W),

If(Weekly, (High(@),M), (High(@),Y))))
Curve Low:
Intraday:= BarInterval(@,none)  1440;

Daily:= BarInterval(@,none) = 1440;

Weekly:= BarInterval(@,none) = 10080;


If(Intraday, (Low(@),D) ,

If(Daily, (Low(@),W),

If(Weekly, (Low(@),M), (Low(@),Y))))
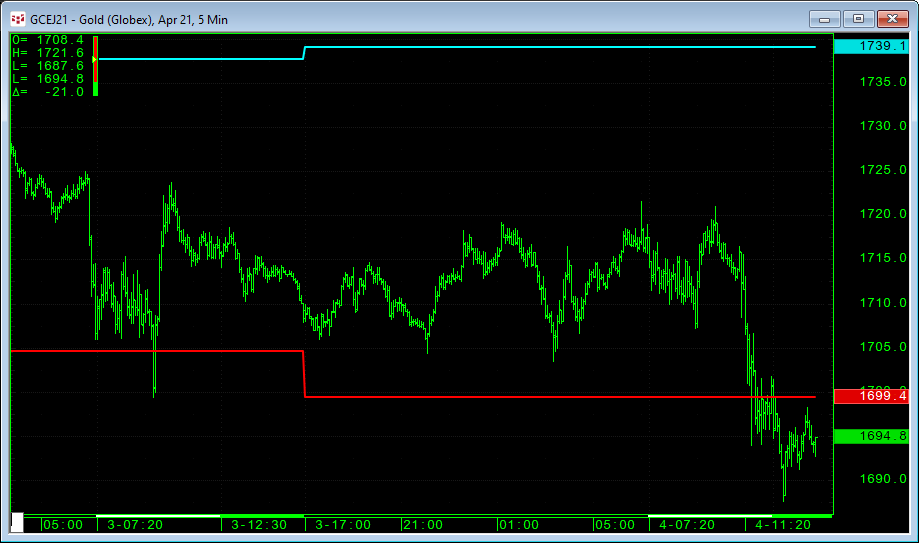
Here is a screen capture of the 5-minute Gold Chart with the HiLo study displaying the previous day’s high and low.
There is a downloadable PAC available to install the study.


