This post provides a guideline to reviewing the outcomes of a pattern recognition approach to the markets.
Two recent posts on Workspaces discussed CQG's Candlestick Formations Study.
CQG Primer: Candlesticks Formations Study introduces the CQG study. The study is actually a set of conditions, fifteen in all, and when a a condition or formation is complete then a box is displayed around the bars with an abbreviation below the bottom for bullish formations or above the top for bearish formations.
The next post, Candlestick Formations Study in Excel, detailed the RTD formulas for pulling in historical Open, High, Low, and Close price data and the Candlestick Formations.
This post offers an Excel dashboard that details what happens following the completion of a particular formation. Exch formation is reviewed over the historical data base available via RTD. CQG Integrated Client can pull in 1,000 daily bars, which is approximately four years of O, H, L, and C daily data.
This is not a trading system.
This is an evaluation of the individual outcomes of a particular set of patterns.
The typical review of the outcome from conditions or studies as trading signals usually include four points of data: The entry price and time or date and the exit price and time or date. This Excel dashboard includes two additional points of data that are important pieces of information: What was the maximum open profit or Maximum Favorable Excursion (MFE) and what was the maximum open loss or Maximum Adverse Excursion (MAE) before the trade was exited.
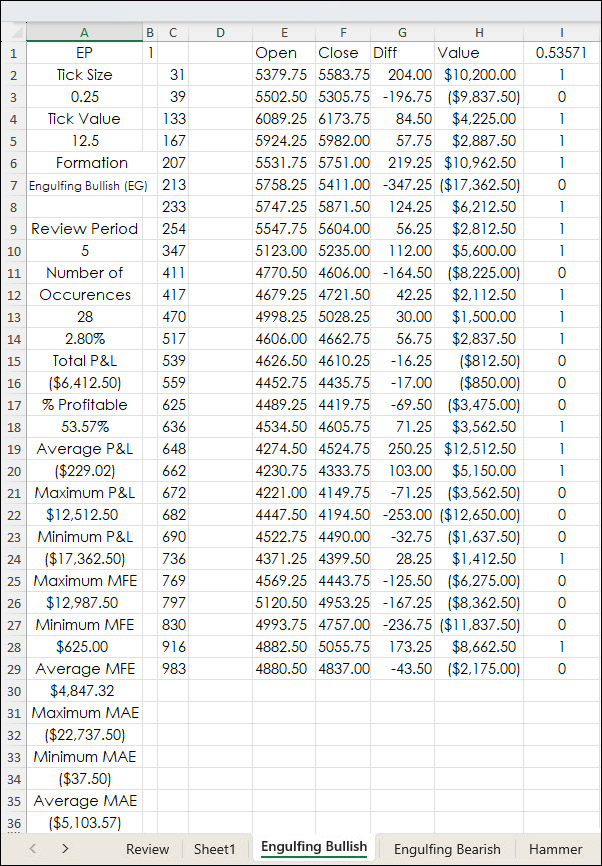
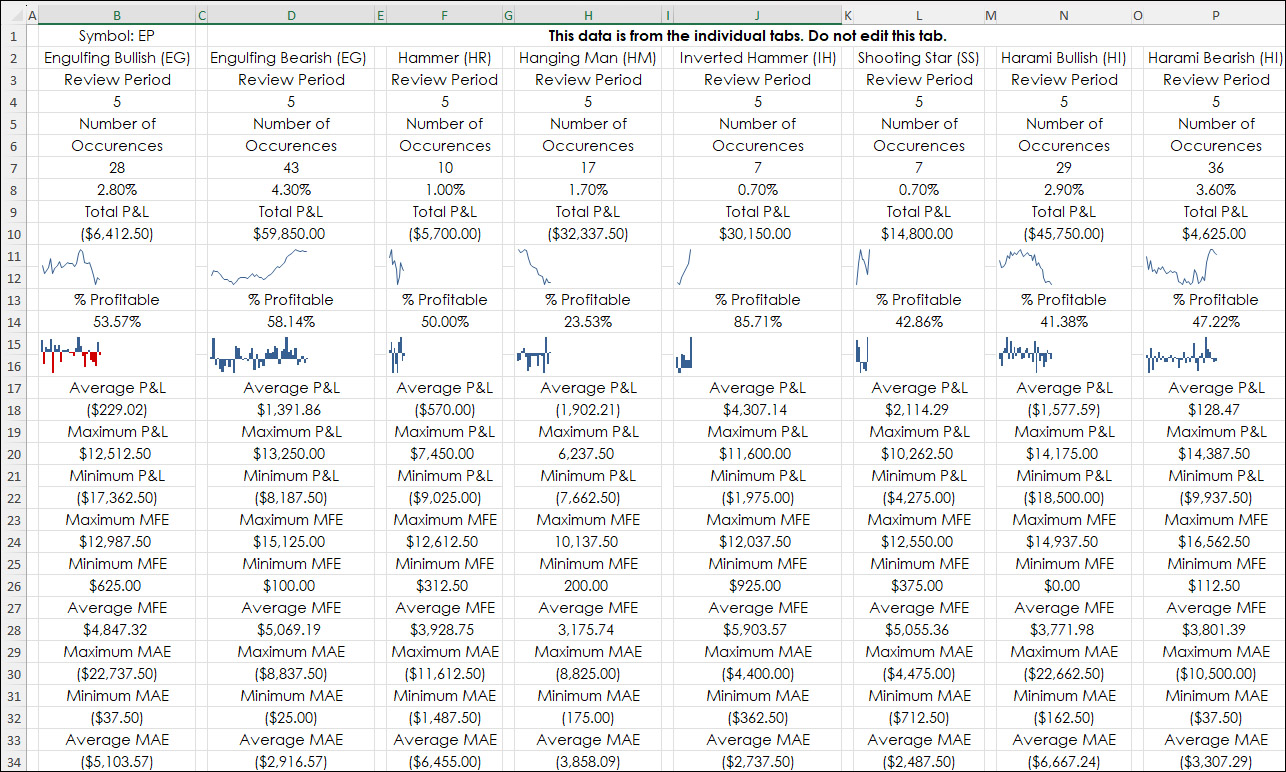
First, in the downloadable spreadsheet the Candlestick Formations are individual tabs. There is a parameter "Review Period" for each Candlestick Formation. In this case, the Review Period is five bars.
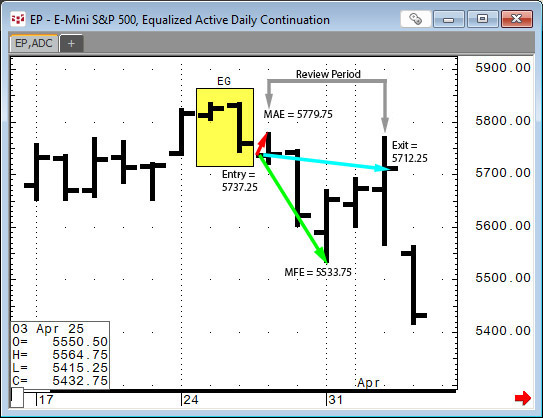
This next image illustrates the data. The yellow box indicates the Engulfing Bearish Candlestick formation was completed.
The spreadsheet uses the next bar's open for a short position. The price was 5737.25. This is bar 1. The exit is on the close of the fifth bar from the Candlestick Formation, which was a price of 5712.25.
The MAE was the high of the first bar. The price was 5779.75. The MFE was the low of the third bar. The price was 5533.75.
The spreadsheet performs all of the same analysis for all Candlestick Formations.
The symbol is entered on Sheet1. This analysis is for daily bars only.
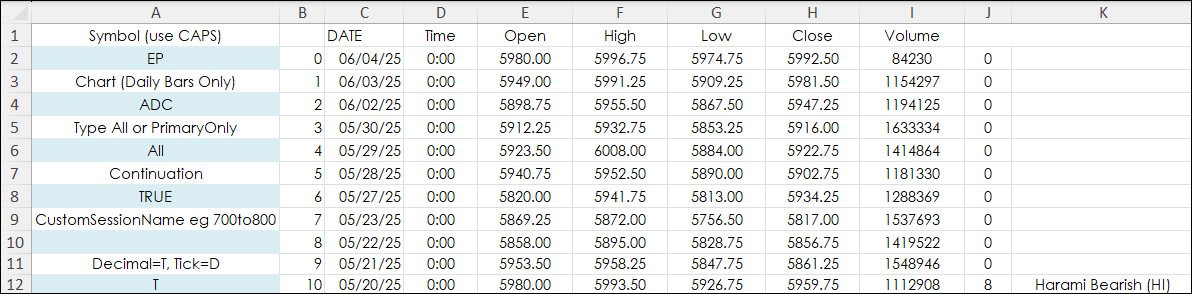
The individual tabs review Sheet1 for the occurrences of the Candlestick Formations. Each tab has three sections. The first section, columns E through I are the closed trades profits and losses.
If a Candlestick Formations occurs but is not closed (still in the Review Period) the first row is blank.
All Candlestick Formations are reviewed as individual situations. If a Candlestick Formation occurs that is bullish and a Candlestick Formation that is bearish occurs while the first one is still in the Review Period, then both are a reviewed.
The data analysis from Cells A7 to A36 for each Candlestick Formation is displayed on the Review tab.
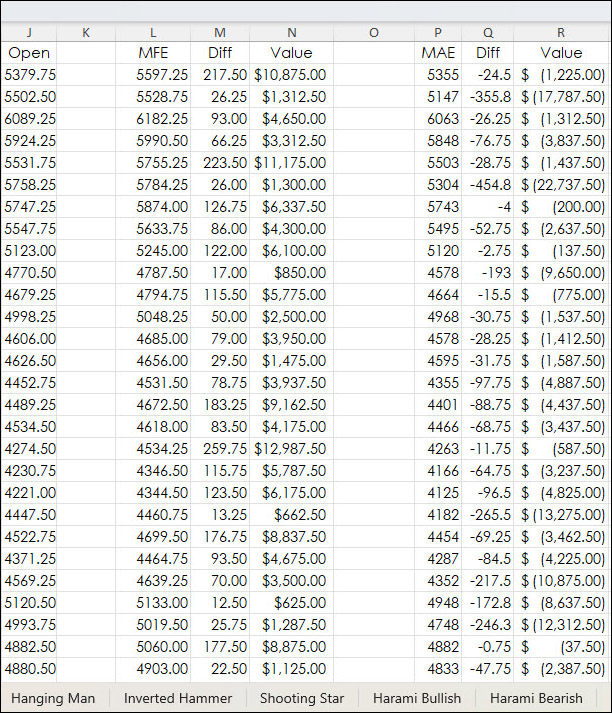
The next section, columns J through R is the MFE and MAE analysis for each trade.
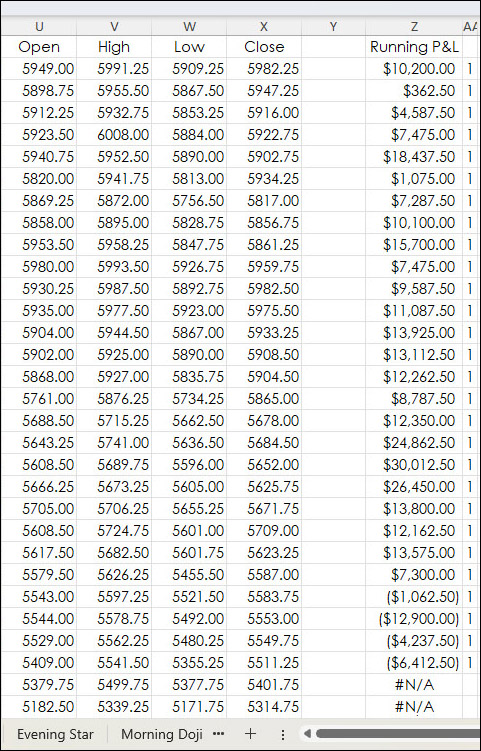
Columns U through X are the O, H, L, and C of the daily bars. Column Z is the running P&L total.
The Review Tab displays the data analysis from cells A7 to A36 for each Candlestick Formation.
Row 11 is a sparkline chart of the running profit and losses. Row 15 is a sparkline chart of the individual trades.
The point of this post is to encourage the review of the results when using rules for entry and exit trades. MFE analysis can offer using a target for partial profits as part of a strategy. MAE analysis can help use stop loss analysis for determining at what point does a trade not recover to turn into a profit. It is about gathering data.
From AI: The quote "Data, data, data" is spoken by Sherlock Holmes in the Arthur Conan Doyle story "The Adventure of the Copper Beeches". Holmes expresses his frustration at the lack of detailed information, stating "I can't make bricks without clay". He emphasizes the need for concrete facts to solve a mystery, highlighting the importance of data in his deductive reasoning process.
Requirements: CQG Integrated Client, and Excel 2019 (locally installed, not in the Cloud) or more recent.