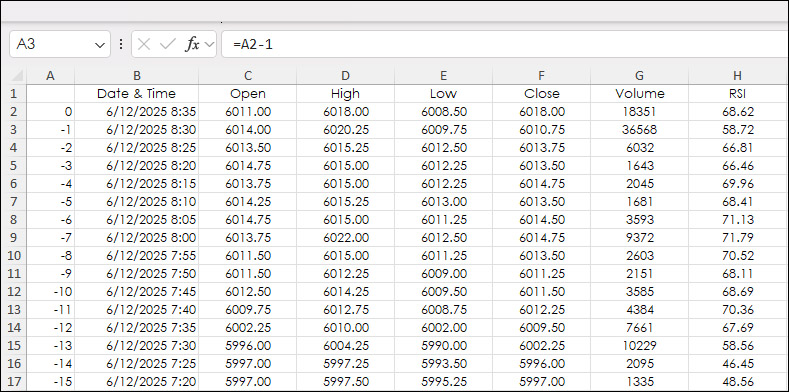
A typical historical Excel RTD dashboard pulls in market data using the bar index parameter. Below, the bar index is in column A. The most current bar is "0". The previous bar is "-1", etc.
However, you may want to start with a specific date and time for pulling in data. Excel's VLOOKUP function is used.
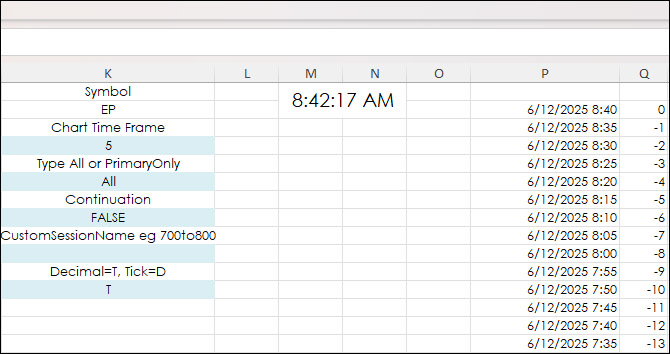
First, a reference table for date and time along with the bar index is used, which is columns P and Q.
The date and time is copied and pasted as a Value into cell I2:
6/12/2025 7:30:00 AM
And, cell I1 has the VLOOKUP function:
=VLOOKUP(I2,P2:Q5000,2,FALSE)
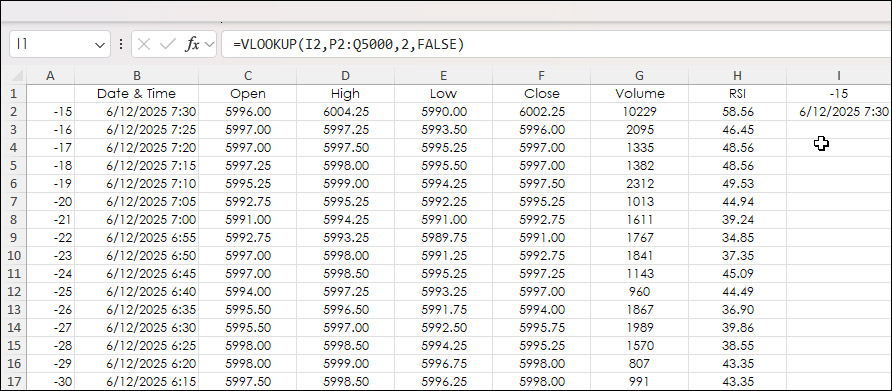
The VLOOKUP function is finding the date and time in column P and is returning the bar index from Column C to cell I1, which is linked to cell A2.
Requirements: CQG Integrated Client or QTrader, and Excel 2016 (locally installed, not in the Cloud) or more recent.