This Microsoft Excel® spreadsheet uses the CQG XL Toolkit to pull in market data based on the symbol entered by the user. The XL Toolkit requires the customer’s FCM enable it. The data is pulled in via CQG Web API. Once enabled, then download the XL Toolkit, select the XL Toolkit from the Excel ribbon and then select Logon.
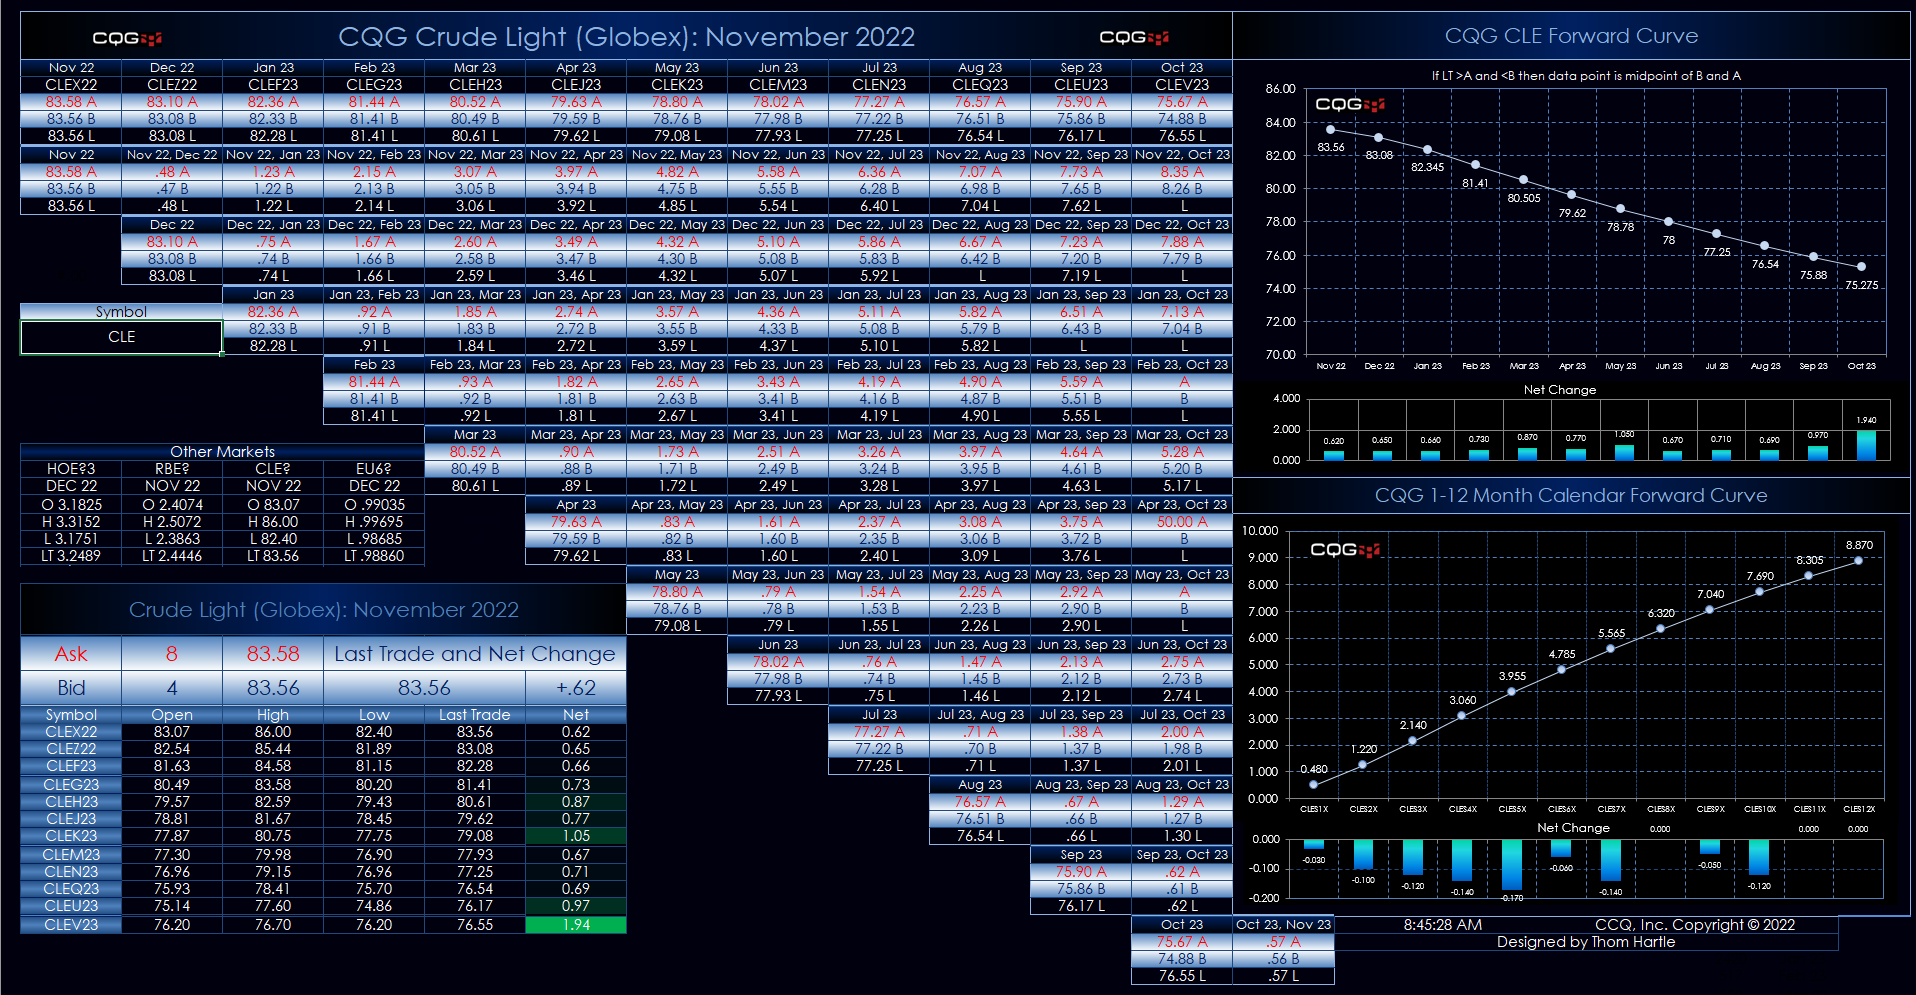
The Dashboard uses a matrix style presentation with the outrights displayed along the top row and also the first contract listed for the start of each row. The forward curves displays today's data. If the last price is outside of the best bid and best aske then the mid-point between the best bid and best ask is used in the forward curve charts. Two dashboards are available: One displays the current best bid, best ask and last trade. The second displays the current best bid, best ask and the contract volume.
It is recommended that this Excel spreadsheet be closed each night to avoid Excel memory issues.
Make sure to lower your Excel RealTimeData (RTD) throttle to 50 milliseconds or lower. Learn how to do that here.
Requires an enablement turned on by your FCM and Excel 2013 or more recent. This product is copyrighted content owned by CQG.