This post offers two topics: An introduction to the website FRED (Federal Reserve Economic Data) maintained by the Federal Reserve Bank of St. Louis and CQG's XData functionality, which is the ability to import external data into CQG for charting and analysis.
FRED
FRED, which is the acronym for Federal Reserve Economic Data has been publishing free economic data since 1991. The user can download, graph, and track 824,000 US and international time series from 114 sources.
As an introduction, two time series will be reviewed: 10-Year Constant Maturity yields and the 10-Year breakeven inflation rate. The goal is to calculate the "real" yield for Treasuries, which is the nominal yield minus the inflation rate.
From the website the: "CMT rates are calculated by first determining the Treasury yield curve rate (which compares and contrasts short-term T-bill yields against long-term investments such as T-notes and T-bonds) that corresponds to any given Treasury security, then averaging the past week's or past month's daily rates."
This next image is the website: Market Yield on U.S. Treasury Securities at 10-Year Constant Maturity
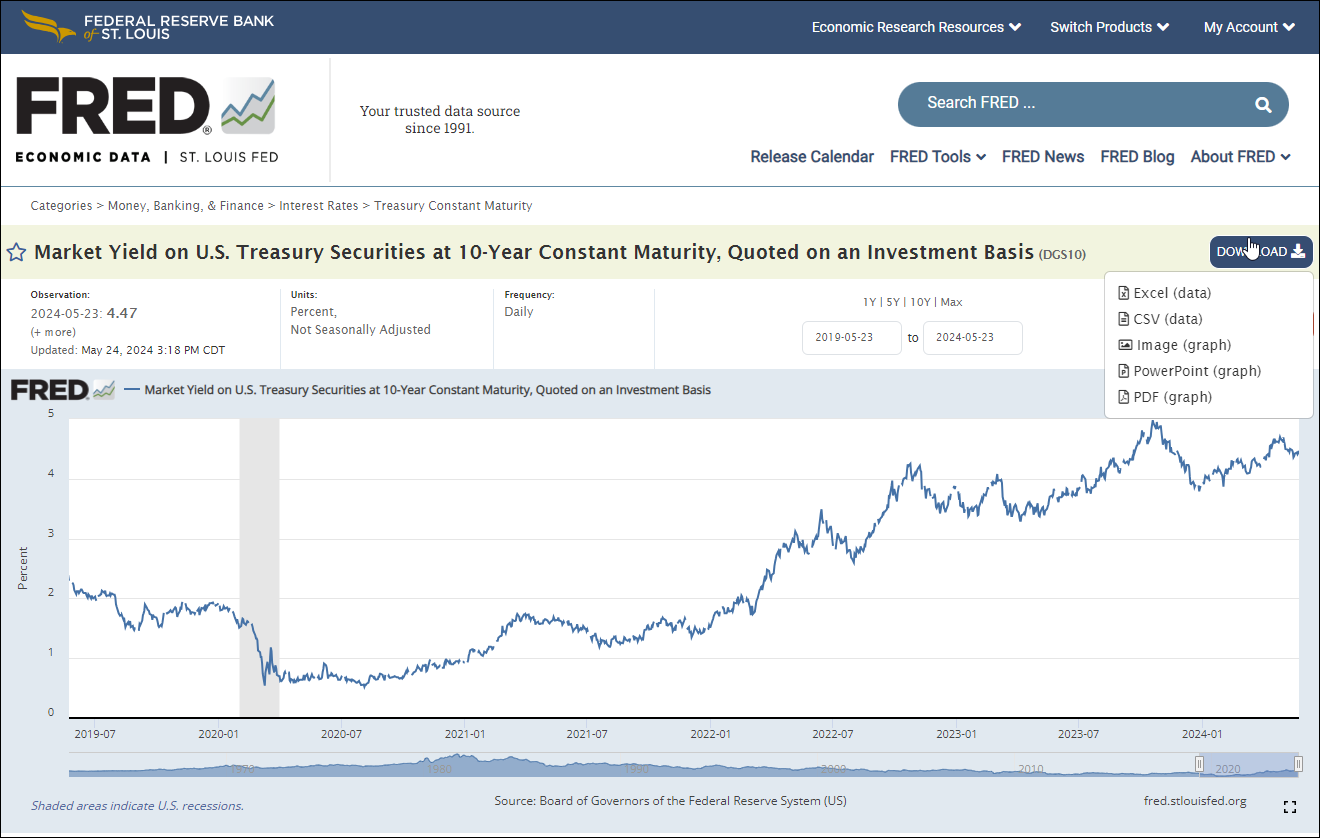
In the image above the "Download" button is highlighted showing the choices. Select "Excel (data)". Do not download CSV (data) as the CQG XData feature requires tab delimited data, which with an original Excel file the file can be modified by "Save As" *.txt.
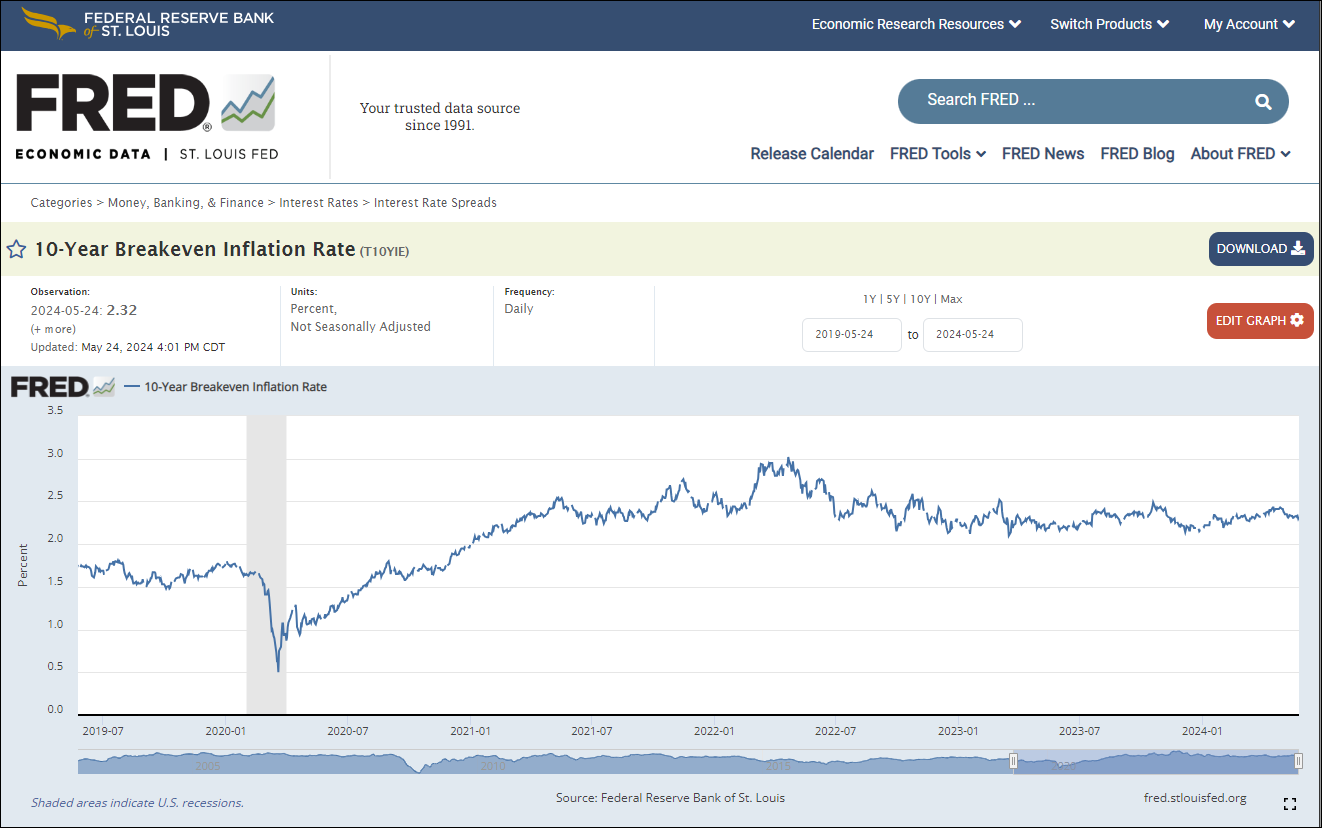
Next, the breakeven inflation rate represents a measure of expected inflation derived from 10-Year Treasury Constant Maturity Securities (BC_10YEAR) and 10-Year Treasury Inflation-Indexed Constant Maturity Securities (TC_10YEAR). The latest value implies what market participants expect inflation to be in the next 10 years, on average.
Starting with the update on June 21, 2019, the Treasury bond data used in calculating interest rate spreads is obtained directly from the U.S. Treasury Department.
10-Year Breakeven Inflation Rate
Both the Market Yield on U.S. Treasury Securities at 10-Year Constant Maturity and the 10-Year Breakeven Inflation Rate need to be downloaded as Excel files.
CQG XData
XData allows you to import your proprietary, external minute or higher time-frame bar data into CQG IC for charting and analysis. First, XData requires the Excel files to be in a certain format and contain only the data to be imported into CQG.
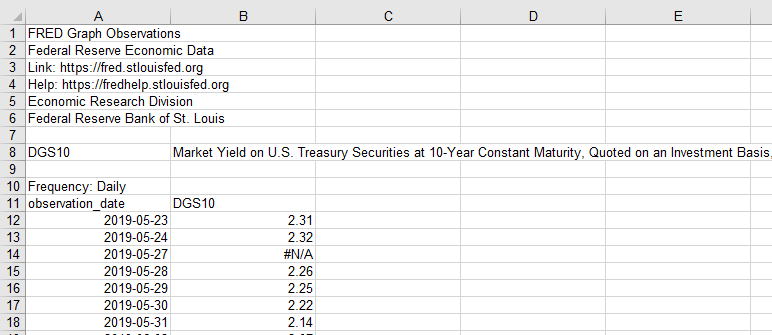
Here is the original Excel file Market Yield on U.S. Treasury Securities at 10-Year Constant Maturity.
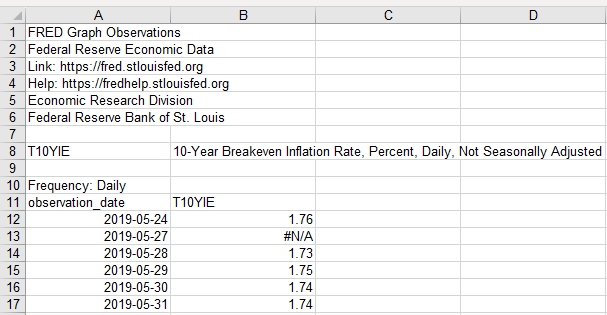
And here is the original 10-Year Breakeven Inflation Rate.
All of the data except the Date and the Yield has to be deleted. The dates need to be reformatted to MM/Day/Year and sorted from latest to oldest. And an additional column is added between the date and the yield. This represents the time column and even though these are daily bars an empty column is required for the XData function.
Once the data is sorted by date then format the date column to MM/Day/Year.
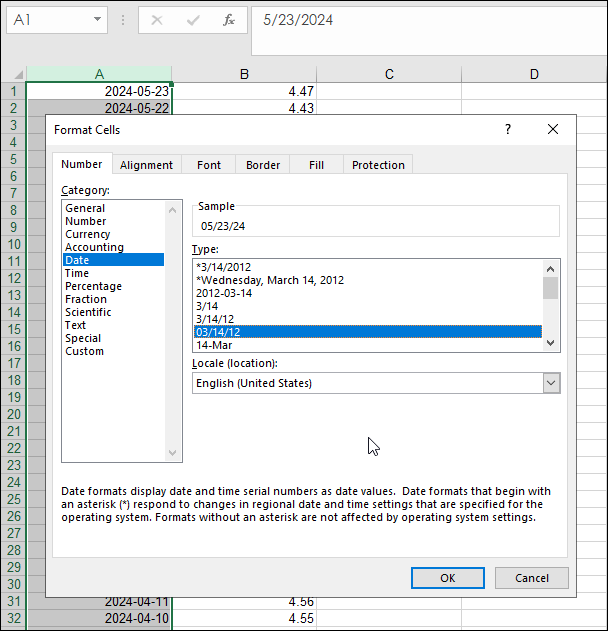
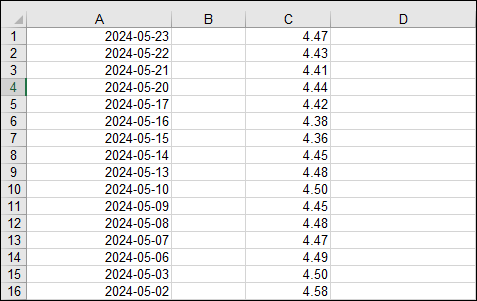
The final result in Excel is sorted/formatted date, empty column B, and yields.
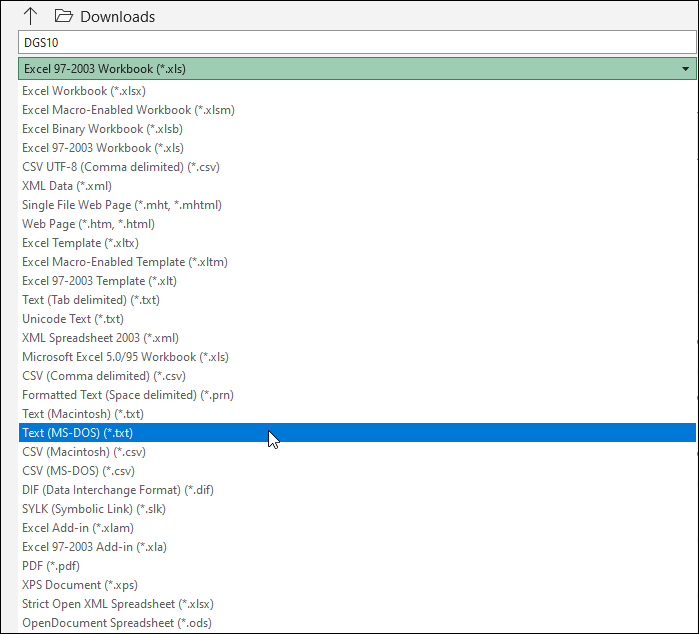
Save the Excel file as a Text file with a new name (10Yr Constant Mat Yield.txt).
Next, to use the text file for importing into the XData function a new QFomula is used. Go to Formula/QFormula/New.
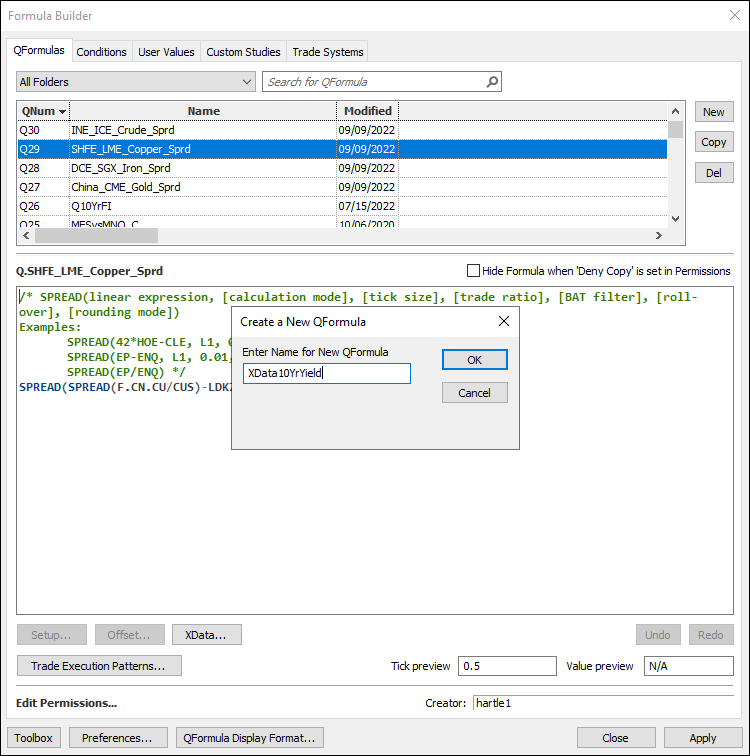
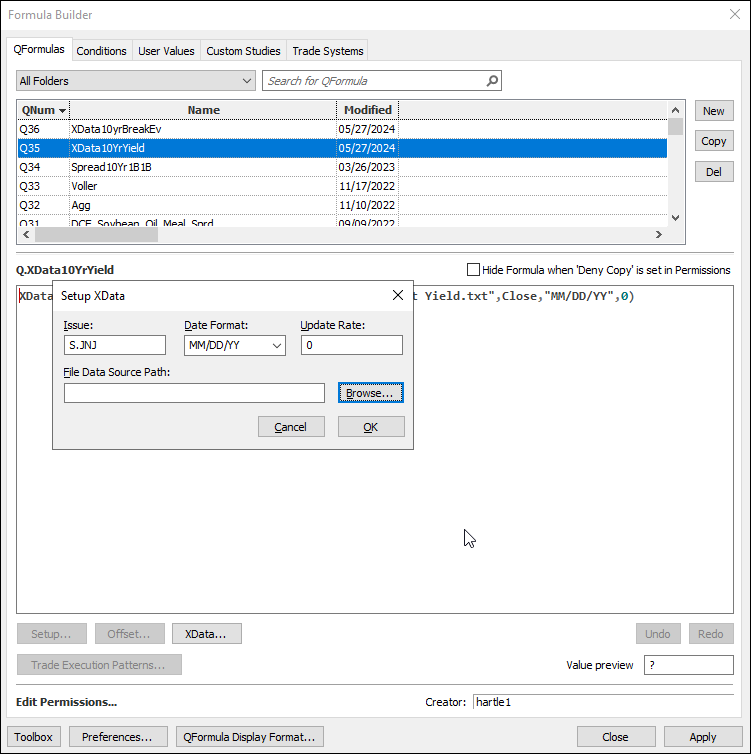
Enter a name for the QFormula. Click OK. Click the "XData" button near the lower left side of the interface.
This is where you set the price scale (a stock was used), the month format and browse to the location of the text file.
The QFormula is now available to chart.
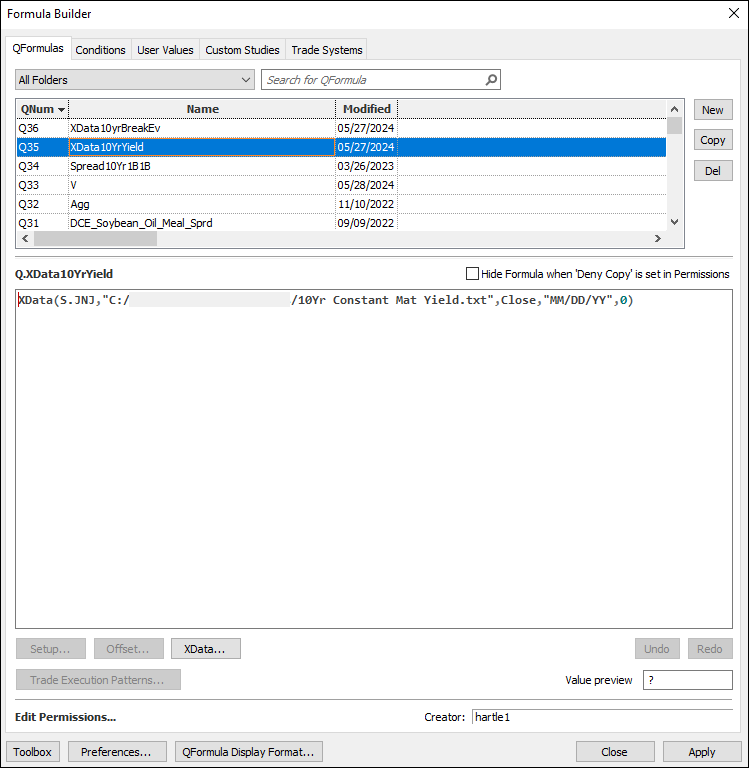
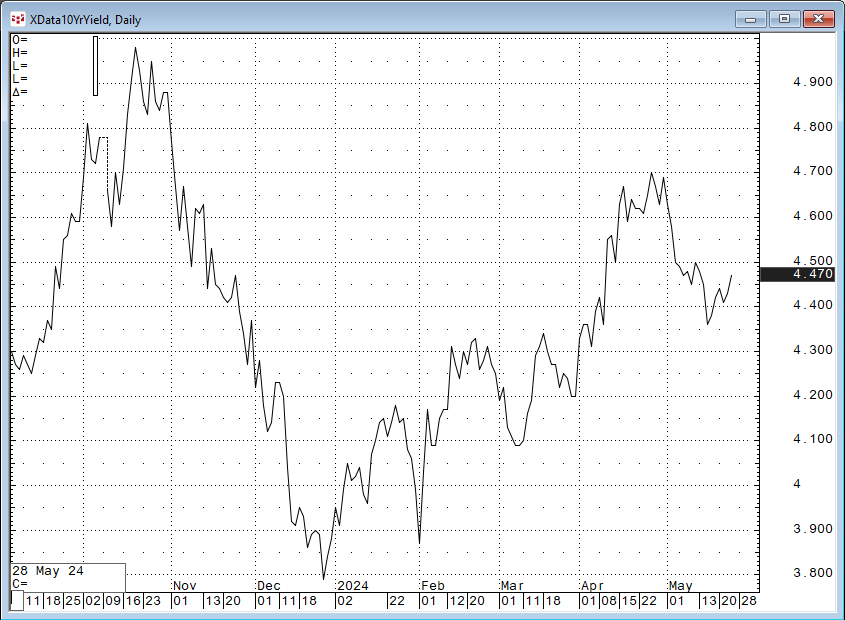
Open a chart and enter the QFormula number (Q35).
Repeat this process for the 10-Year Breakeven Inflation Rate to create a QFormula and chart. This QFormula was named XData10yrBreakEv.
The "Real Yield" is the difference between the 10-Year Constant Maturity (Q35) and the 10-Year Breakeven Inflation Rate (Q36).
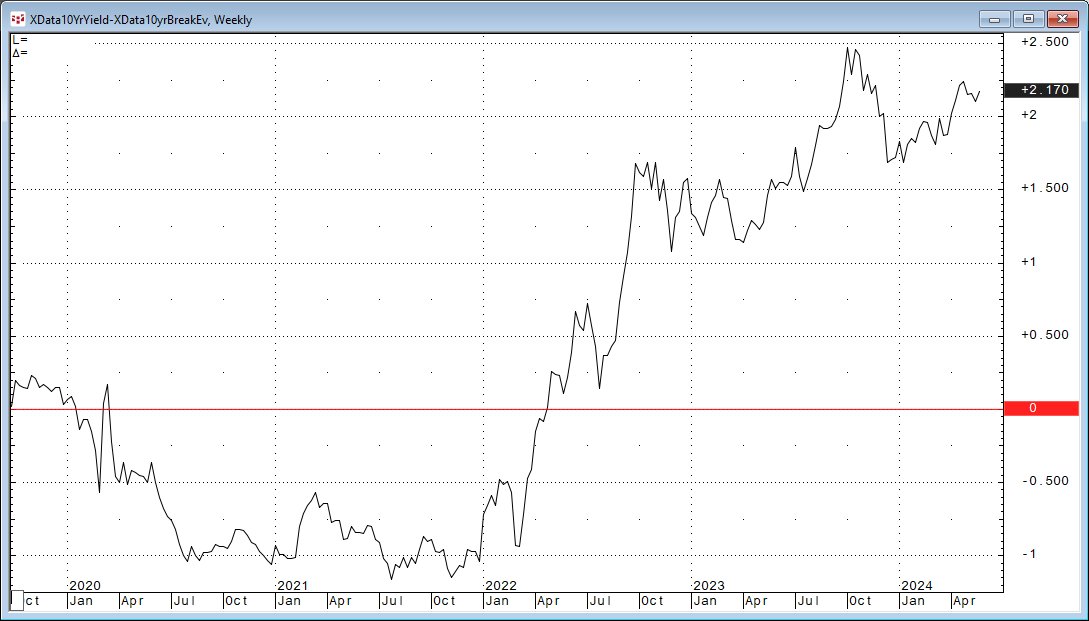
The image above shows that real yields were negative for over two years.
This post introduced the Federal Reserve Economic Data (FRED) website, how to extract data, how to convert the Excel file to a Text file, how to create a QFormula for charting the data in CQG.
Requires CQG Integrated Client or CQG QTrader, and Excel 2010 or higher. Excel has to be installed on the local computer, not in the cloud.