This post covers two topics: Details using the Chart Analog Overlay Study and the Percent Bar chart type.
Traders use the analog study to compare how markets are trading relative to each other. The Analog study enables up to ten market's price actions to be displayed on the same chart. This study can be used with all chart types.
The bars displayed on the Percent Bar chart type are displayed as percentages from a user-selected base price or from the close of a bar determined by the base index or a particular date.
To start, open a bar chart and click Analog on the toolbar.

This will duplicate the starting chart as see in the chart title bar in the image below. When the chart is in analog mode, the AnaLock button appears on the study toolbar. When this button is turned on, the scales, both time and price, are locked for simultaneous scaling and scrolling of all charts. When this button is turned off, you can modify each chart's price and time scale separately. To change the scale, click and drag. Modification is made only to the foreground chart. To change the background chart, bring it to the foreground (right-click a bar for those options).

When the additional chart is added, change the color of the new chart by right-clicking a bar and select "Set Bar Color."
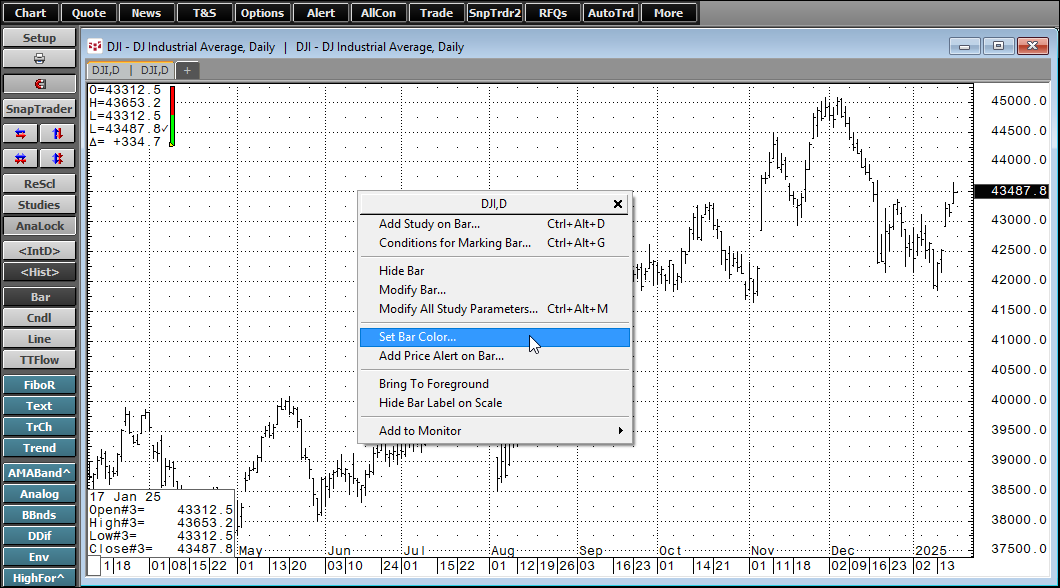
Below the new chart is blue.

Change the symbol. Here, the new symbol is "SPC5."

As seen in the new chart above the vertical scale price axis is very different for the two instruments. Right-click the price axis and select "Place Scale to Left."

Now, the price scale for symbol "SPC5" is on the left and the scale for "DJI" is on the right.

Using the Chart Analog Overlay Study and the Percent Bar chart type solves any scaling issues between instruments.
The bars shown on the Percent Bar chart type are displayed as percentages from a user-selected base price or from the close of a bar determined by the base index or a particular date. This post will be using "Date" and that date is the last trading day for 2023.

Typically, use the Percent Bar chart to start, but here the steps to modify a previously built Chart Analog Overlay Study with daily bars is detailed.
First, right-click the symbol in the chart titles bar and select "Percent Bar" from the menu.

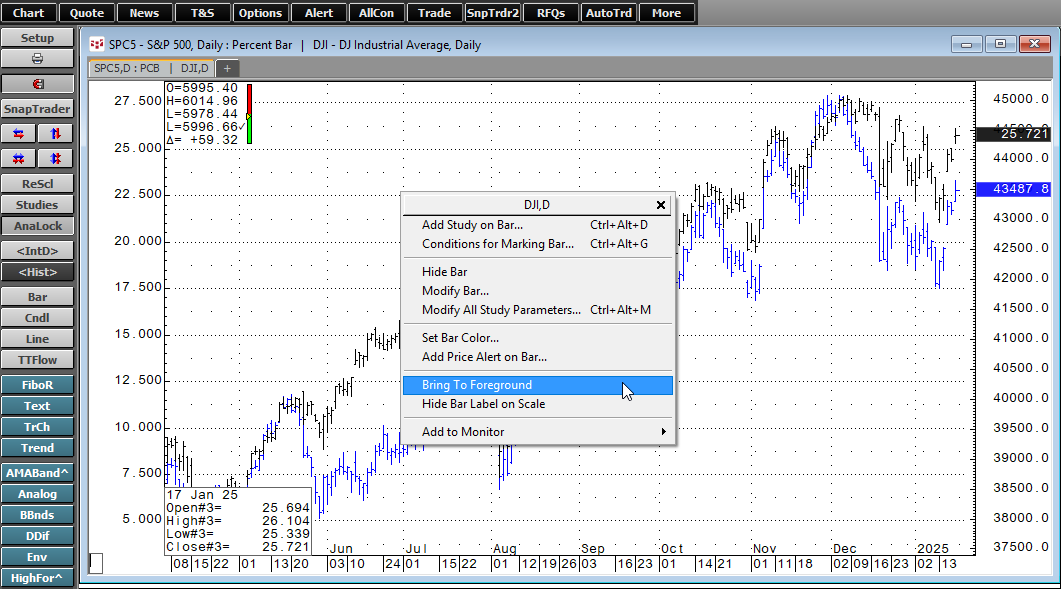
Next, left-click a bar in the second instrument and select "Bring to Foreground."
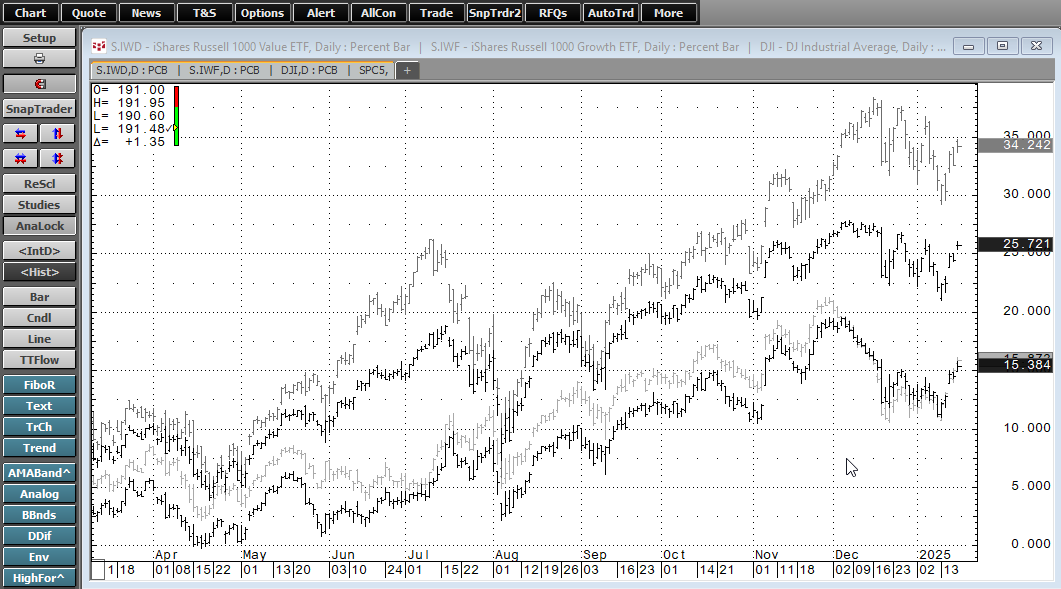
Next, right-click the instrument in the chart title bar and select "Percent Bar." Right-click the price axis and select "Same Scale." Next, add two new instruments by left-clicking "Analog" once and enter "IWF", then left-click "Analog" and enter "IWD."
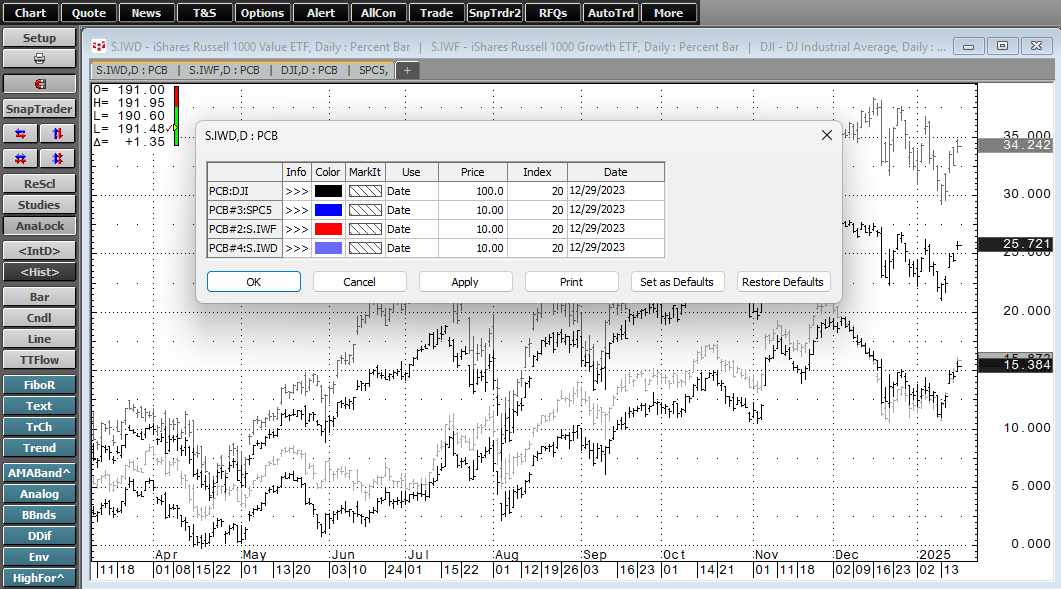
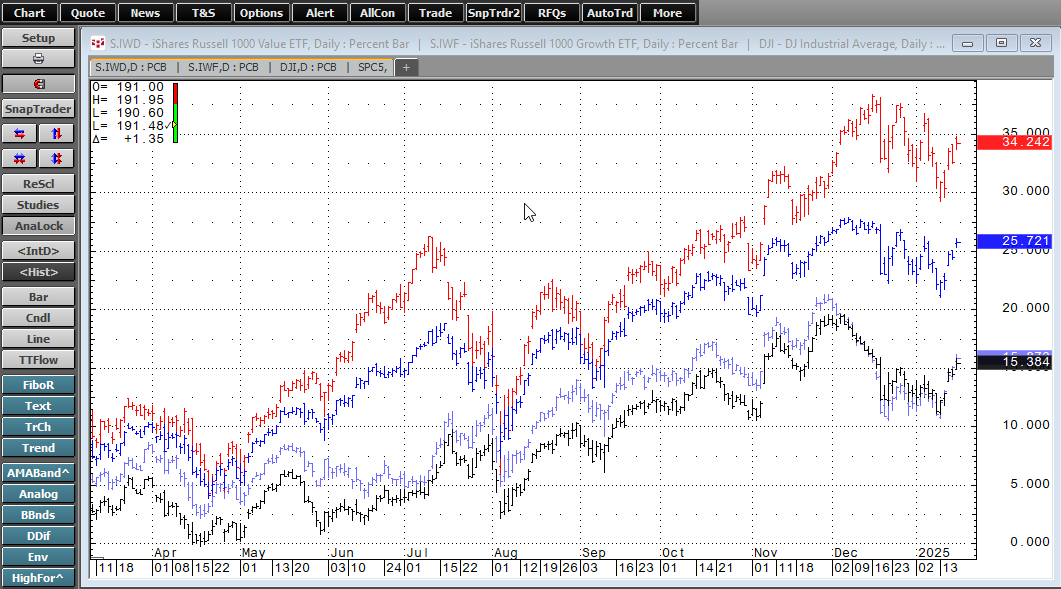
With the four instruments displayed then right-click on the chart background and select "Modify All Study Parameters." The dialog in the image below opens showing the same date for all four instruments and you can change the color of each instrument.
Below is the final result.
The Analog study using as the basis chart the Percent Bar chart is a useful tool for comparing market performance. A downloadable CQG PAC is available at the bottom of the post.
Requires CQG IC or QTrader.