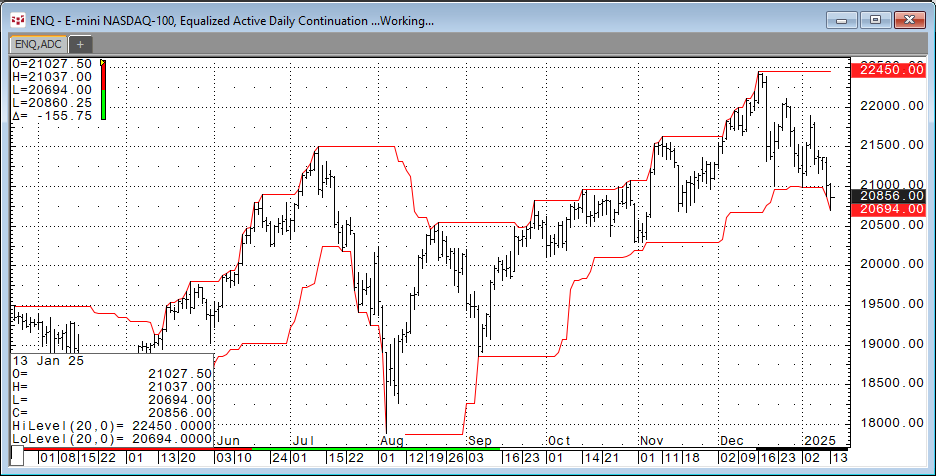
The Level Function plots two lines, which identify the highest and lowest levels attained over a defined period. The chart below displays the Level Function using the default lookback period of 20 bars. Basically, the highest high and the lowest low over the last 20 bars are plotted on the chart. Traders think of these lines as support and resistance levels.
The Level function can also be applied to a study. This could be of use as many studies, such as oscillators, will display values that may be high or low, but without a frame of reference the term high or low can be vague. The Level Function can provide a frame of reference.
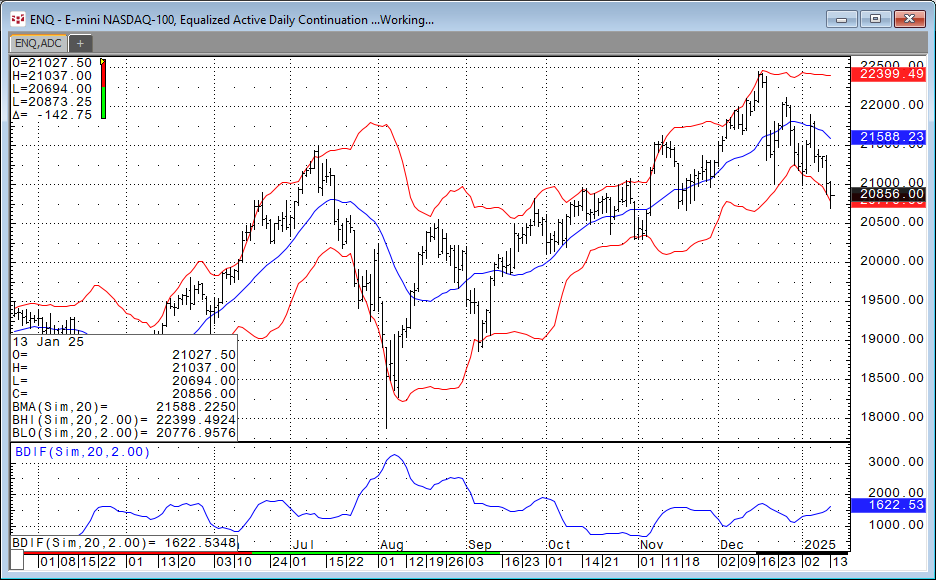
The image below replaced the Level Function with Bollinger Bands.
The study displayed in the bottom pane is the Bollinger Bands Difference (BDIF). The study is simply the difference between the upper and lower Bollinger Bands. One idea is if the Bollinger Bands Difference is low then the market is trading sideways, and a trend may emerge.
The Level Function applied to a study will be used as a ratio:
(Study - Low-level Study)/(High-Level Study - Low-level Study)
This same ratio is applied using the Bollinger Bands Difference study:
(BDIF(@,Sim,20,2.00)-LoLevel(BDIF(@,Sim,20,2.00),20,0))/(HiLevel(BDIF(@,Sim,20,2.00),20,0)-LoLevel(BDIF(@,Sim,20,2.00),20,0))
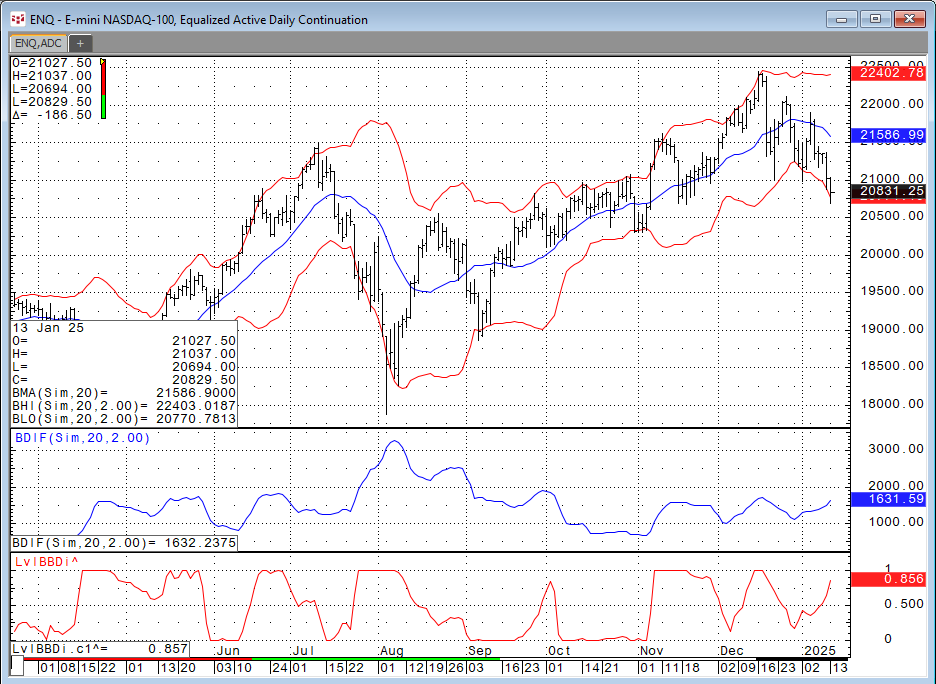
The image below has the above ratio displayed for the Bollinger Bands Difference.
The example used the default parameters for the Level Function and the BDif study. The Level Function does provide a frame of reference for comparing relative values. There is a downloadable CQG PAC at the bottom of the post supplying a page with two charts and the Level Function applied to the Bollinger Band Difference study.
Requirements: CQG Integrated Client or QTrader.


