From the ARK website: "Companies within ARKG are focused on and are expected to substantially benefit from extending and enhancing the quality of human and other life by incorporating technological and scientific developments and advancements in genomics into their business." More information is available here: ARKG Overview.
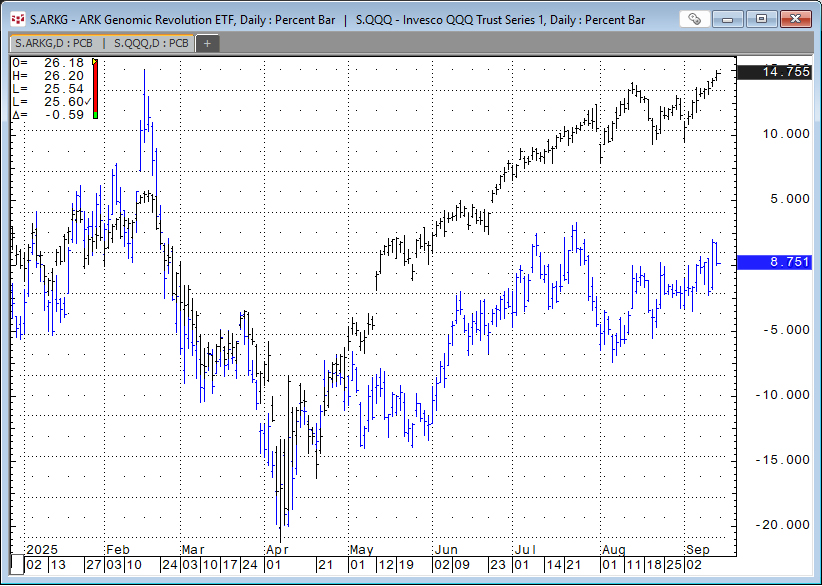
The chart below is the percentage net change from 12/31/2024 for the QQQ ETF and the ARKG ETF. Currently, the fund is up 8.75%.
Here is a list of the current top ten holdings.
| TEMPUS AI INC | TEM | 12.45% |
| CRISPR THERAPEUTICS AG | CRSP | 9.39% |
| TWIST BIOSCIENCE CORP | TWST | 5.06% |
| RECURSION PHARMACEUTICALS-A | RXRX | 5.05% |
| NATERA INC | NTRA | 4.52% |
| PERSONALIS INC | PSNL | 4.49% |
| GUARDANT HEALTH INC | GH | 4.22% |
| BEAM THERAPEUTICS INC | BEAM | 3.99% |
| ADAPTIVE BIOTECHNOLOGIES | ADPT | 3.98% |
| 10X GENOMICS INC-CLASS A | TXG | 3.84% |
Below is an image of the downloadable Excel Dashboard. During the trading session, the Excel dashboard dynamically ranks the individual stocks held by ARKG. The Excel dashboard displayed below shows the top fifteen positive and bottom fifteen negative performers as histogram bar charts, along with their respective net percent change for today's trading session.
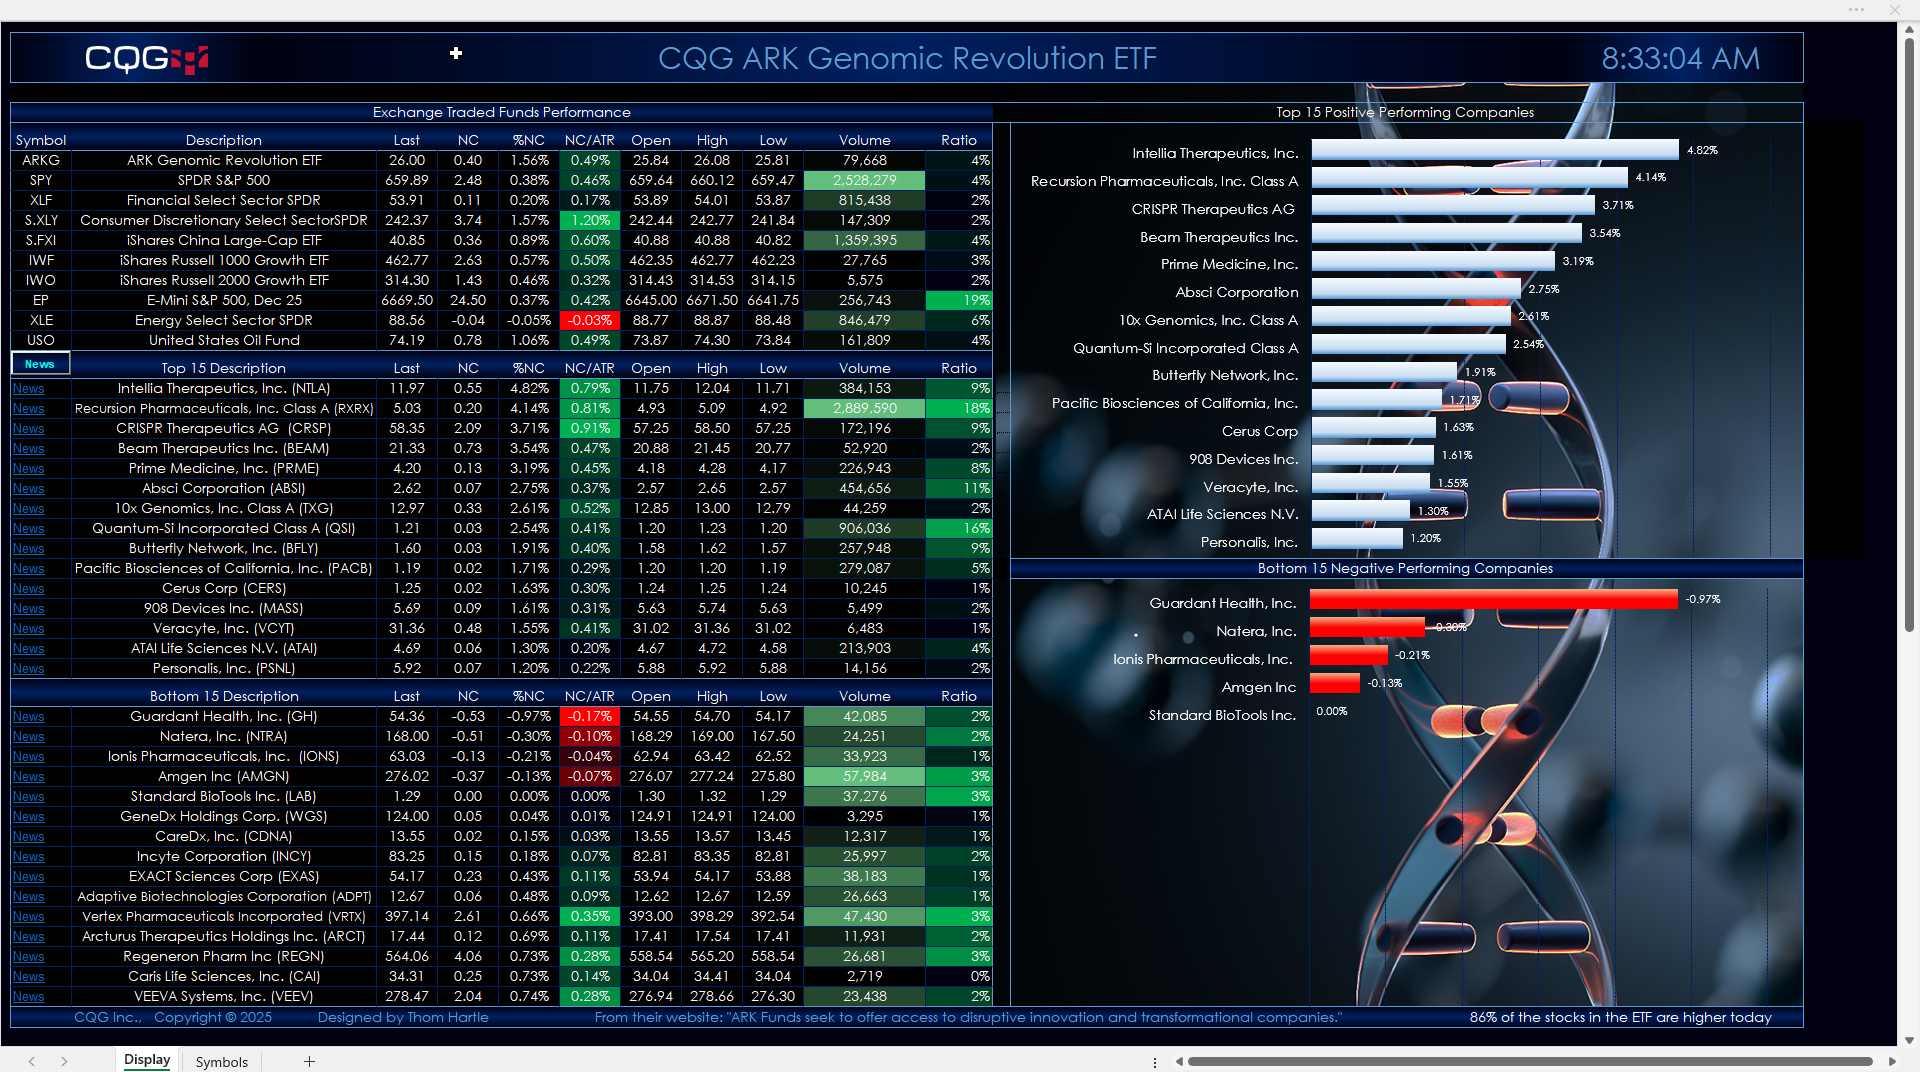
The top section of the quote display allows you to enter your own symbols.
The second section displays the top fifteen performers. The third section displays the bottom fifteen performers.
Quote data includes today's net change as a ratio to the 21-day Average True Range study. Next to today's traded volume is a column that calculates the ratio of today's volume versus the 21-day average of the volume. This ratio column gives you a sense of how active today's trading is relative to recent history. Readings of 100% and higher indicate active trading.
A key feature next to each company name is a link to Yahoo Finance. Clicking the News link will take you to the Yahoo page for that symbol. Note that this could take approximately 30 seconds to open in a browser. Turning off Extensions in your browser will make this happen faster.
If you open another Excel spreadsheet, then this dashboard will no longer be the active spreadsheet. The macro that updates the links and ranks the stocks by performance will stop. To start the macro, simply click the News toolbar button in the first column.
The fund is actively managed. The current holdings are as of 8/29/2025. There is a Symbols tab with instructions detailing where to download the latest posted spreadsheet with the current holdings and steps update the dashboard.
Make sure to lower your Excel Realtime Data (RTD) throttle to 50 milliseconds or lower. Learn how to do that here.
Two dashboards are available: One has a solid black background, and one has an image background.
Requires CQG Integrated Client or CQG QTrader, data enablements for the NYSE and Nasdaq stocks, and Excel 2016 or more recent.