From the ARK website: "Companies within the ARKW are focused on and expected to benefit from shifting the bases of technology infrastructure to the cloud, enabling mobile, new and local services, such as companies that rely on or benefit from the increased use of shared technology, infrastructure and services, internet-based products and services, new payment methods, big data, the internet of things, and social distribution and media." More information is available here: ARKW Overview.
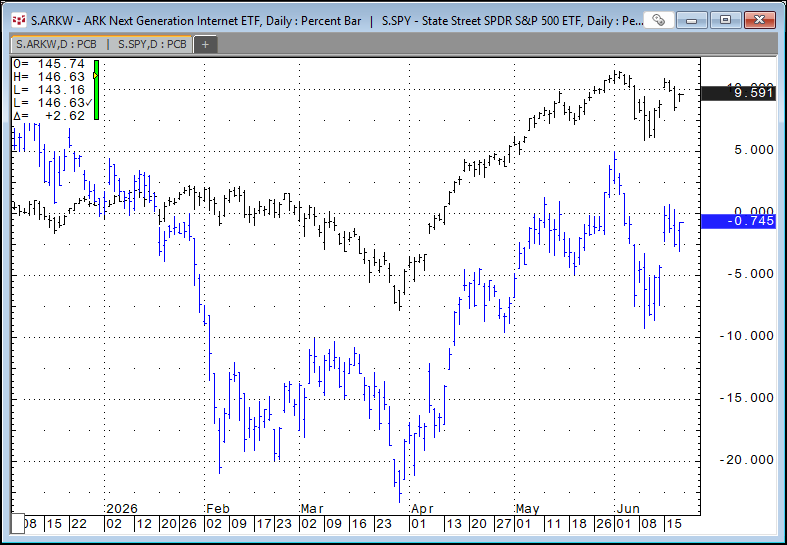
The chart below is the percentage net change from 12/31/2025 for the QQQ ETF and the ARKW ETF. Currently, the ETF is lower just above -1%.
Here is a list of the current top ten holdings as of 6/18/2026.
| Ticker | Company Name | Weight |
|---|---|---|
| AMD | ADVANCED MICRO DEVICES | 8.27% |
| TSLA | TESLA INC | 7.64% |
| HOOD | ROBINHOOD MARKETS INC - A | 6.04% |
| - | ARK BITCOIN ETF HOLDCO (ARKW) | 4.76% |
| ROKU | ROKU INC | 4.44% |
| SHOP | SHOPIFY INC - CLASS A | 4.21% |
| CRWV | COREWEAVE INC-CL A | 3.92% |
| GOOG | ALPHABET INC-CL C | 3.81% |
| AMZN | AMAZON.COM INC | 3.58% |
| SPCX | SPACE EXPLORATION TECHN-CL A | 3.46% |
Below is an image of the downloadable Excel Dashboard. During the trading session, the Excel dashboard dynamically ranks the individual stocks held by ARKW. The Excel dashboard displayed below shows the top fifteen positive and bottom fifteen negative performers as histogram bar charts, along with their respective net percent change for today's trading session.
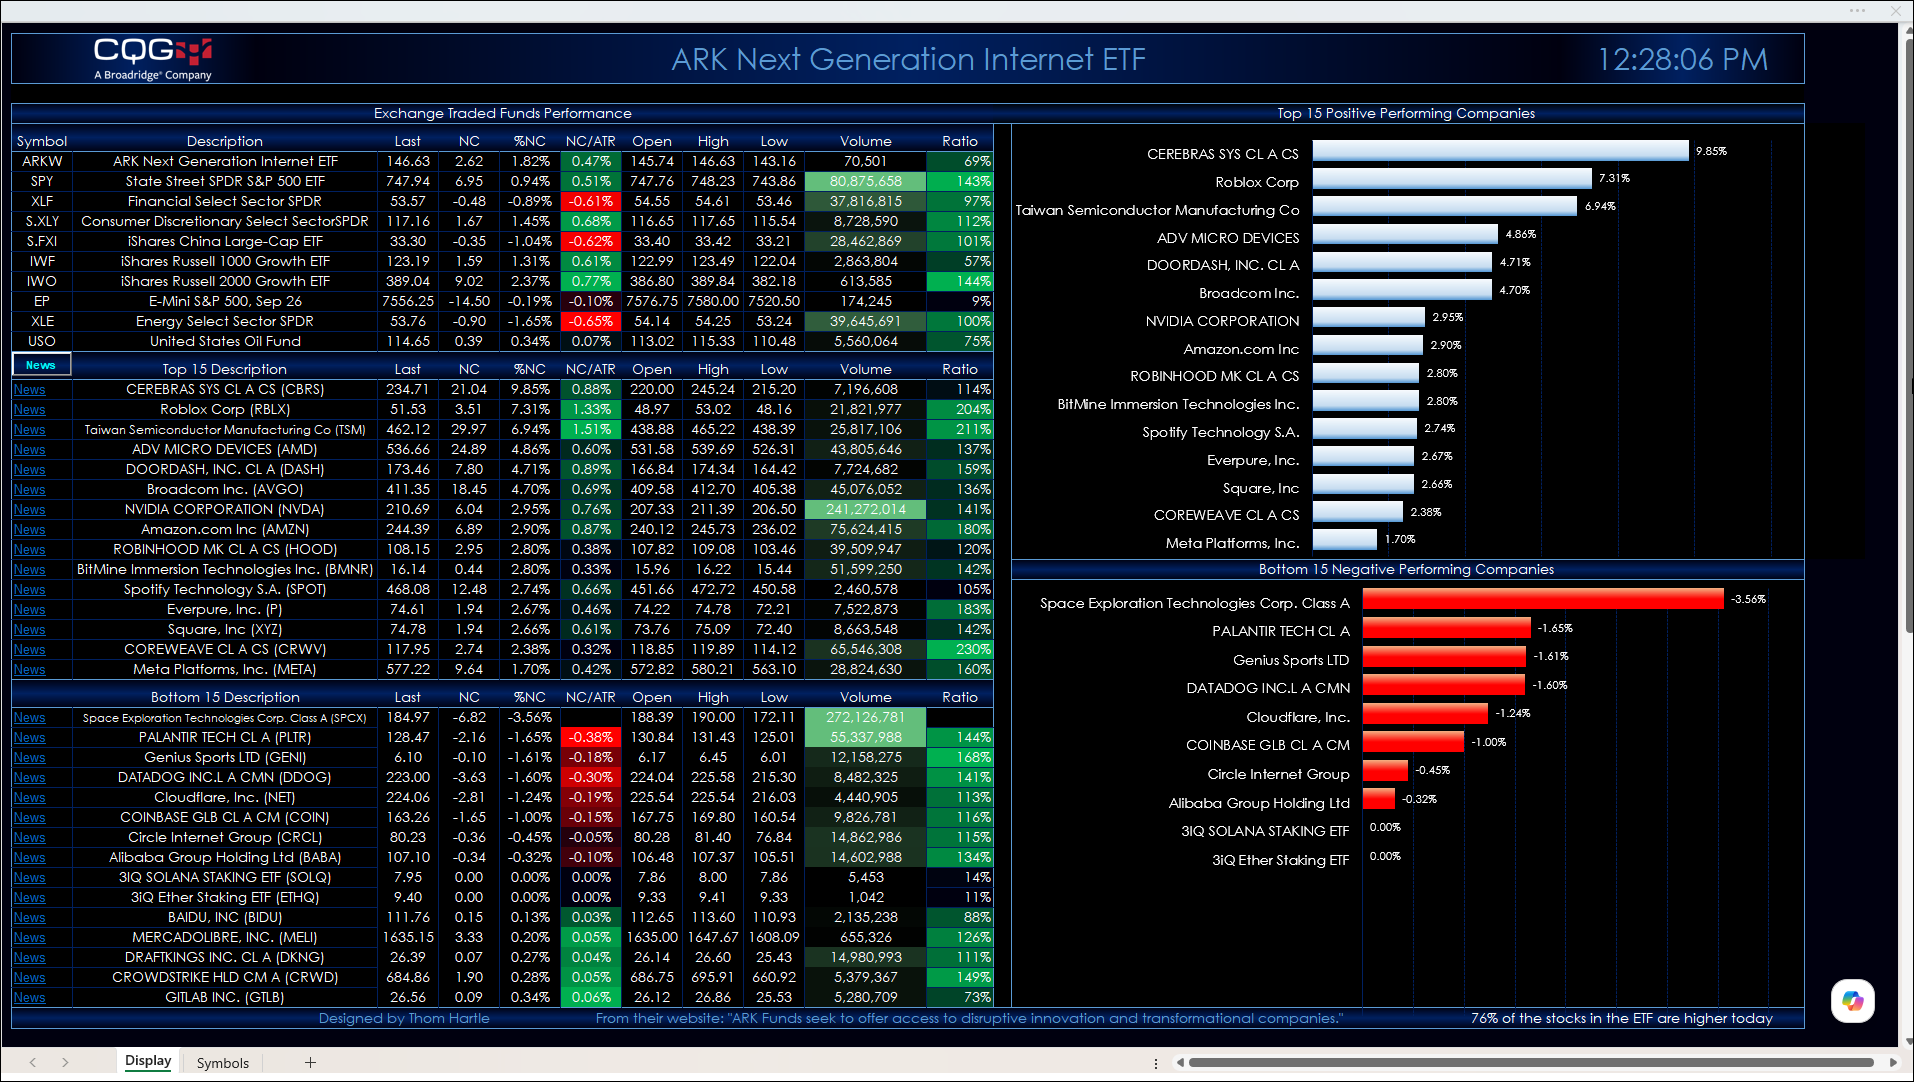
The top section of the quote display allows you to enter your own symbols.
The second section displays the top fifteen performers. The third section displays the bottom fifteen performers.
Quote data includes today's net change as a ratio to the 21-day Average True Range study. Next to today's traded volume is a column that calculates the ratio of today's volume versus the 21-day average of the volume. This ratio column gives you a sense of how active today's trading is relative to recent history. Readings of 100% and higher indicate active trading.
A key feature next to each company name is a link to Yahoo Finance. Clicking the News link will take you to the Yahoo page for that symbol. Note that this could take approximately 30 seconds to open in a browser. Turning off Extensions in your browser will make this happen faster.
If you open another Excel spreadsheet, then this dashboard will no longer be the active spreadsheet. The macro that updates the links and ranks the stocks by performance will stop. To start the macro, simply click the News toolbar button in the first column.
The fund is actively managed. The current holdings are as of 6/19/2026. There is a Symbols tab with instructions detailing where to download the latest posted spreadsheet with the current holdings and steps update the dashboard.
Make sure to lower your Excel Realtime Data (RTD) throttle to 100 milliseconds or lower. Learn how to do that here.
Two stocks are traded on the Toronto Stock Exchange (TSX): 3iQ Ether Staking ETF (symbol S.CA.ETHQ) and 3IQ SOLANA STAKING ETF (S.CA.SOLQ). If you are not enabled for this exchange then remove the symbols from the bottom of the Symbols tab.
Requires CQG Integrated Client or CQG QTrader, data enablements for the NYSE and Nasdaq stocks, Toronto Stock Exchange (TSX) and Excel 2016 or more recent.