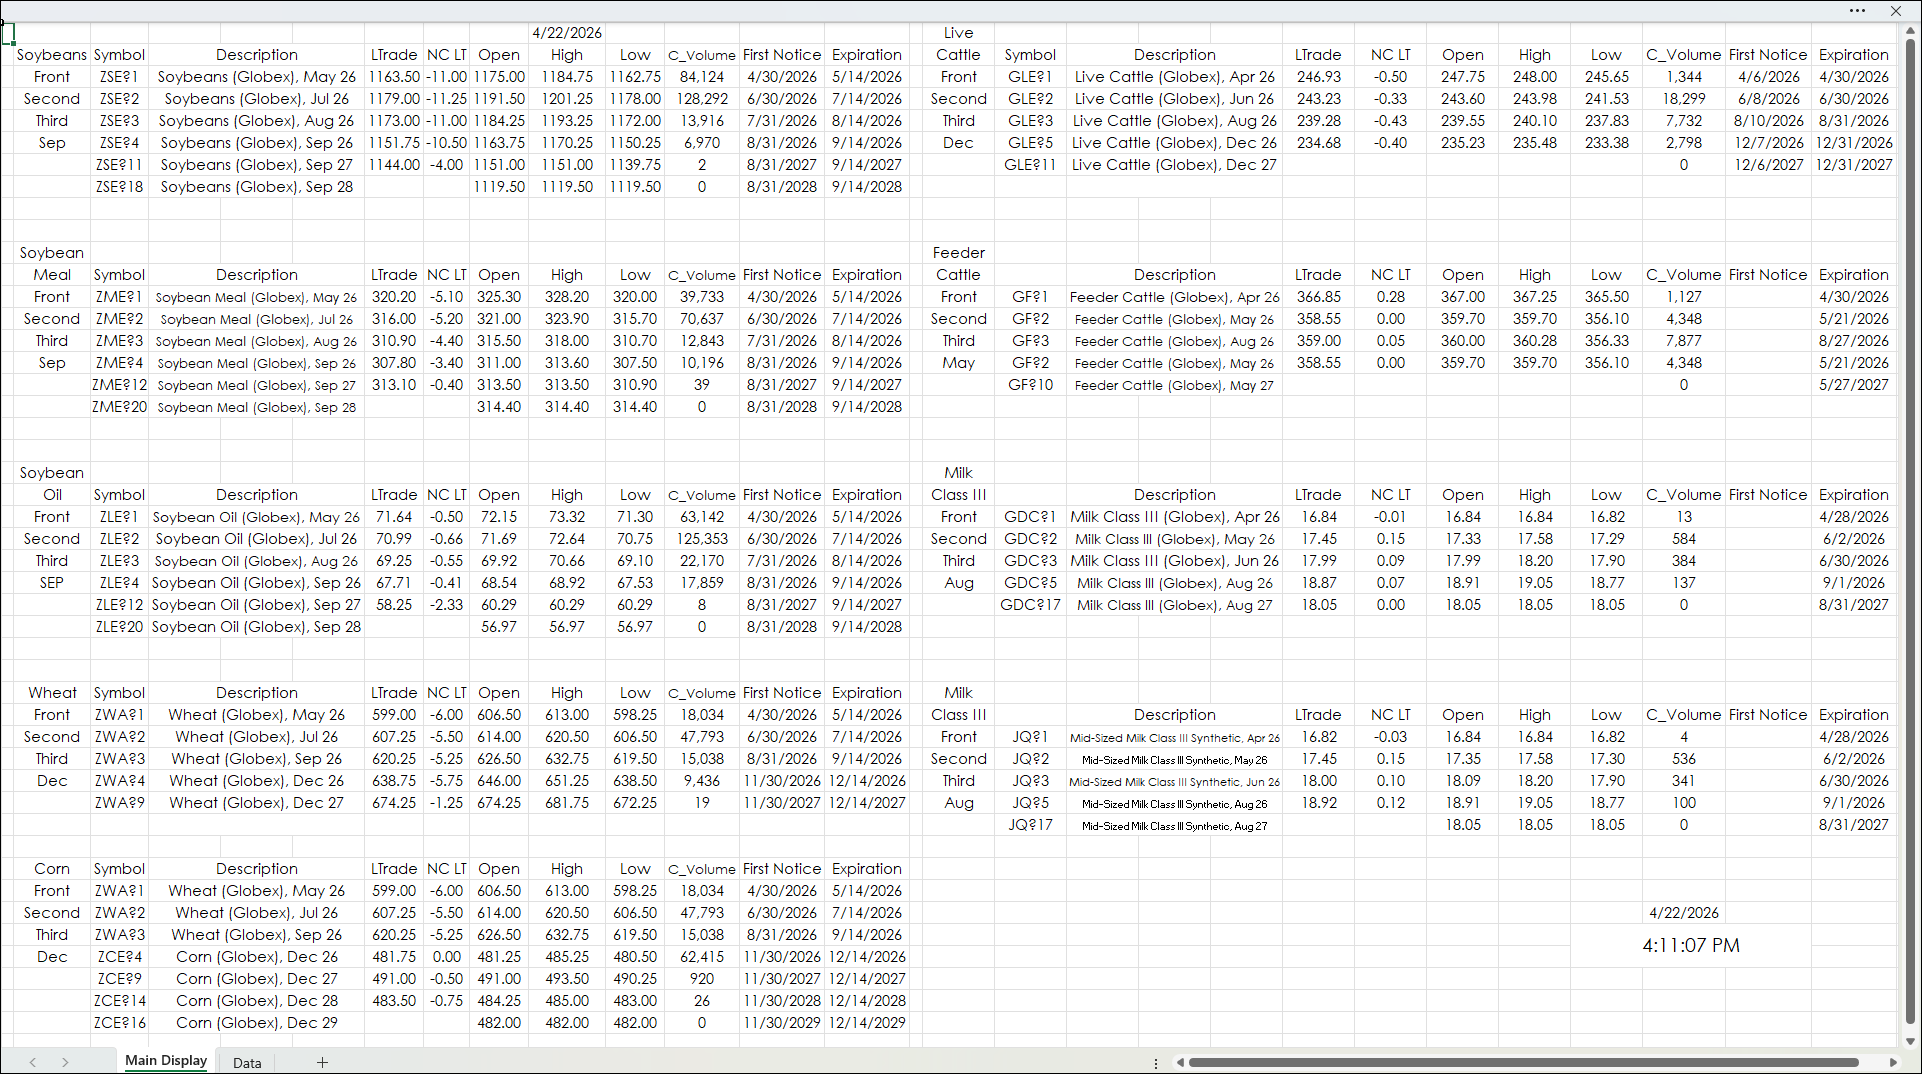
This Excel dashboard tracks agriculture markets and uses Excel's FILTER Function to pull the same month's contract data from each year.
The markets tracked are Soybeans, Soybean Meal, Soybean Oil, Wheat, Corn, Live Cattle, Feeder Cattle, Lean Hogs and Milk Class III.
The Soybean block is this:
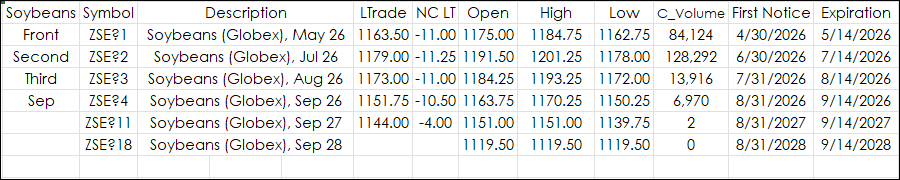
The symbols for the first three contracts are entered manually in the Symbol column. Wild card symbols are used which will automatically roll. The fourth, fifth, and sixth symbols were found using Excel's FILTER function from the month entered (Sep) into the first column under "Third".
If Excel functions XLOOKUP or VLOOKUP were used, then the first occurrence of the month from the Data tab would be returned. The FILTER function returns all occurrences.
=FILTER(Data!B1:B21,Data!C1:C21='Main Display'!B6)
This is the section of the DATA tab for Soybeans.
The Filter function found three occurrences of "SEP" and returns the symbols from column B.
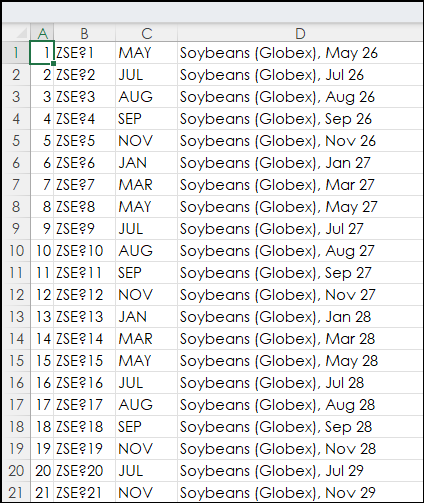
The FILTER Function spills the data into the three cells in the Symbol column. If the cells are not empty, then an error occurs.
More examples of using the FILTER function are detailed in Excel 365 Filter Function.
This image is the full dashboard:
The dashboard can be modified.
Requirements: CQG Integrated Client or QTrader, exchange enablements for the CME Group, and Excel 365 (locally installed, not in the Cloud) or more recent.