The Excel dashboard at the bottom of the post displays the stocks tracked in the NASDAQ 100 Index broken down by the 11 Global Industry Classification Standard (GICS) sectors.
The NASDAQ 100 is a stock market index made up of equity securities issued by 100 of the largest non-financial companies listed on the NASDAQ Stock Exchange.
From Google AI: "The Global Industry Classification Standard (GICS) is a four-tiered, hierarchical industry framework comprising 11 core sectors, 25 industry groups, 74 industries, and 163 sub-industries. Developed by MSCI and S&P Dow Jones Indices, it classifies companies globally based on primary business activities, such as revenue, earnings, and market perception."
The dashboard has two tabs: Chart and Data.
The data tab pulls in using RTD formulas the percentage net change based on the symbols in column A. Also listed is the sector for each symbol. The percentage net change is ranked and the top to the bottom performers are listed (both the symbol and the associated Sector).
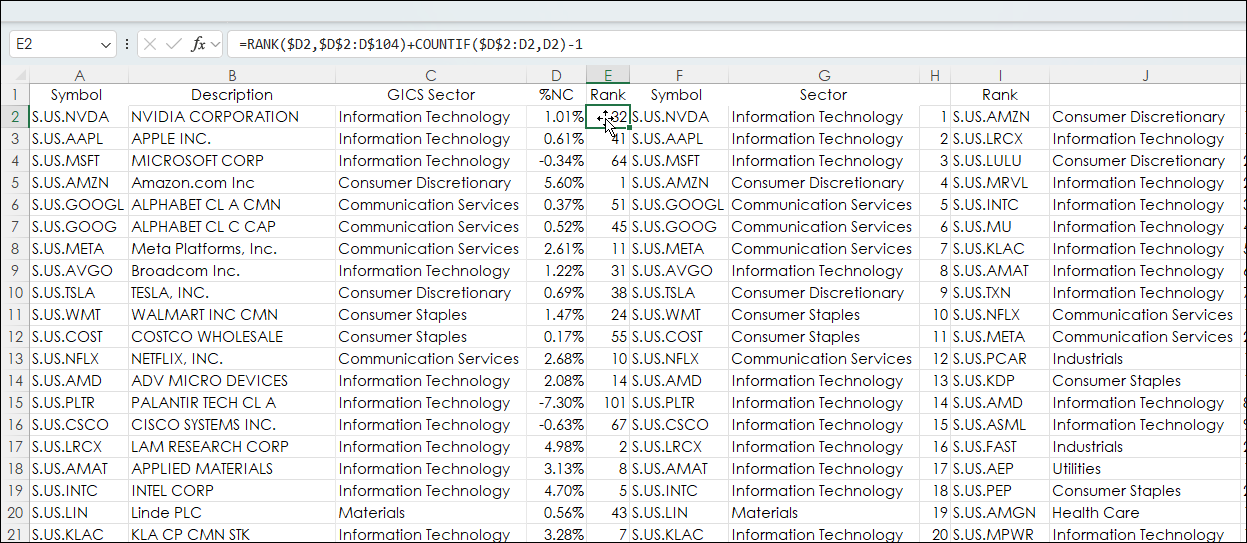
The number of stocks in each sector is counted.
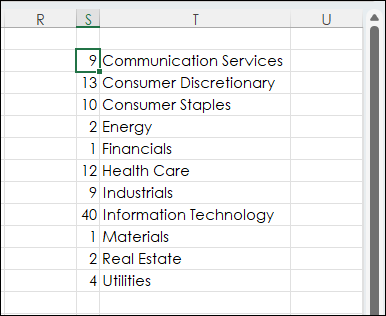
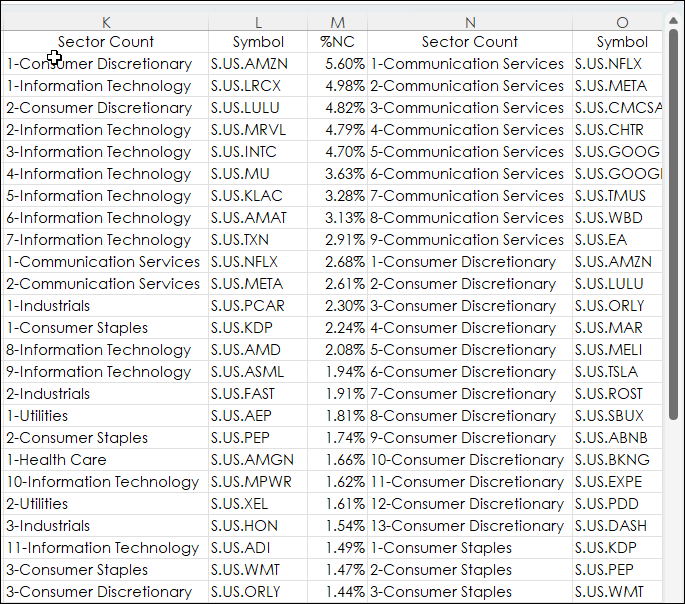
Then the stocks are ranked based on the count within each sector. For example, in the image below there are 9 stocks in the Communications Services Sector and 13 stocks in the Consumer Discretionary Sector. The symbols based on the ranked percentage net change within the Sectors are pulled in.
This market data above is used on the Chart tab.
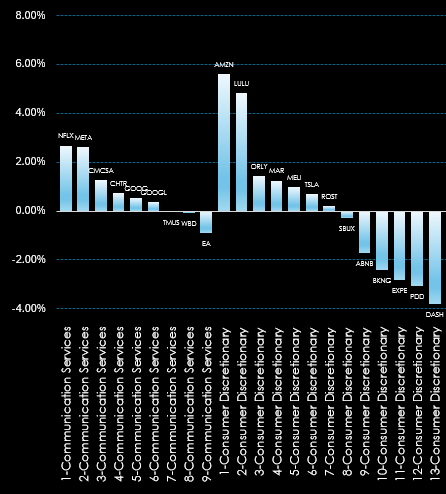
The full chart looks like this:
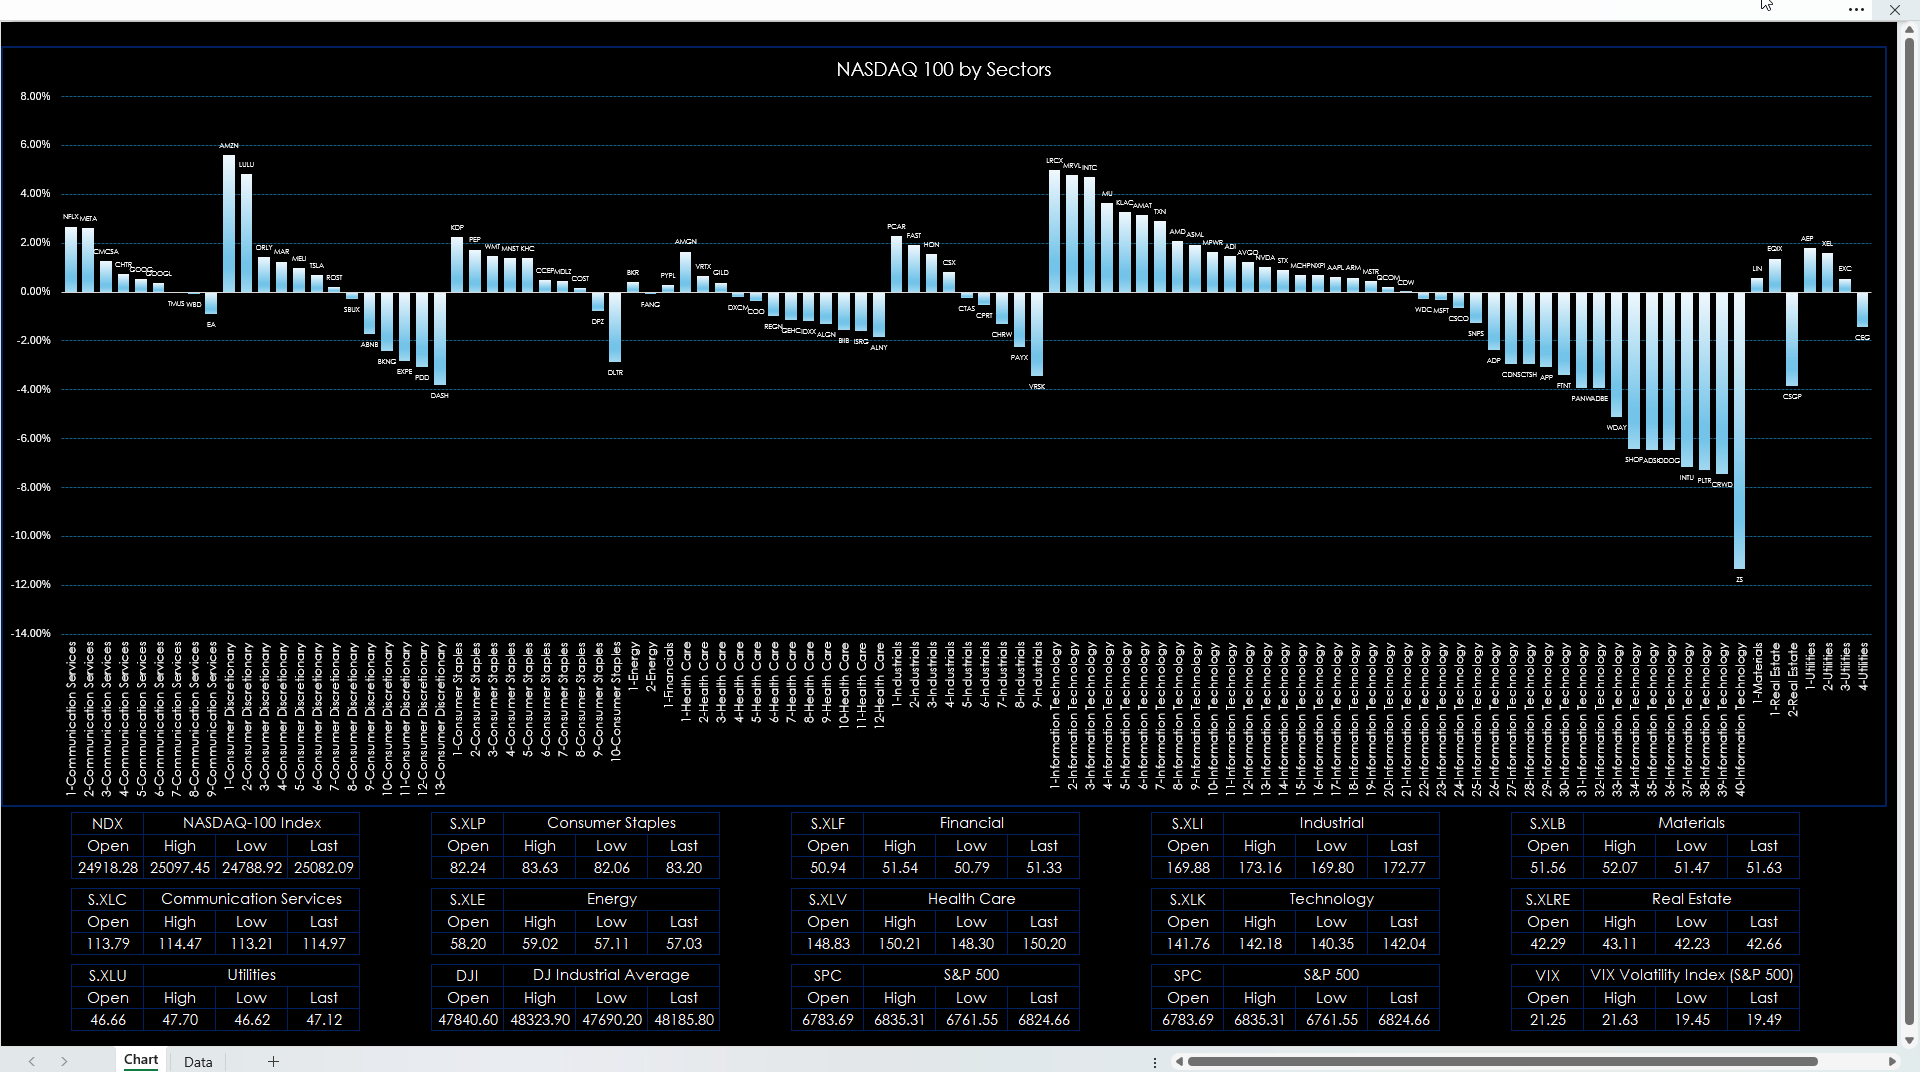
There is a quote section below the chart showing the market performance for the NASDAQ 100 and the individual sector ETFs. Other symbols can be entered.
Requirements: CQG Integrated Client or QTrader, enablements for the NASDAQ Exchange and NYSE American, and Excel 365 (locally installed, not in the Cloud) or more recent.
This post was assisted by AI and reviewed by Thom Hartle.