
From the iShares website:
The iShares MSCI USA Momentum Factor ETF (Symbol: MTUM) seeks to track an index of U.S. stocks exhibiting relatively high price momentum. The fund offers a way to capture trends in the market by investing in companies with strong recent performance.
This post details an Excel Dashboard for tracking the performance of the individual companies grouped by sectors.
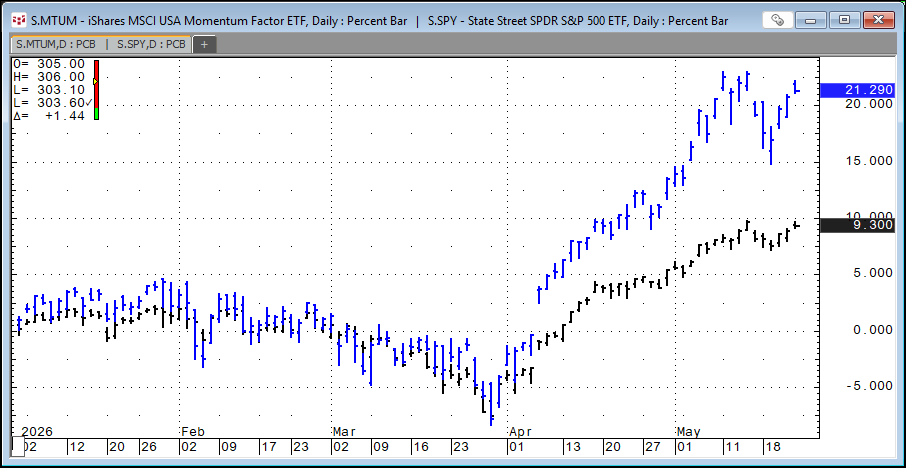
This ETF (blue line) has outperformed the S&P 500 ETF (black line) during April and May of 2026.
The Fund seeks to track the investment results of the MSCI USA Momentum SR Variant Index (the "Underlying Index"), which consists of stocks exhibiting relatively higher momentum characteristics than the traditional market capitalization-weighted parent index, the MSCI USA Index (the "Parent Index"), as determined by MSCI Inc. (the "Index Provider" or "MSCI").
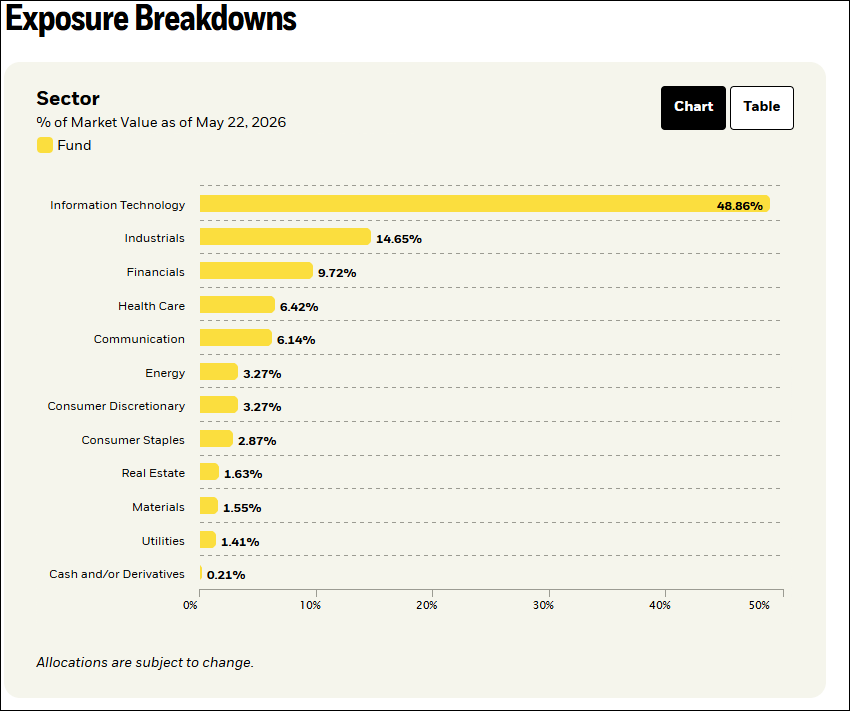
This table presents the holdings by sectors.
There are three tabs: Markets, Charts and Data. The Data tab uses RTD formulas to pull in market data and separate the performance measurements by sectors. Excel IFERROR function is used to displace a blank cell instead of an error.
Column A are the symbols from the web site's Holdings' CSV file.
Column B pulls the percent net change RTD call:
=IFERROR(RTD("cqg.rtd", ,"ContractData",A1, "PerCentNetLastTrade",, "T")/100,"")Column C ranks the net percent last trade data:
=IFERROR(RANK($B1,$B$1:$B$125)+COUNTIF($B$1:B1,B1)-1,"")
Column D pulls over the symbols for the ranking.
Column E is the sector for each company and is found in the web site's Holdings' CSV file.
Column F is ascending numbers from 1:125.
Column G pulls in the symbols for the ranked percent net last trade:
=IFERROR(VLOOKUP(F1,$C$1:$D$125,2,FALSE),"")
Column H pulls in the sector associated with the symbols from Column G:
=VLOOKUP(F1,$C$1:$E$125,3,FALSE)
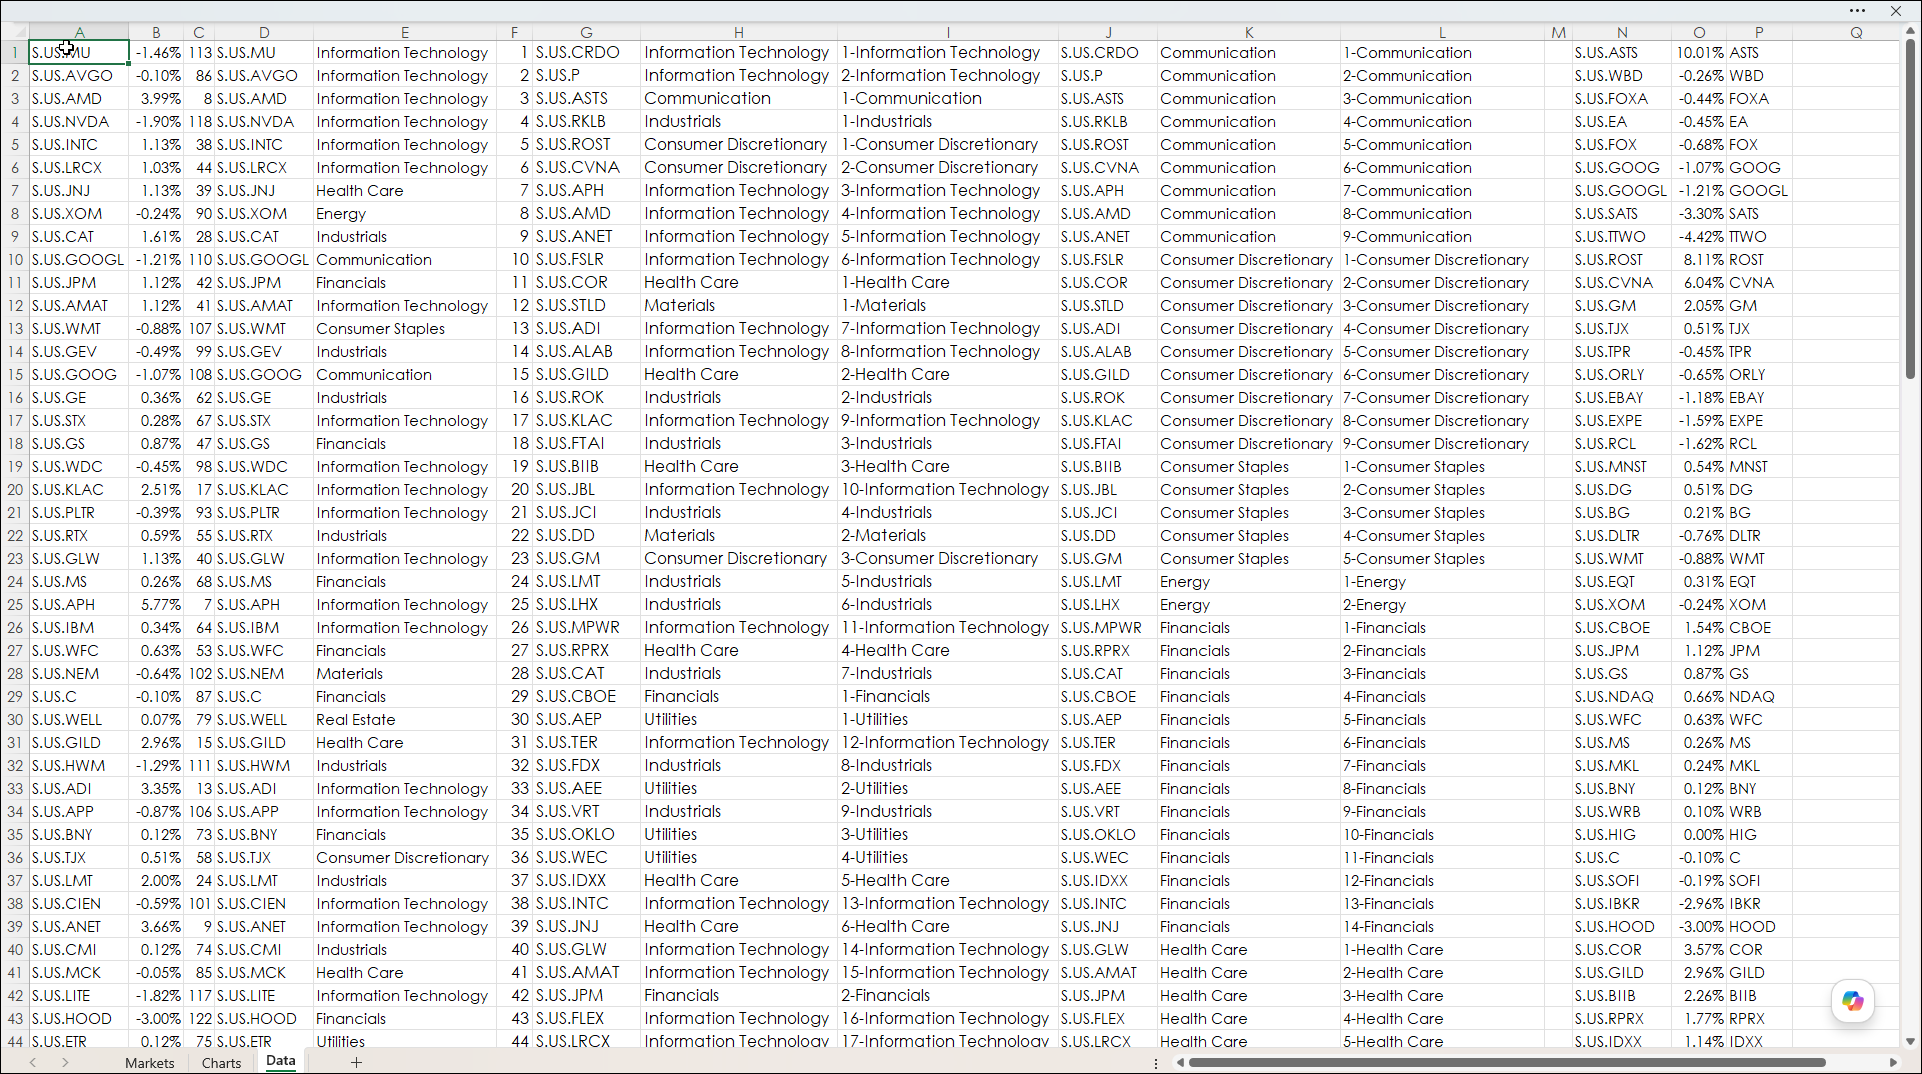
Column I counts the number of occurrences of each sector by the company symbol:
=COUNTIF($H$1:H1,H1)&"-"&H1
Column J pulls in the ranked symbols from Column G:
=G1
Column K pulls in the sectors alphabetically sorted:
=SORT(H1:H125)
Column L counts the number of times the sector is listed:
=COUNTIF($K$1:K1,K1)&"-"&K1
Column N pulls in the ranked symbols for each sector:
=IFERROR(VLOOKUP(L1,$I$1:$K$125,2,FALSE),"")
Column O returns the percent net last trade for each symbol:
=IFERROR(RTD("cqg.rtd", ,"ContractData",N1, "PerCentNetLastTrade",, "T")/100,"")Column P returns the basic root symbol for labeling the individual histogram bars on the chart:
=RIGHT(N1,LEN(N1)-5)
There are two charts on the Charts tab.
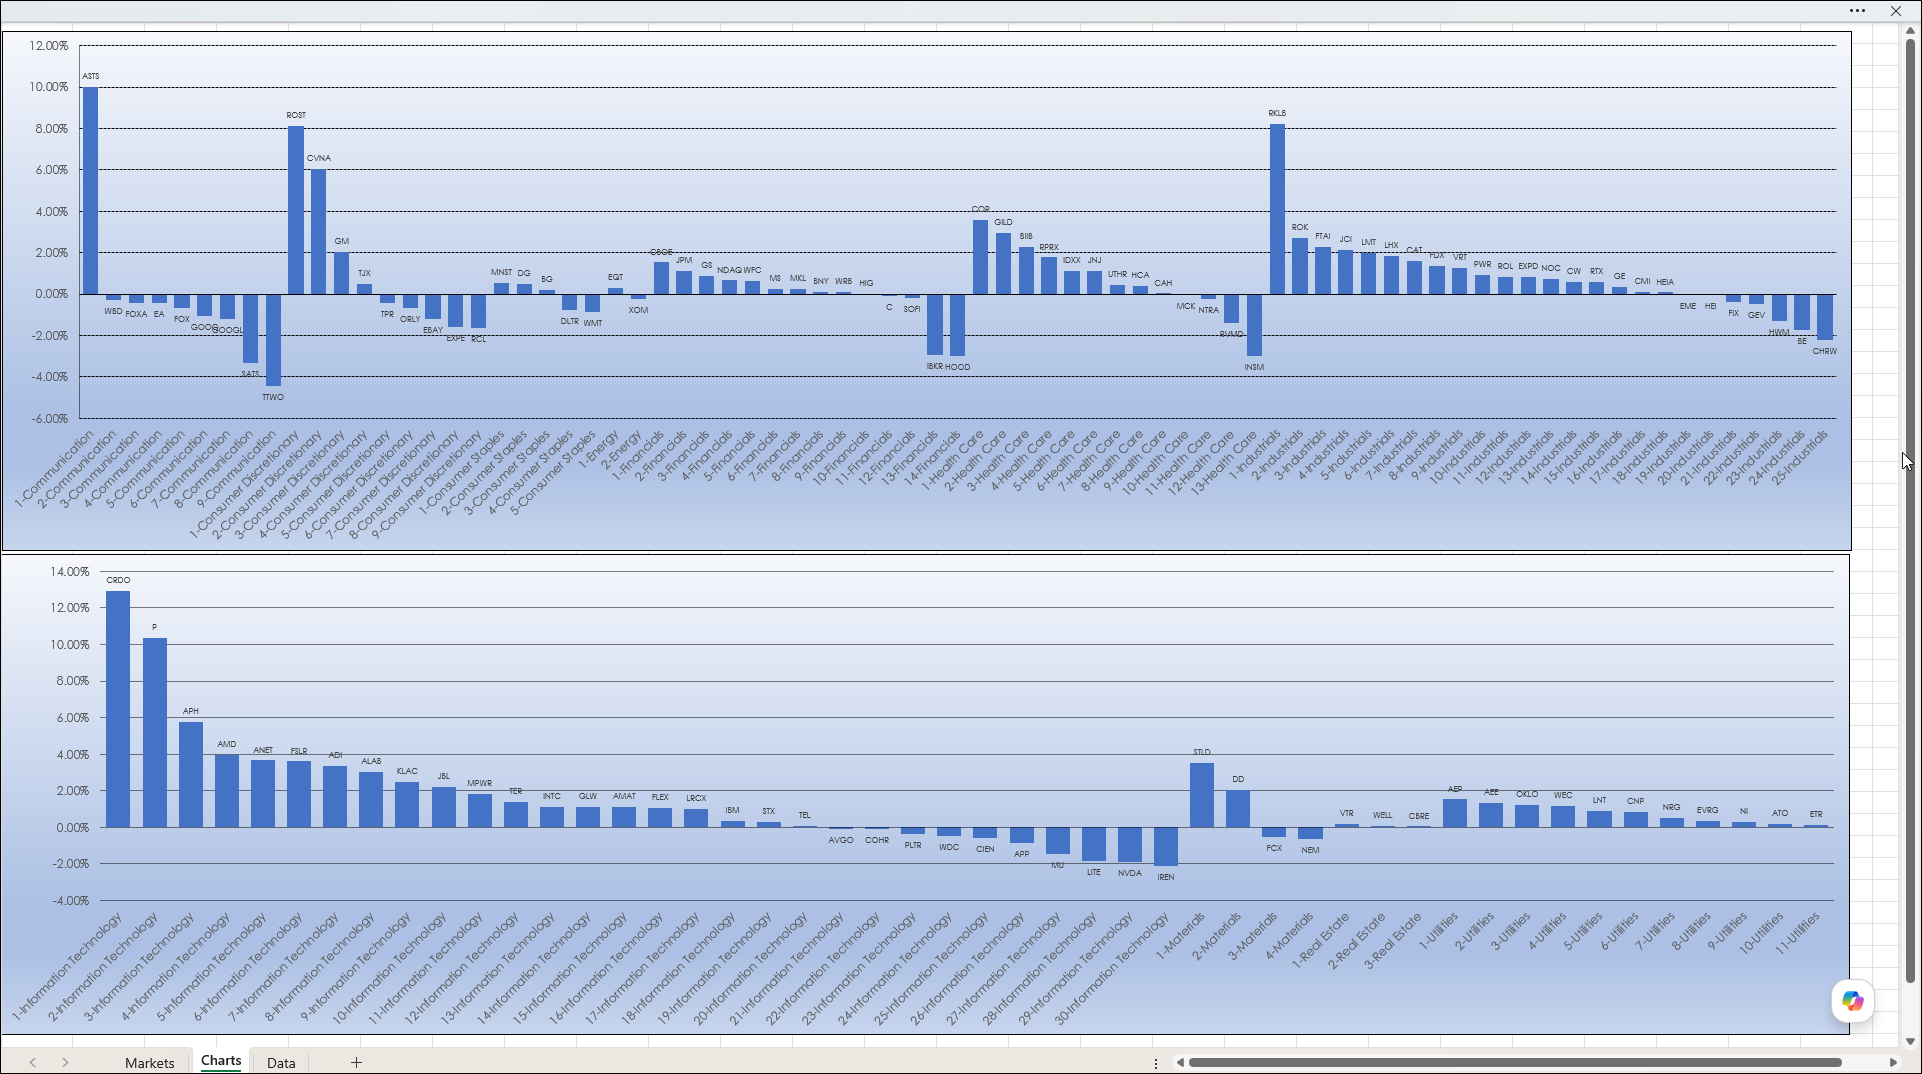
The Charts shows the ranked performance of the stocks by Sectors.
The Market Tab presents each Sector as a block.
The name of the Sector is in the first line of the block.
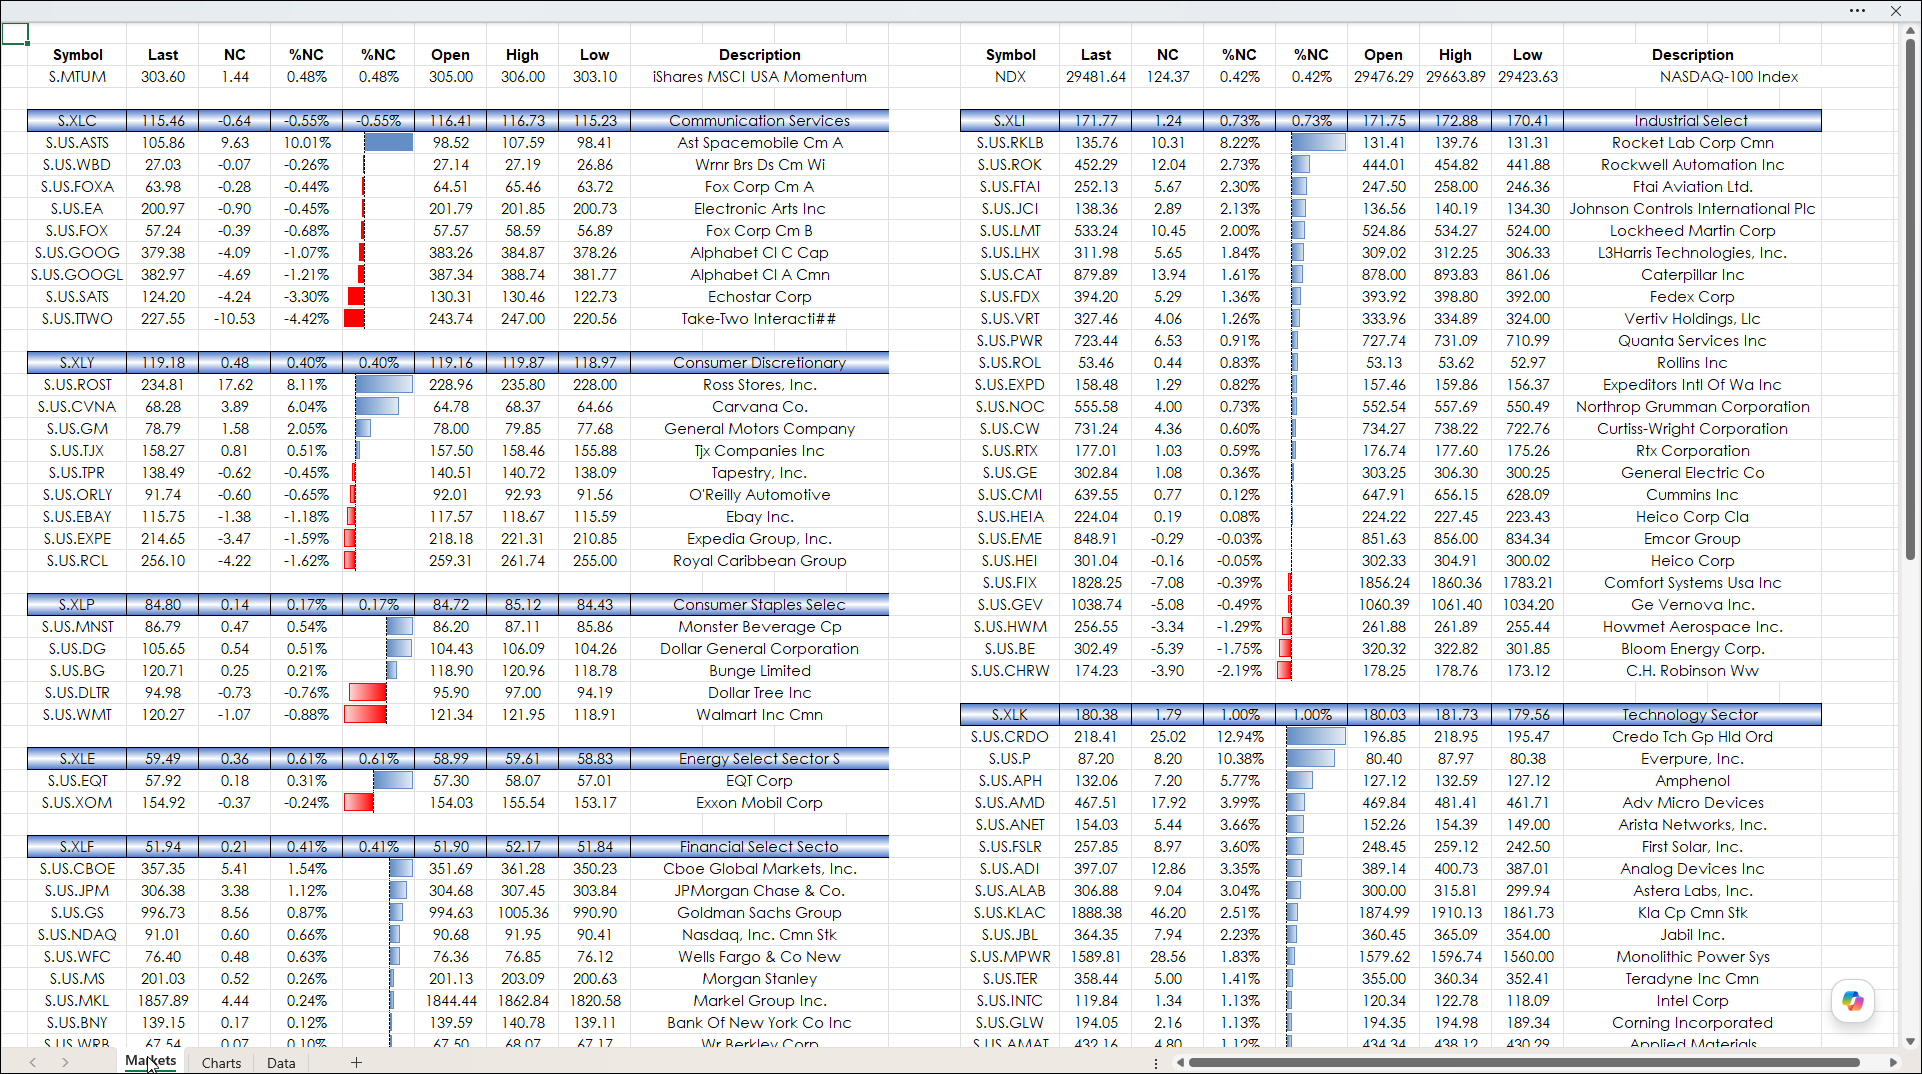
The percent net change columns use the Excel Data bars condition to highlight the highest and lowest performers within the block.
This post detailed using Excel and RTD formulas for real-time analysis of the holdings of the iShares MSCI USA Momentum Factor ETF broken down by sectors.
Requirements: CQG Integrated Client or QTrader, exchange enablements for the NYSE and NASDAQ, and Excel 365 (locally installed, not in the Cloud) or more recent.