This post details the Market Profile Value Areas (MPVA) study, as well as providing a downloadable Excel sample for pulling MPVA study data into a spreadsheet.
When applied to a chart, the study calculates the Market Profile's Value Area and Point of Control (POC).
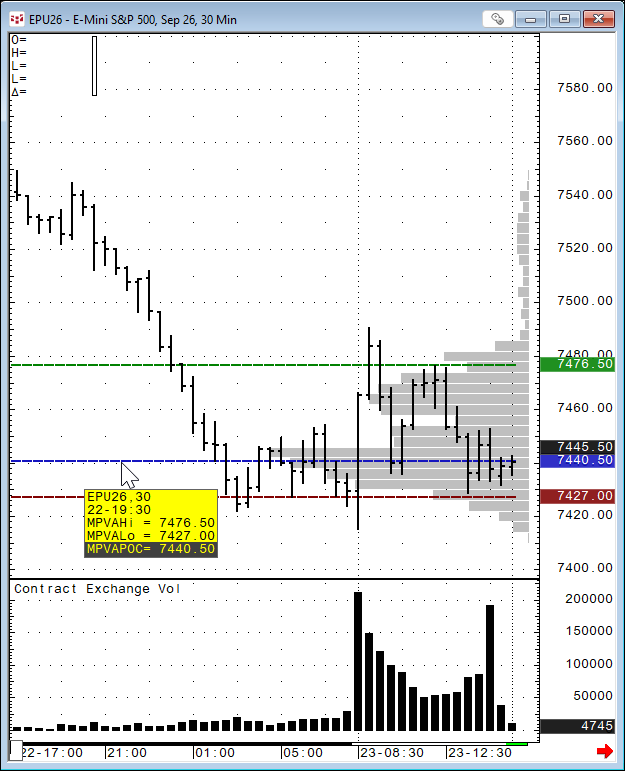
The POC is the price level where the most trading occurred during the session.
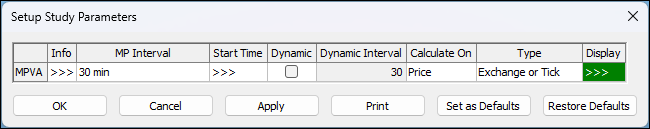
CQG can set the parameters for the study to use the price with the most TPOs (Time Price Opportunities) or the price with the highest volume (Volume Profile version). The study has the following Setup Study Parameters.
The image above shows the volume histograms by price.
For more information regarding TPOs please review the Help file for Market Profile charts.
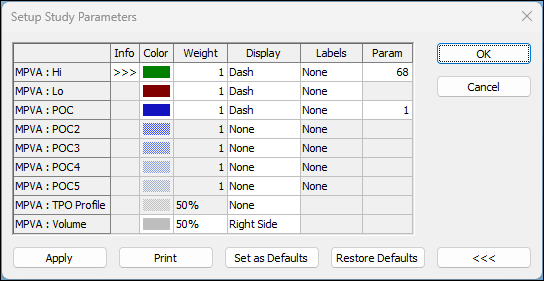
The value area begins calculating at the POC. The system expands the value area one price at a time in either direction until the value area represents 68% of the TPOs, choosing the direction on each iteration on the basis of the number of TPOs the two prices adjacent to the current value area have. It is expanded in the direction of the price having more TPOs.
The high boundary of the value area is represented by a green line, and the low boundary of the value area is represented by a red line. You can change these colors.
The POC is calculated as the price that has the maximum TPO during the specified time period. If several prices have the same max TPO, then the price that is closest to the middle price range is the POC price. The POC is blue by default.
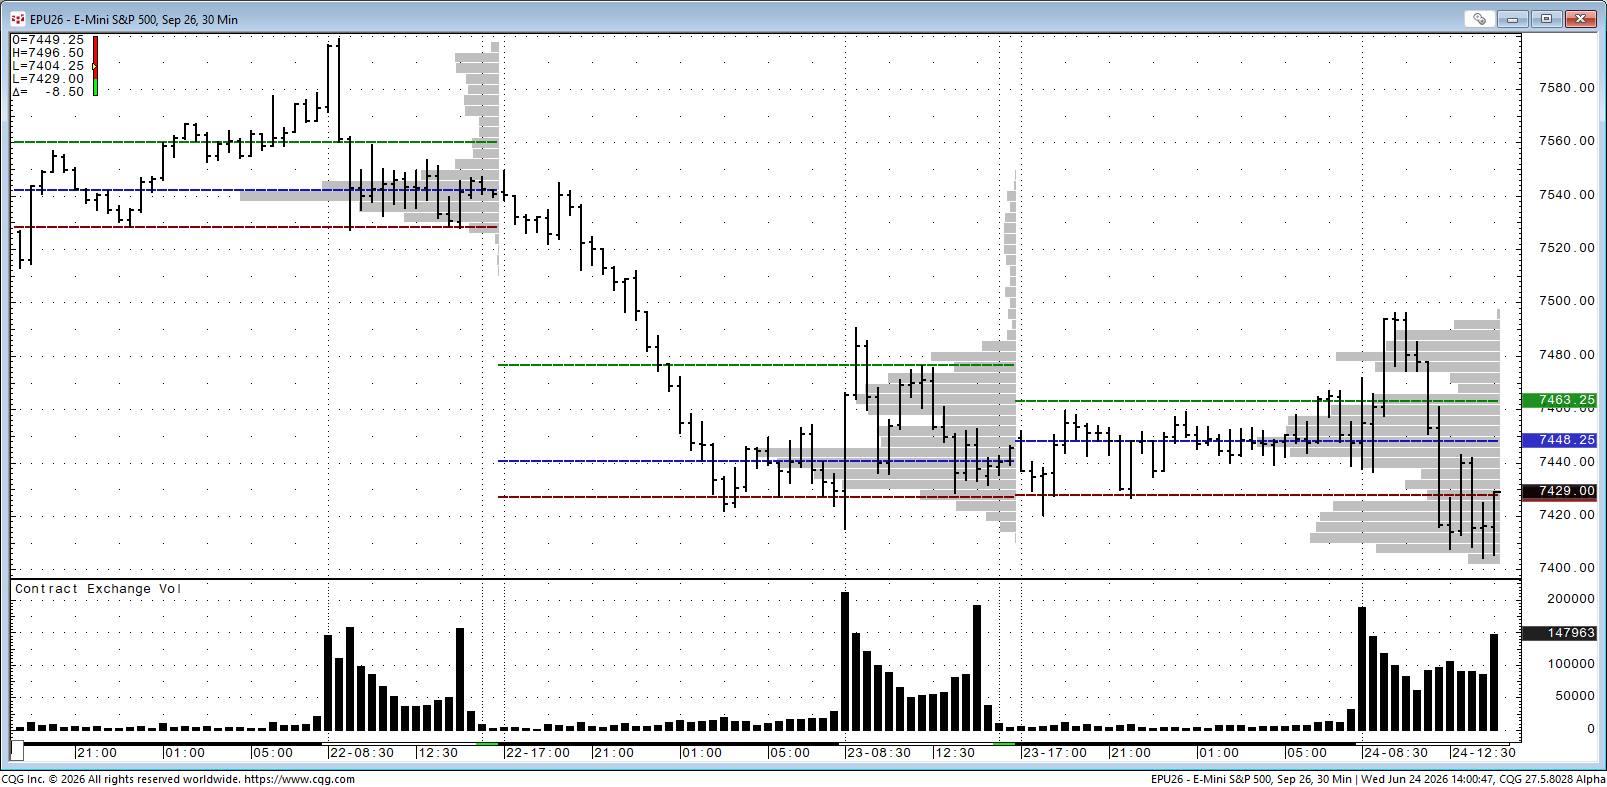
Traders may want to analyze the value area's width to determine trade facilitation. Traders may also want to compare the previous day's value area to the current day. A higher value area may indicate that the market is buying. TPO value areas are available on all contracts.
MPVA in dynamic mode: Dynamic mode allows you to calculate and show MPVA values for a custom-defined time interval on an intraday chart. In this case, any time the interval range is calculated from session start time or day, start time and MPVA study values for every time interval will consider TPO of prices from the day or session start time, so dynamic mode shows how MPVA values are changing within the day or session for every defined time interval.
Market Profile is essentially an auction-market framework. The POC tells you where the auction was most successful, and the Value Area tells you where most participants agreed on value.
The three studies are available as Excel RTD formulas for pulling the data into Excel.
MPVAPOC:
= RTD("cqg.rtd",,"StudyData", "EP", "MPVA", "MPInterval=30,StartTime=0,BeginCondition=none,Lookback=100,BarsBack=100,DaysBack=1,Dynamic=0,DynamicInterval=30,CalculateOn=0,Type=2,VACoverage=68,PocDistance=1,TPOPlacement=0,VolPlacement=0", "MPVAPOC","D","-1","ALL",,,"TRUE","T")MPVAHi:
= RTD("cqg.rtd",,"StudyData", "EP", "MPVA", "MPInterval=30,StartTime=0,BeginCondition=none,Lookback=100,BarsBack=100,DaysBack=1,Dynamic=0,DynamicInterval=30,CalculateOn=0,Type=2,VACoverage=68,PocDistance=1,TPOPlacement=0,VolPlacement=0", "MPVAHi","30",,"ALL",,,"TRUE","T")MPVALo
=RTD("cqg.rtd",,"StudyData", "EP", "MPVA", "MPInterval=30,StartTime=0,BeginCondition=none,Lookback=100,BarsBack=100,DaysBack=1,Dynamic=0,DynamicInterval=30,CalculateOn=0,Type=2,VACoverage=68,PocDistance=1,TPOPlacement=0,VolPlacement=0", "MPVALo","30",,"ALL",,,"TRUE","T")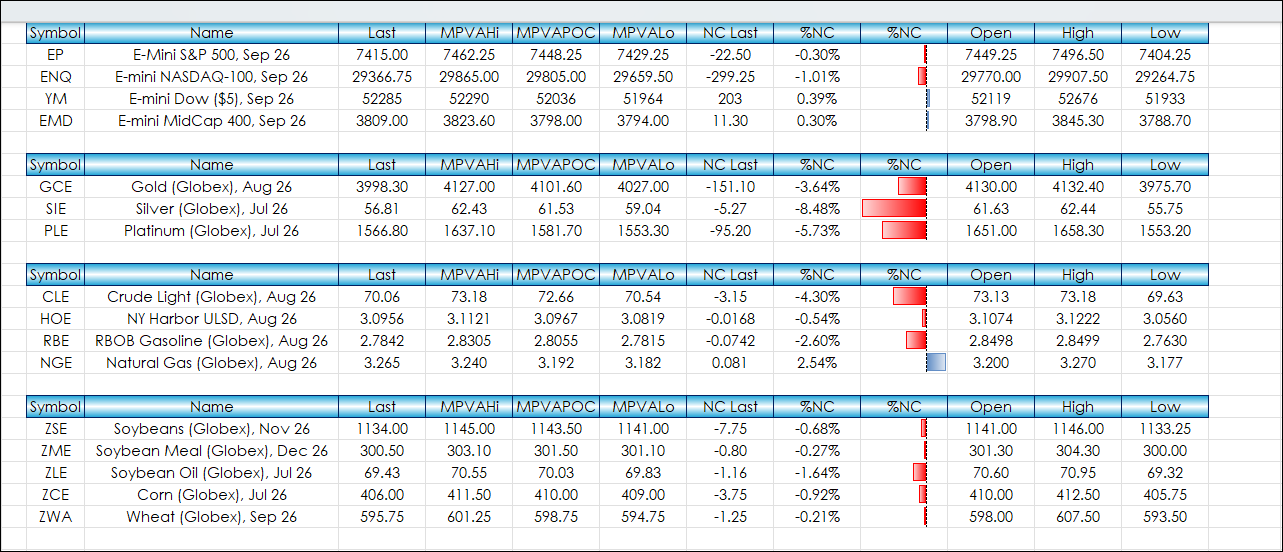
The image above is the Excel downloadable sample.
A general guideline for using this study:
- MPVAPOC = Fair price
- Value Area = Fair value range
- Above MPVAHi = Potentially expensive
- Below MPVALo = Potentially cheap
Requires CQG Integrated Client or CQG QTrader, data enablement for the various exchanges, and Excel 365 or more recent locally installed, not in the Cloud.