
This post offers a downloadable Excel Dashboard that details the current session's market performance of the constituents of the two averages.
The top block of the dashboard is the Dow Jones Transportation Average, (DJTA), ticker symbol DJT. It is a U.S. stock market index from the S&P Dow Jones Indices. The average tracks the transportation sector. It is the oldest stock index still in use, first published in 1896, being in use longer than its better-known relative, the Dow Jones Industrial Average. (Symbol: DJI).
The index is a running average of the stock prices of twenty transportation corporations, with each stock's price weighted to adjust for stock splits and other factors.
Changes in the index's composition are rare and generally occur only after corporate acquisitions or other dramatic shifts in a component's core business.
As of June 1, 2026, the index consists of the following 20 companies:
| Company | Ticker | Transport Sector |
|---|---|---|
| Alaska Air Group | S.ALK | Airline |
| Avis Budget Group | S.CAR | Rental and Leasing Service |
| C.H. Robinson | S.CHRW | Trucking |
| CSX Corporation | S.CSX | Railroads and Real Estate |
| Delta Air Lines | S.DAL | Airline |
| Expeditors International | S.EXPD | Logistics and Freight |
| FedEx | S.FDX | Delivery Service |
| FedEx Freight | S.FDXF | Freight Services |
| J.B. Hunt | S.JBHT | Transportation and Logistics |
| Kirby Corporation | S.KEX | Marine Transportation |
| Landstar System | S.LSTR | Transportation |
| Matson, Inc. | S.MATX | Marine Transportation |
| Norfolk Southern Corporation | S.NSC | Railroads |
| Old Dominion Freight Line | S.ODFL | Trucking |
| Ryder | S.R | Transportation and Logistics |
| Southwest Airlines | S.LUV | Airline |
| Uber | S.UBER | Transport |
| Union Pacific Corporation | S.UNP | Railroads |
| United Airlines Holdings | S.UAL | Airline |
| United Parcel Service | S.UPS | Delivery Service |
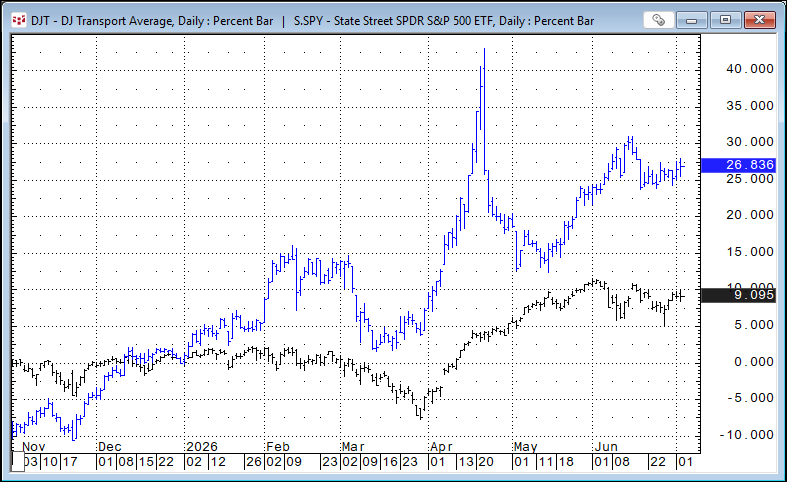
The chart below displays the current percentage net change from December 31, 2025. The DJT (blue bars) has outperformed the SPY ETF.
The Dow Jones Utility Average, ticker symbol: DJU. It is a stock index from S&P Dow Jones Indices that tracks the performance of 15 prominent utility companies traded in the United States.
The Dow Jones Utilities is a price-weighted average first published on January 2, 1929. All components of the DJUA are listed on the New York Stock Exchange, with the exception of American Electric Power, Exelon, and Xcel Energy, which are listed on Nasdaq.
| Company | Ticker | Utilities Type |
|---|---|---|
| American Electric Power | S.AEP | Electric Utilities |
| American Water Works | S.AWK | Water Utilities |
| Atmos Energy | S.ATO | Gas Utilities |
| Consolidated Edison | S.ED | Electric Utilities |
| Dominion Energy | S.D | Electric Utilities |
| Duke Energy | S.DUK | Electric Utilities |
| Edison International | S.EIX | Electric Utilities |
| Exelon | S.EXC | Diversified Utilities |
| FirstEnergy | S.FE | Electric Utilities |
| NextEra Energy | S.NEE | Electric Utilities |
| Public Service Enterprise Group | S.PEG | Diversified Utilities |
| Sempra | S.SRE | Multi-Utilities |
| Southern Company | S.SO | Electric Utilities |
| Vistra Corp. | S.VST | Independent Power Producer |
| Xcel Energy | S.XEL | Electric Utilities |
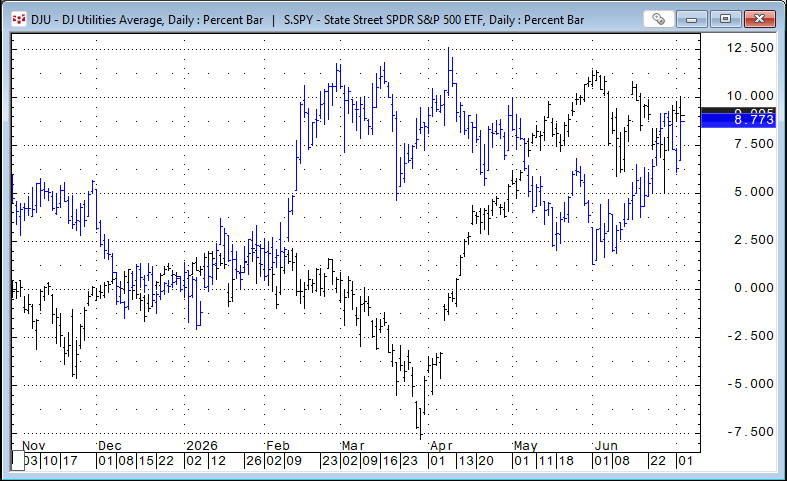
The chart displays the current percentage net change from December 31, 2025. The DJU (blue bars) has at this date nearly matched the SPY ETF.
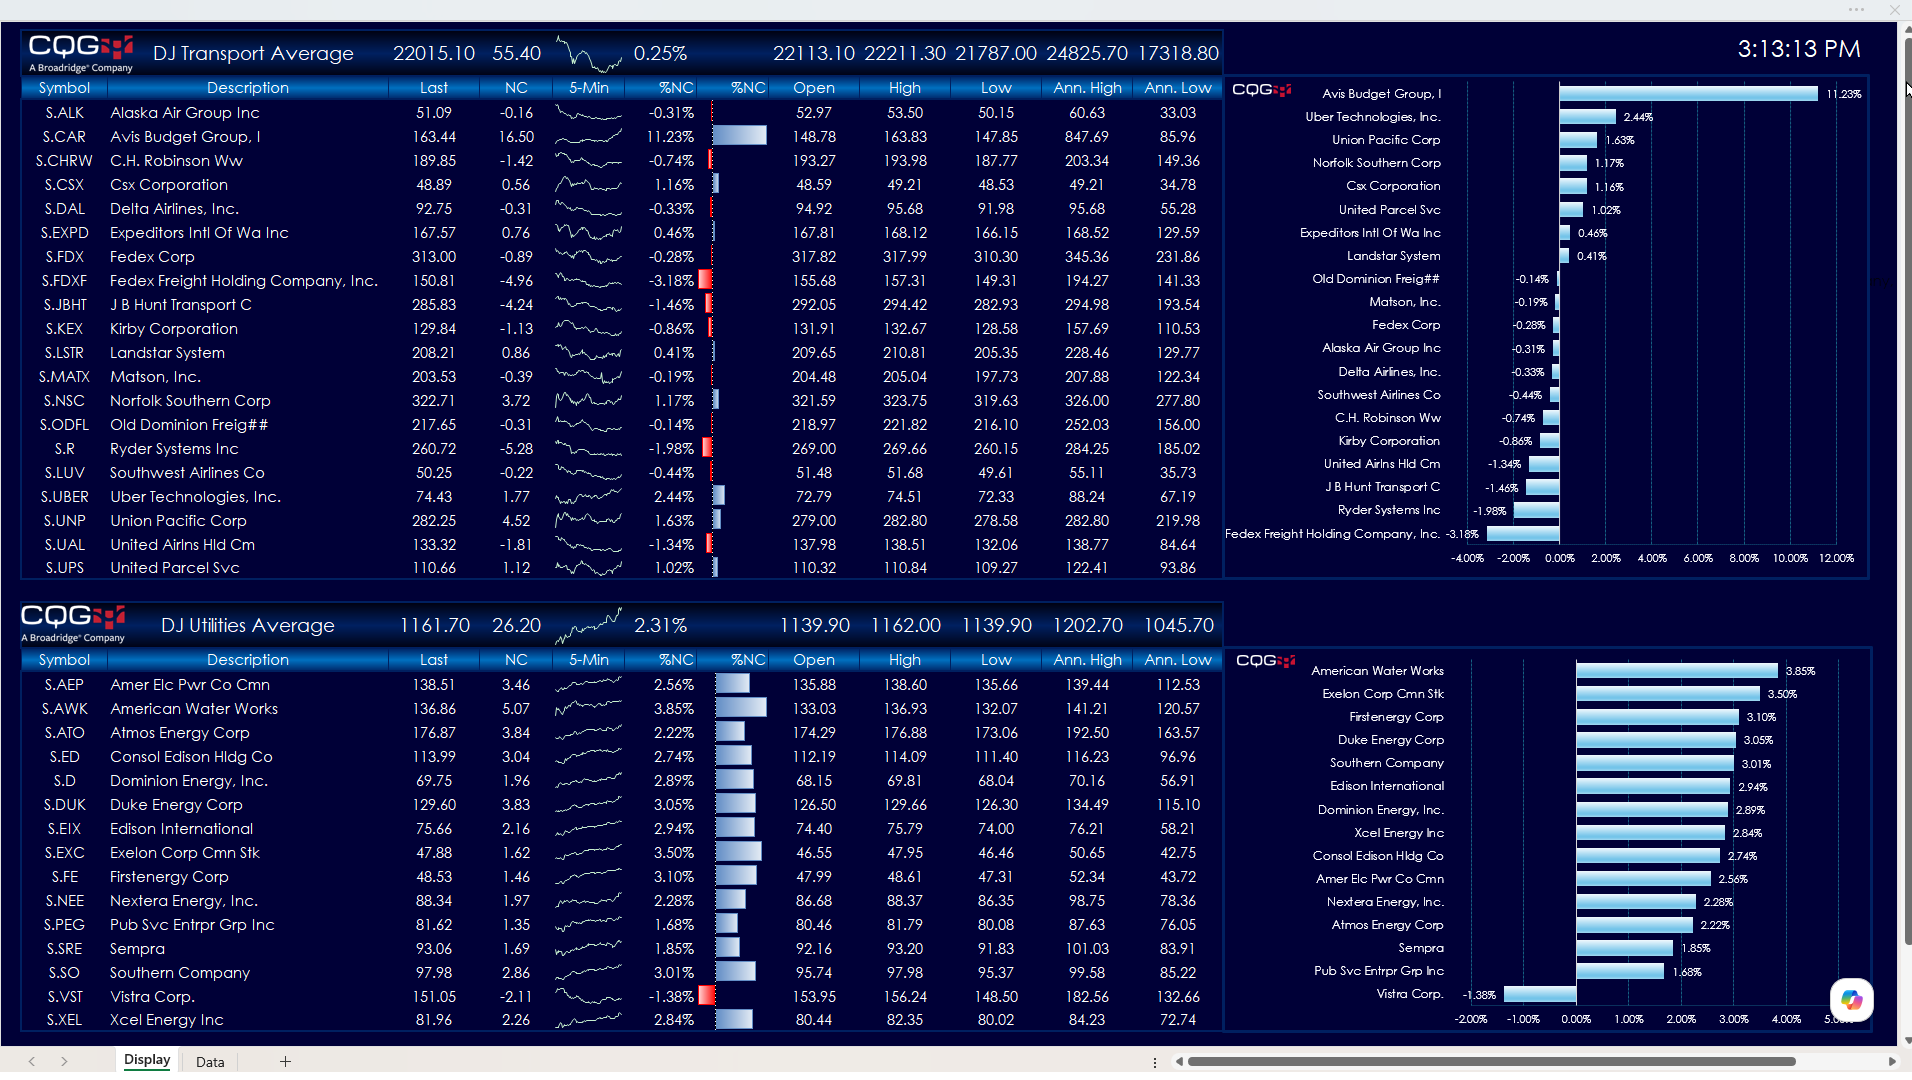
The Excel dashboard has two blocks: The Dow Jones Transportation group and the Dow Jones Utilities group. The dashboard displays standard market data including the Last Trade, Net Change of the Last Trade, a 5-minute sparkline chart of the current session's price action, the Percent Net Change, Open, High, Low and the high and low for the year.
The histogram charts are the ranked and sorted percentage net change for today's session for each group.
Make sure to lower your Excel RealTimeData (RTD) throttle to 100 milliseconds or lower. Learn how to do that here.
Requires CQG Integrated Client, data enablements for the NYSE and NASDAQ and Excel 365 locally installed, not in the Cloud.