
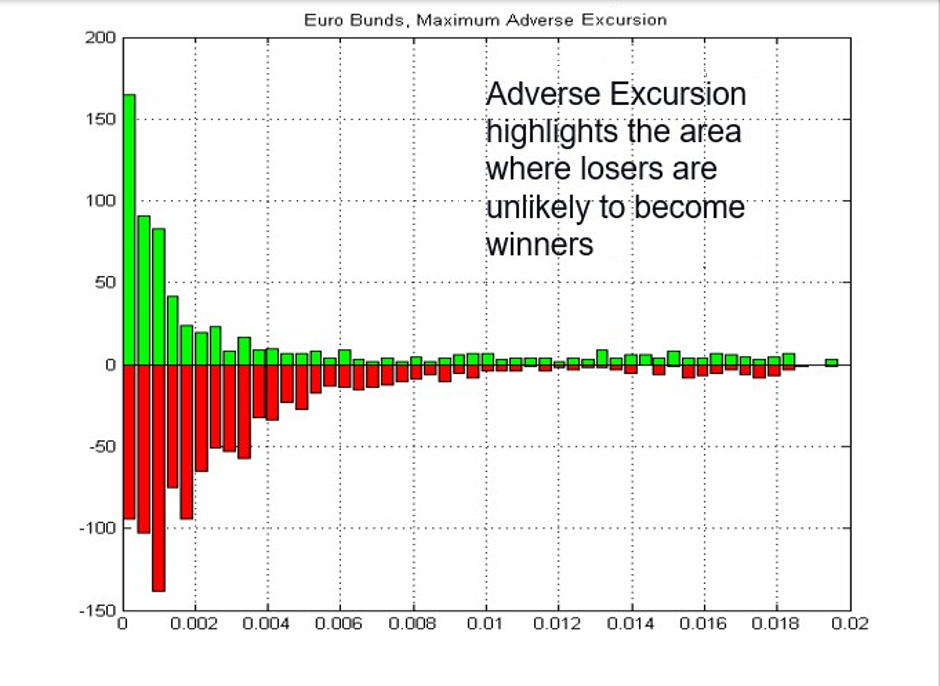
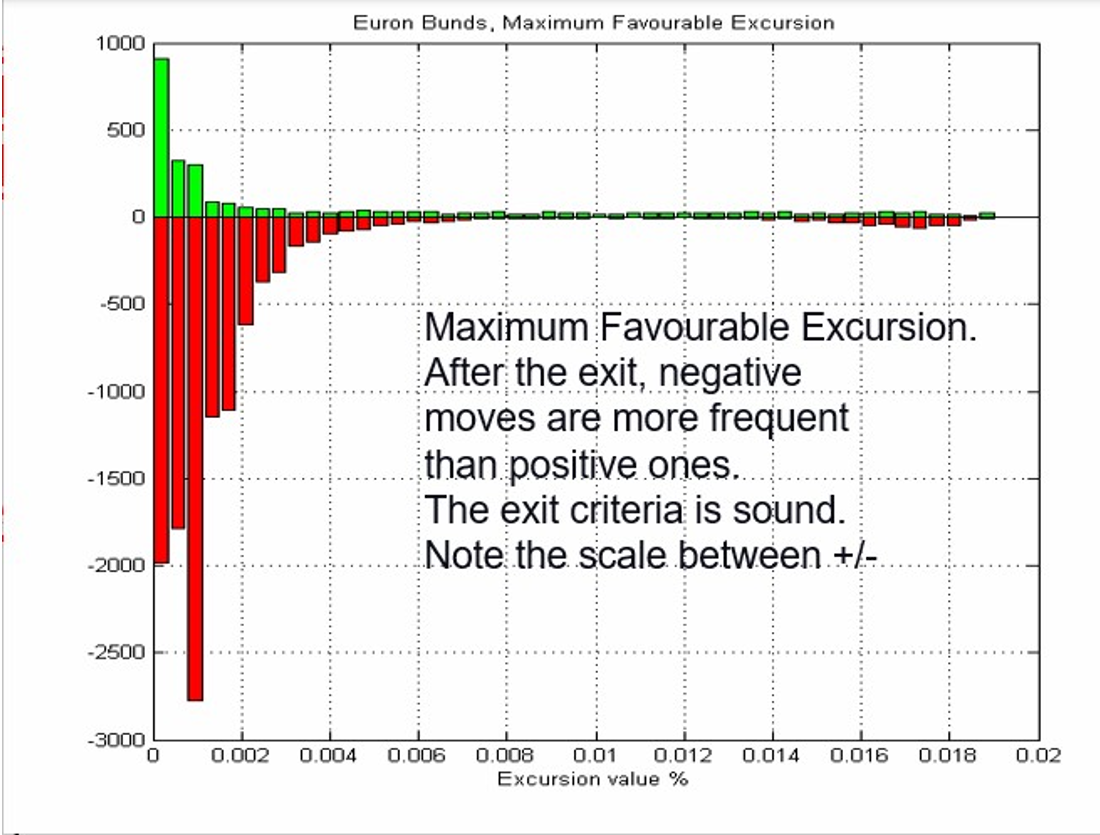
Maximum Adverse Excursion by John Sweeney is one of the few technical books that I've got something from, and I would thoroughly recommend it. Adverse excursion computes both optimum stop information and qualifies the accuracy of exits in relationship to what happened subsequent to that. They are referred to as Maximum Adverse Excursion and Maximum Favourable Excursion. The former is key in understanding at what point a trade is unlikely to from being a loser to a winner. The latter can qualify whether we are taking correct profits close to when the trade profitability will decline if the trade remains live.
The chart below shows that once the loss goes beyond 0.4 it is unlikely to turn around.
This next shows that the exits are solid and capture most of the move.
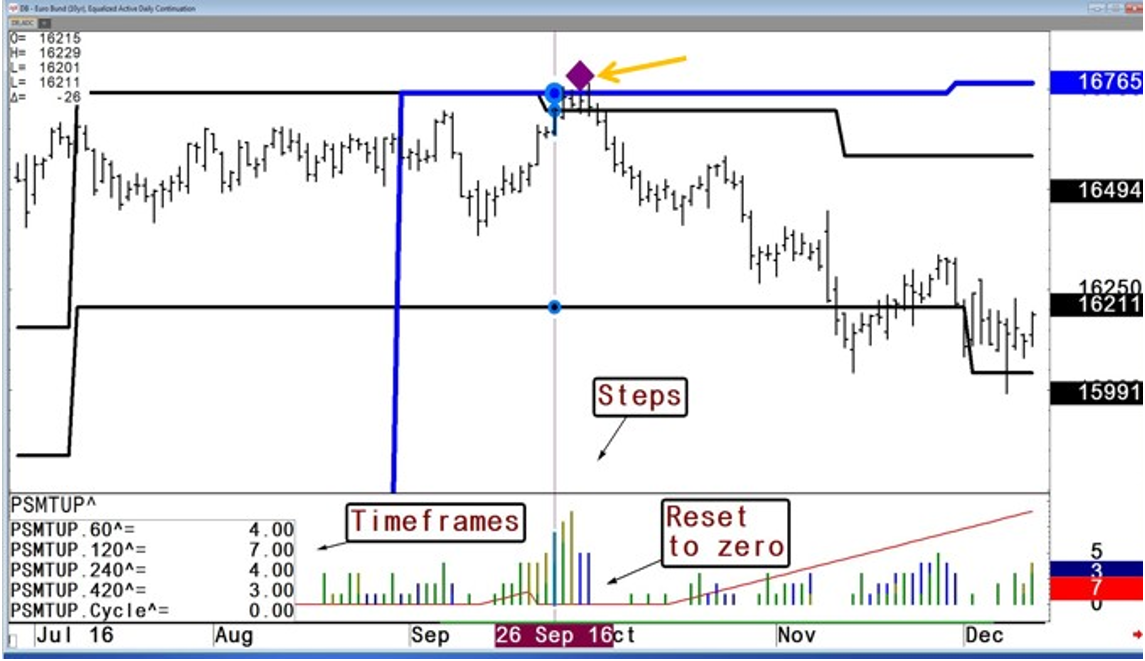
Whilst this is very useful information, the test is stuck in one timeframe. We know how long trends to typically last before at least a corrective phase, but few people attempt to try and move the timeframe horizon up and extend the trade, especially on an intraday basis. This means that exits are activated when a bigger trend maybe in creation. Step theory qualifies the timeframe that is trending. No trend can last within its own timeframe forever so the Steps must move up through in time in order to maintain the trend. If the Step reaches 4 that is the trending timeframe and if goes to 6 or above and resets to zero that timeframe trend is over.
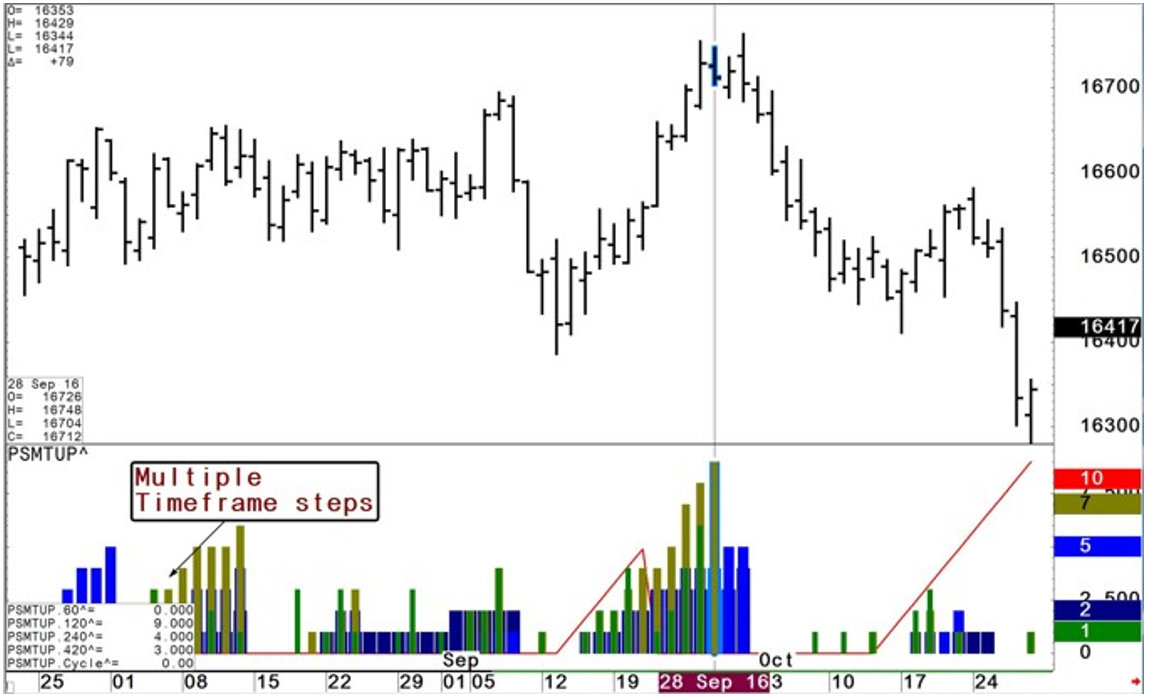
Resets can be programmed as code and alerts to save screen real estate, and any reset is actionable at support or resistance.
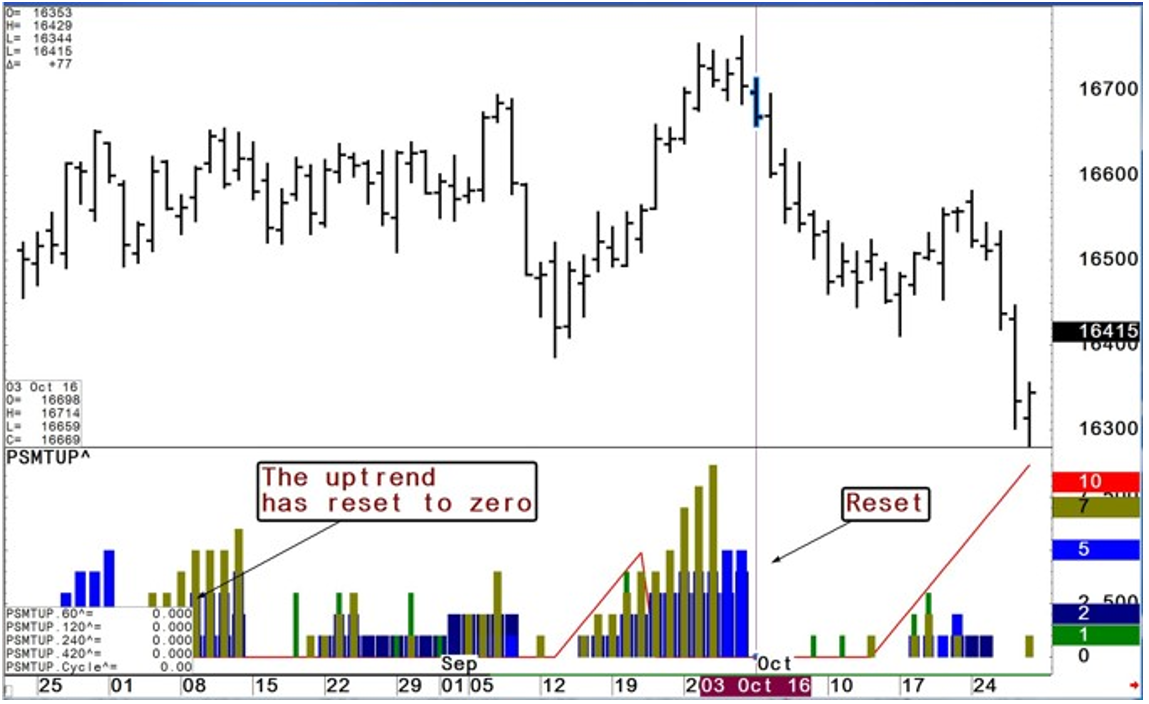
The next chart of multiple timeframe analysis shows that all Steps up to the 420-minute have reset, meaning the uptrend is over and visualized on the daily continuation chart, which has entered the very powerful weekly and monthly zone of resistance. The reset is marked by the creation of a condition in the form of a diamond.
A more detailed explanation is in a previous article.
Range Deviation Pivots have properties for use as a pyramid point for trend following systems. Pyramid points are based on intraday moves against the higher timeframe dominant trend and can be linked to Step theory. The Pivots are calculated on the Opening and therefore provide a fixed reference point for the placement of limit orders. Most pyramiding is placed based on the close but if the trend is down a weak close is far more probable. If the trend continues it will still be profitable but at the expense of stability and risk. Trading the short-term counter trend increases profitability but stability and therefore risk is largely unaffected. This makes a huge difference.
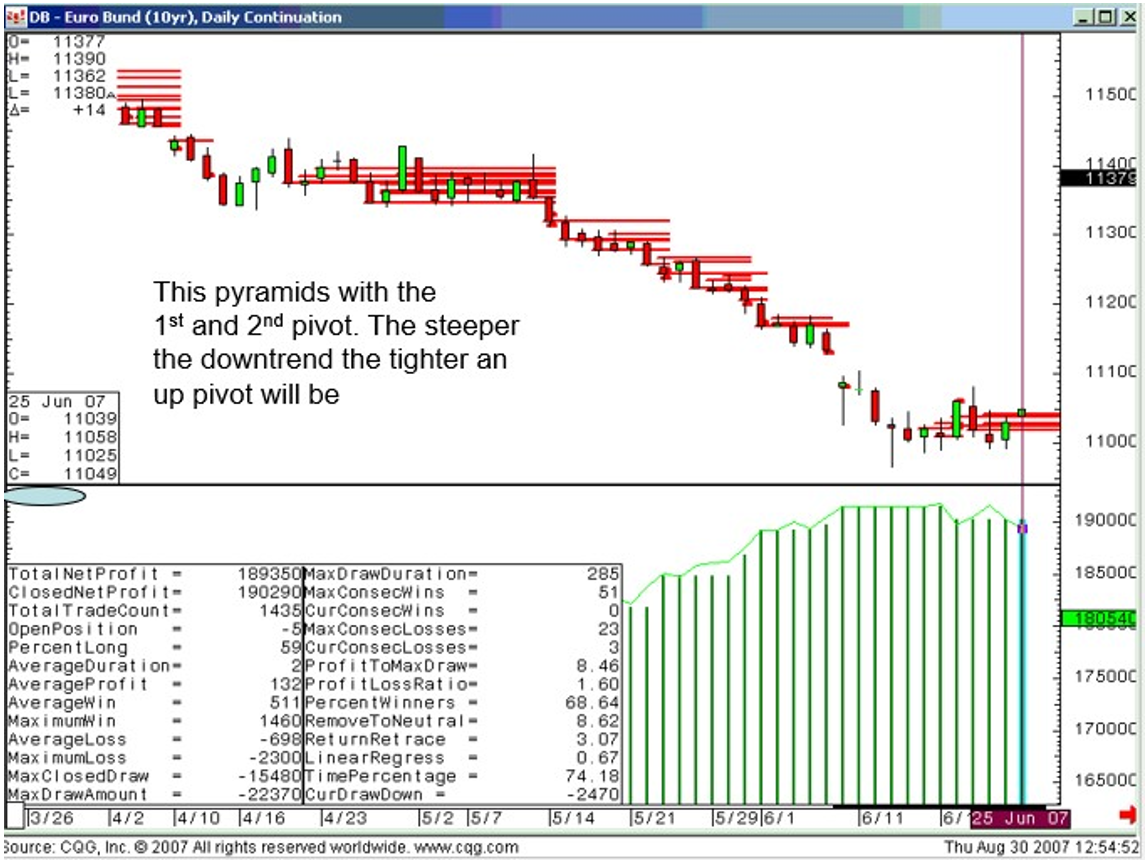
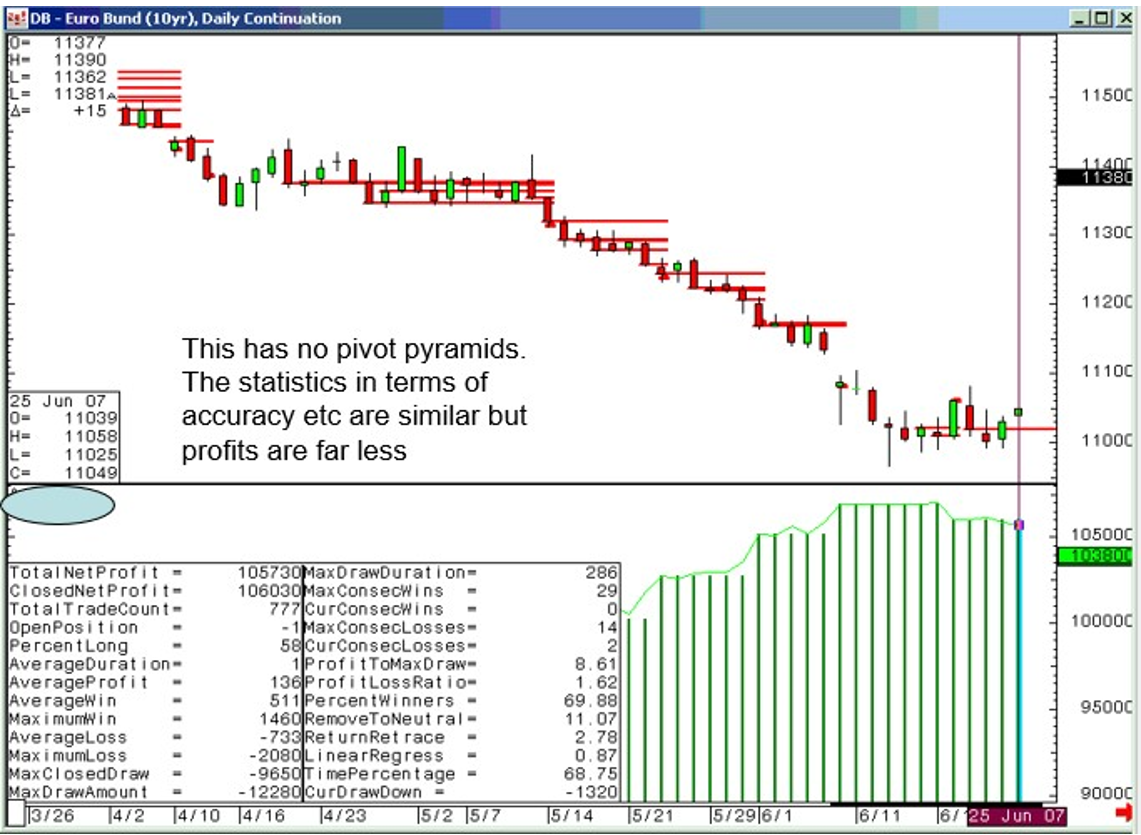
A more detailed explanation and users can be found here.
Optimization
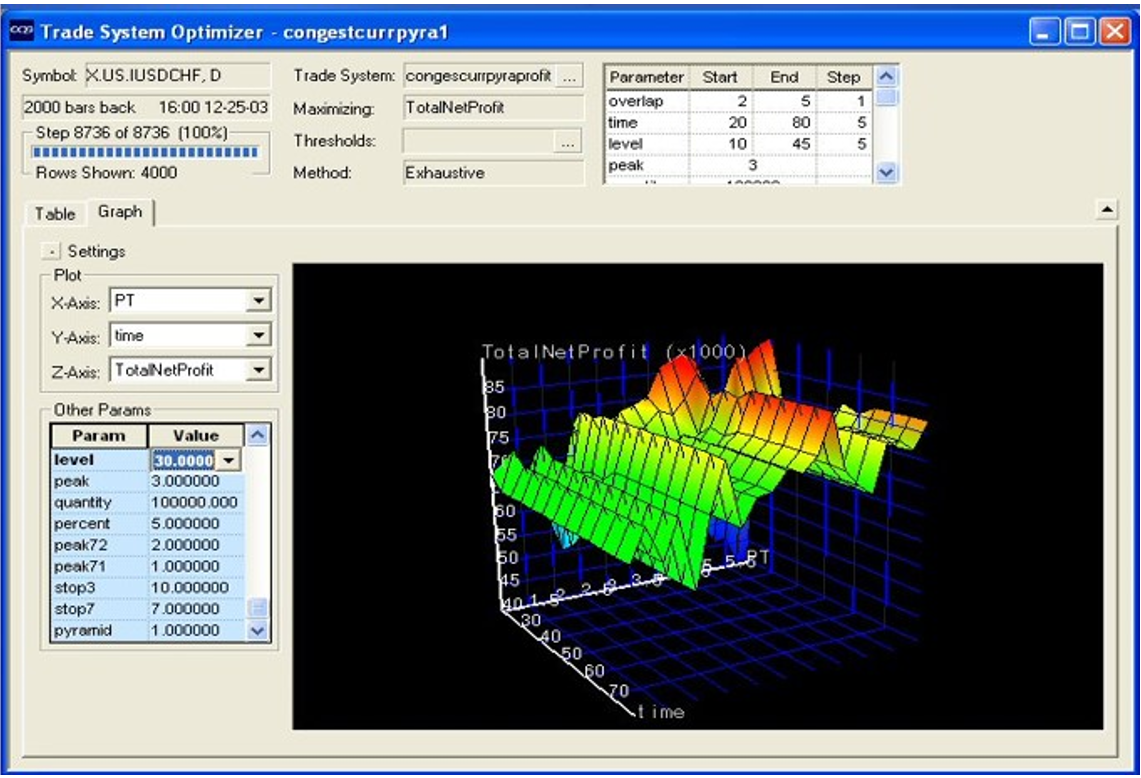
Regardless of the rights or wrongs of optimization it is essential that tests are done as this explains system robustness, and if done correctly enables an understanding or each variables influence. Within the Back testing enablement is the Trade System Optimizer (TSO).
There are various different tests that need to be actioned. All systems reference a certain action point for the trade to begin so it is important to run a test that checks that changing the action point does not make a huge difference. If it does then you inadvertently have found the perfect spot. However, the perfect spot in history is unlikely to be so in the future.
The second test takes just two of the variables and the entry point and then you sequentially add each new variable until all the variables have been added. Subsequently the entire process is repeated on an out of sample basis, followed by buys and sells separately. This does take time, but you will be intimate in your understanding of what the system is actually doing. The TSO provides a 3d Graphic which shows how robust the system is, and you can also use on the statistics themselves. Consider optimizing consecutive losses.
A Stable System
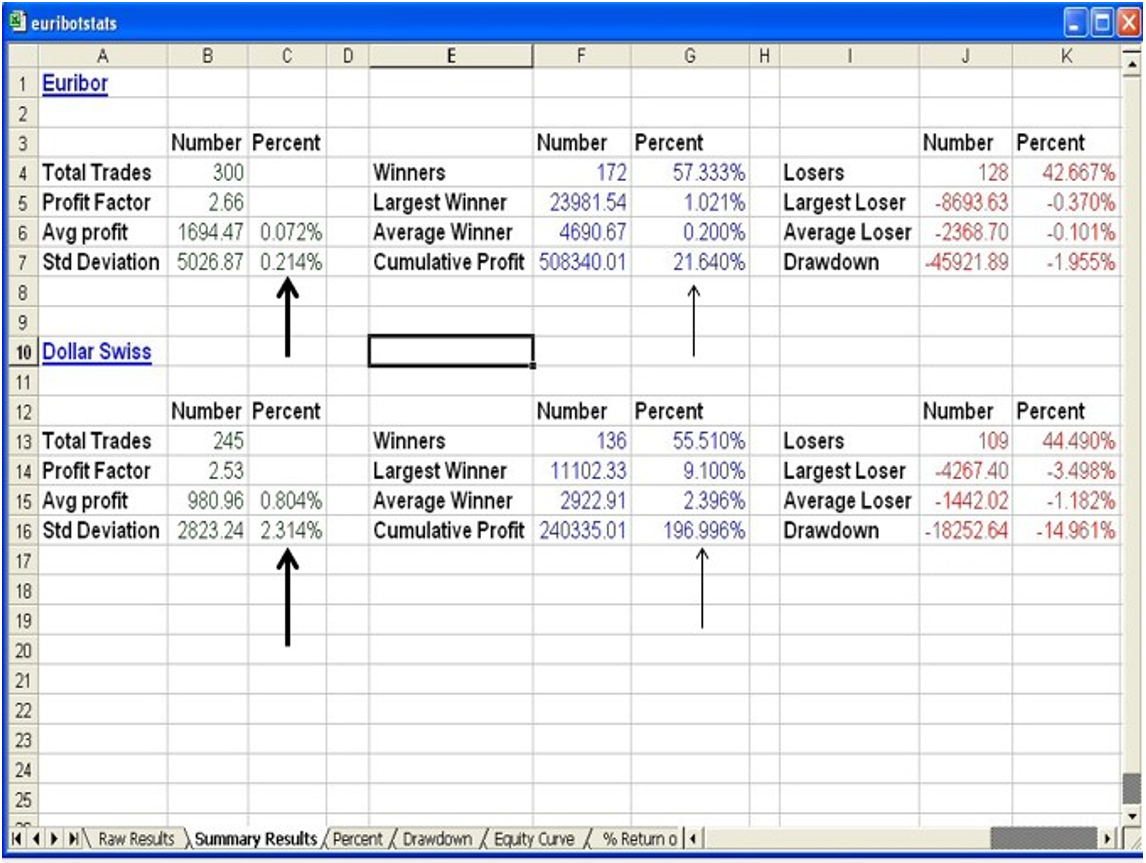
Standard Deviation of risk is one of the most important statistics in terms of a system being something you will stick with in the future, providing the correct exit inputs allow for an accurate assessment which are:
Stop Loss, Profit Target, Time Exit
This creates a fixed framework, the lower the number the better. It tells you that you are taking repetitive patterns consistently. The higher the deviation is, the higher the profits should be, but at the cost of sacrificing stability. The chart below has the same system on Euribor and the Dollar Swiss. Whilst the profit on the latter is 196% the Standard Deviation of Risk is at 2.3%. Anything above 2% means you are in for a wild ride. In contrast, Euribor makes 21% but the Standard Deviation of Risk is extremely low at 0.21%.
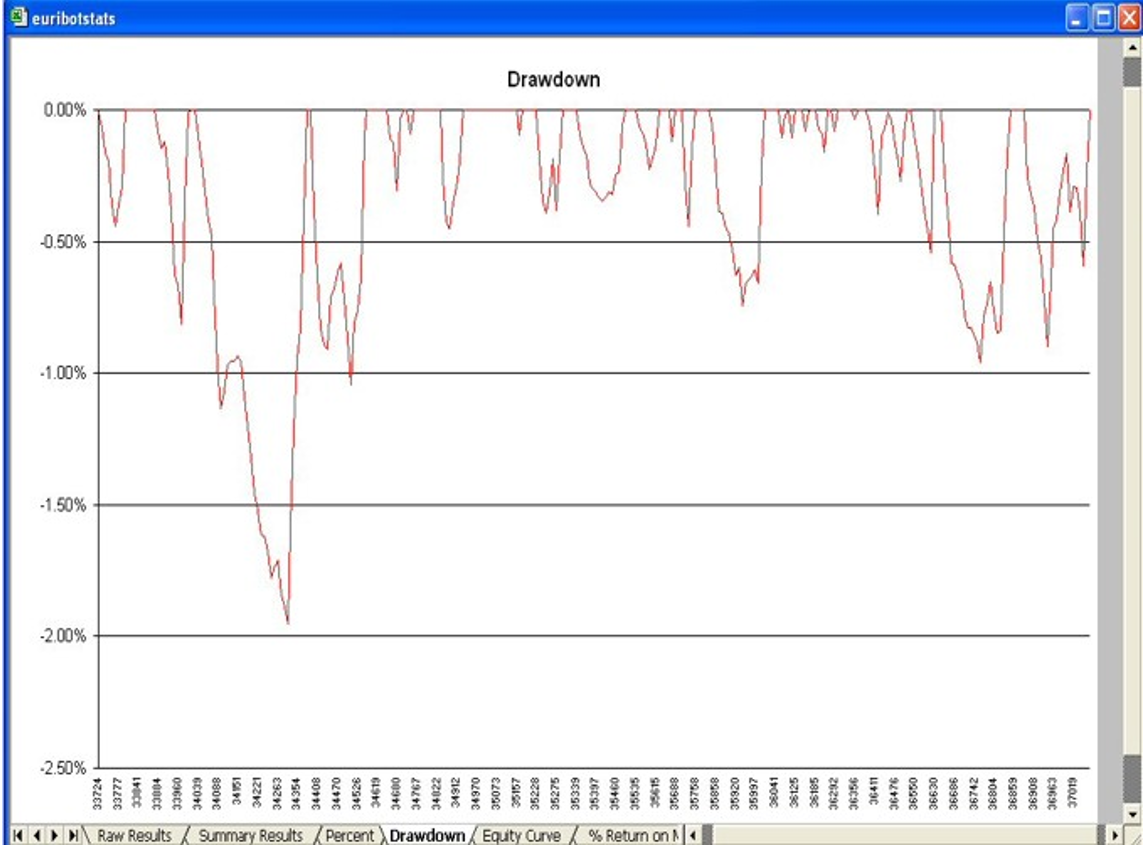
Drilling down further reveals that in fact the worst drawdown was a spike to 2% whilst for the vast majority it remained below 1 %.
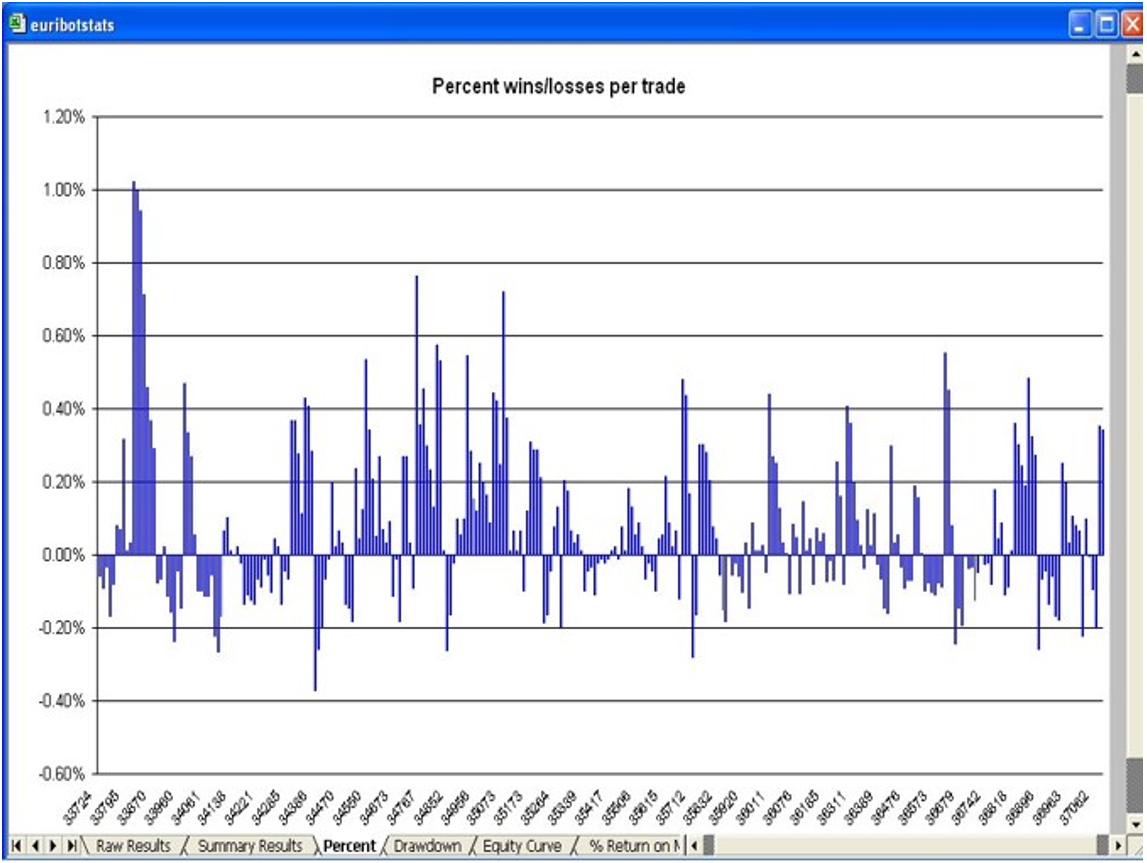
Generally winners are consistently higher in percentage terms than losses.
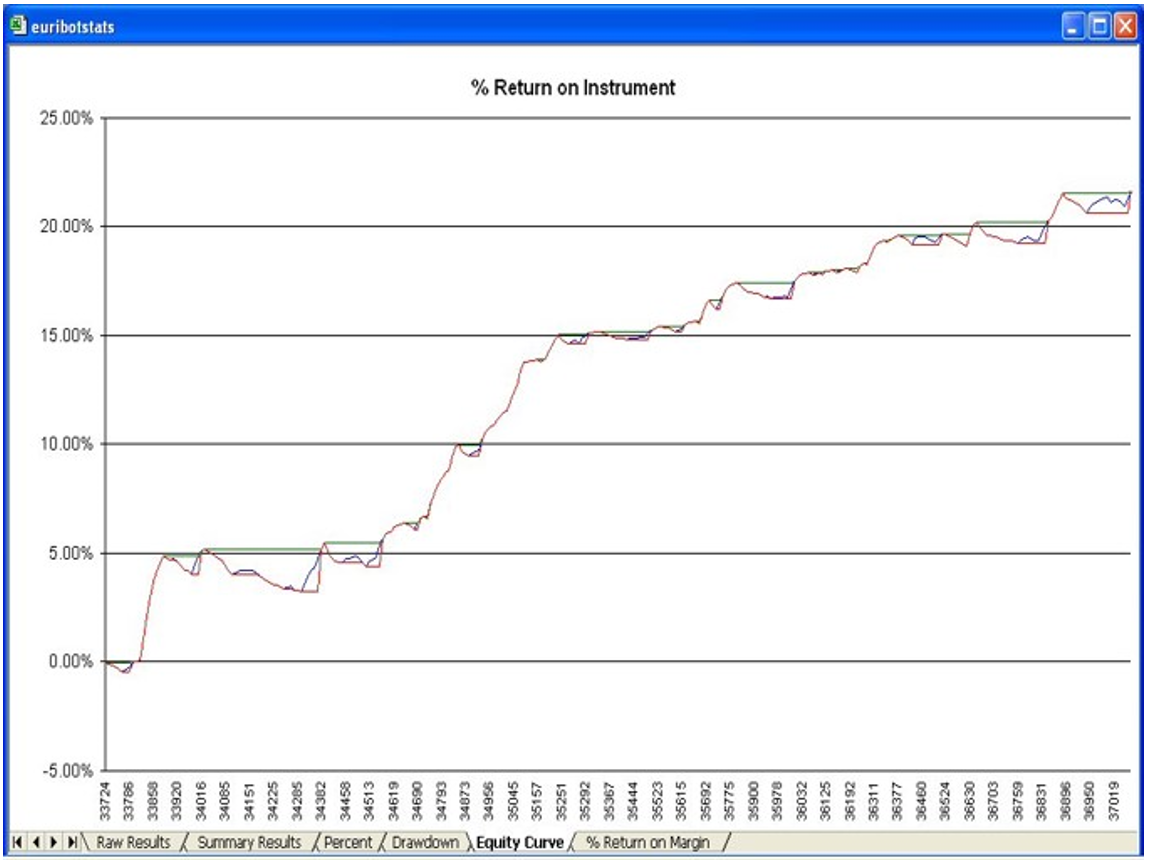
The return is also encouraging as its worst performance was at the beginning of the test period.
Which brings me some Core Philosophies:
- The Chart Tells You, You Don't Tell the Chart
- The Market Comes to You, You Don't Go To Market
- Without Structure and Consistent Application You Cannot Trade
- It Doesn't Matter What the Name is at the Top of the Screen
- It's About Looking For Opportunity
- CQG Has Alert Menus. USE THEM
- Technical Analysis is a Support Structure For Good Traders...
- ...And an Excuse For Poor Ones
