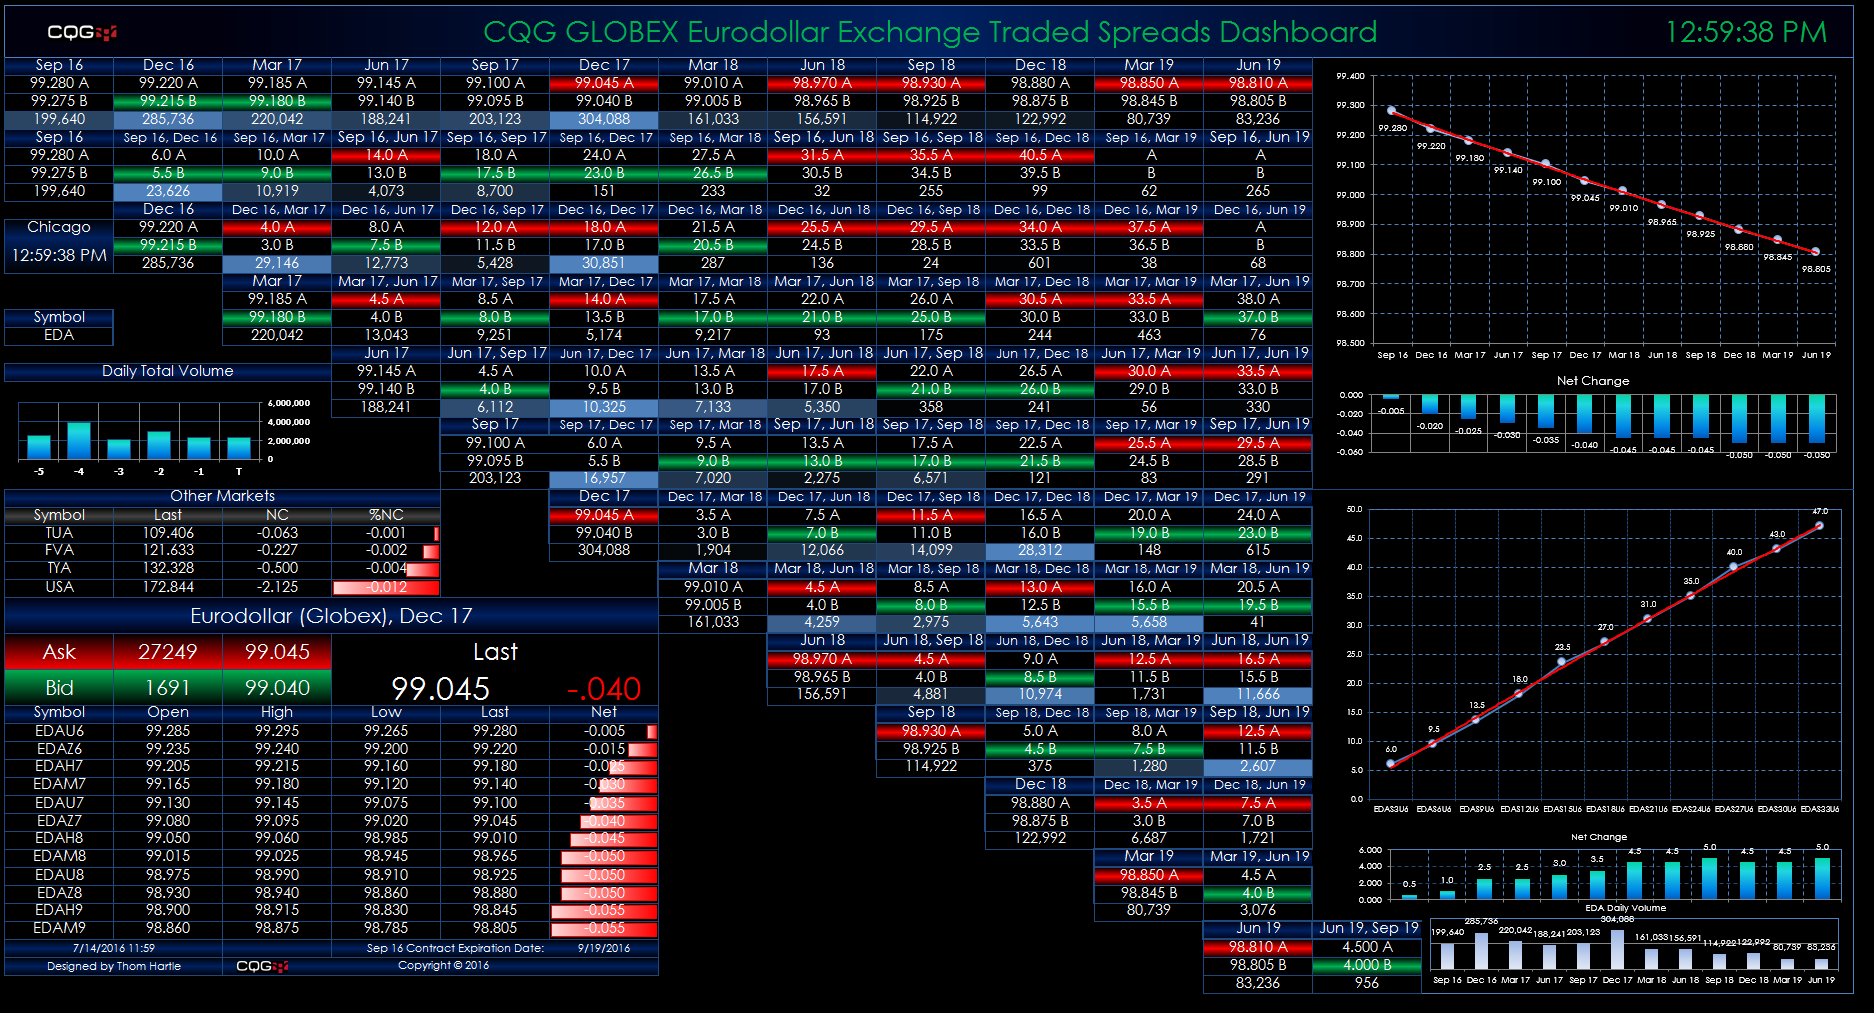
This Microsoft Excel® dashboard displays market data for Eurodollar calendar spreads traded on the CME Globex platform. This monitor uses a matrix-style format. The outrights are displayed along… more
Excel/RTD
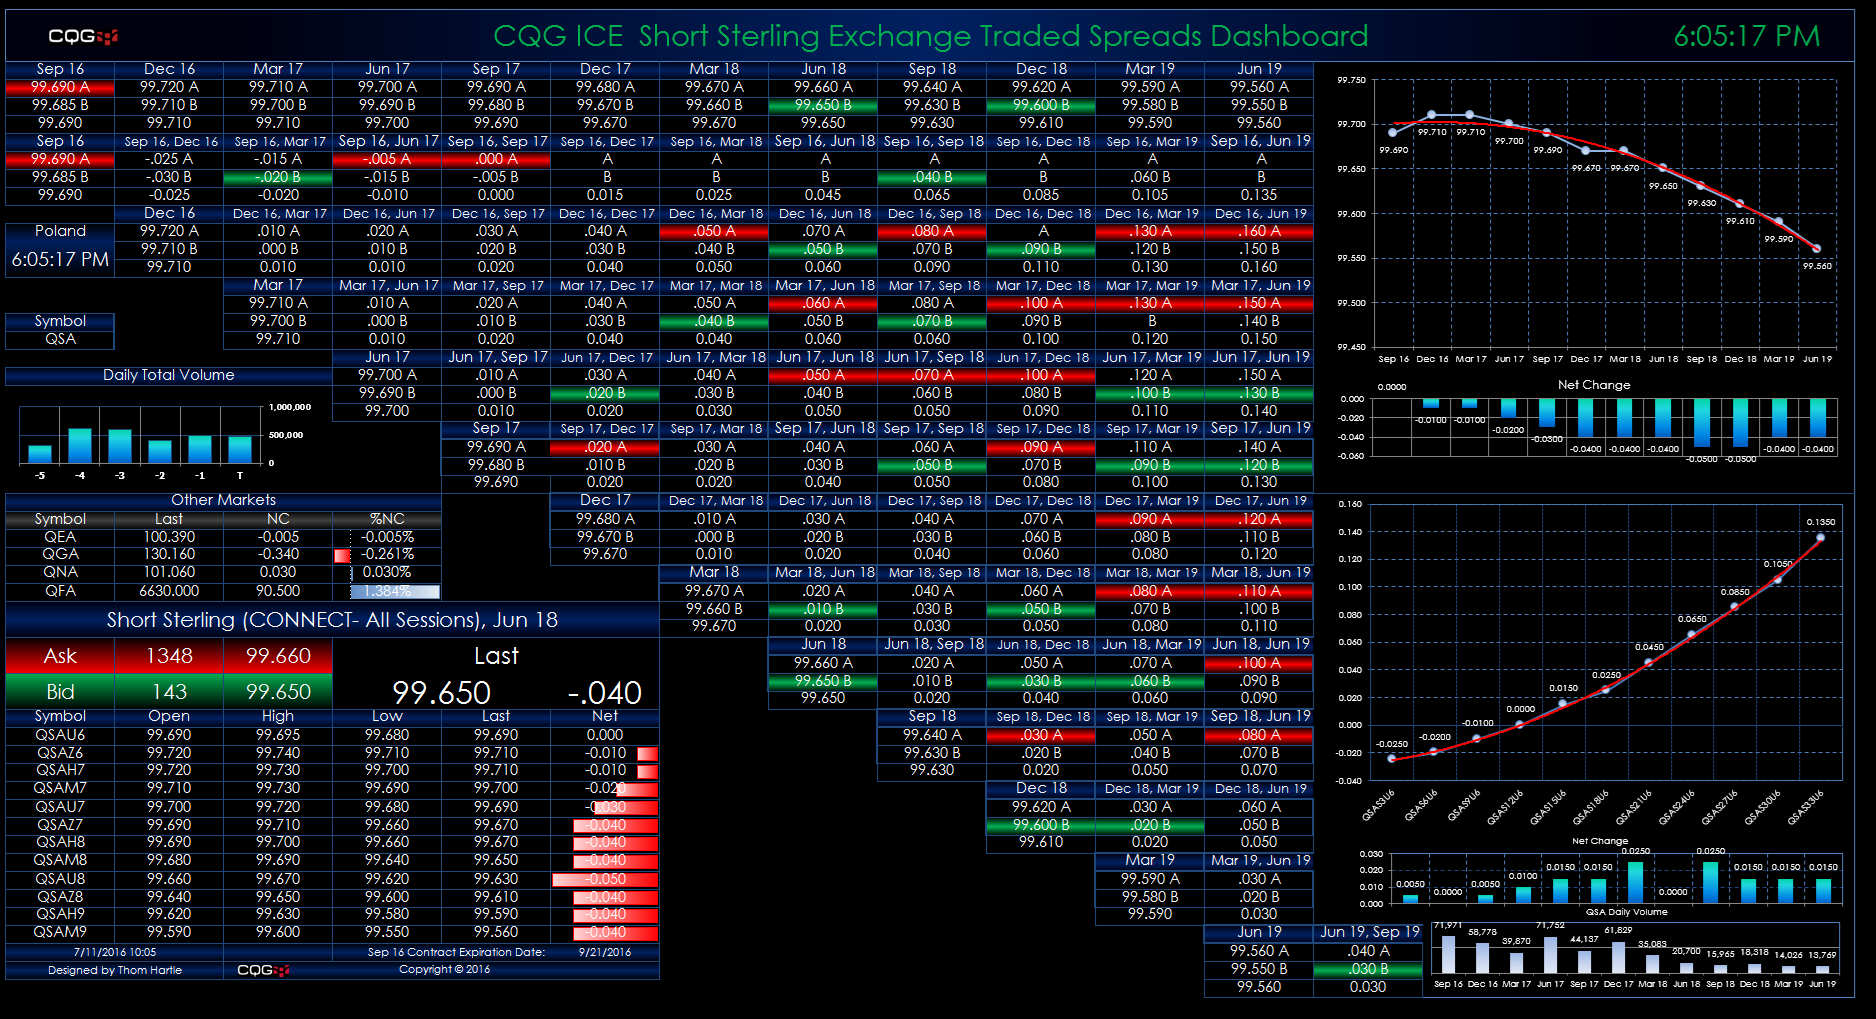
This Microsoft Excel® dashboard displays market data for Short Sterling calendar spreads traded on the ICE platform. This monitor uses a matrix-style format. The outrights are displayed along the… more
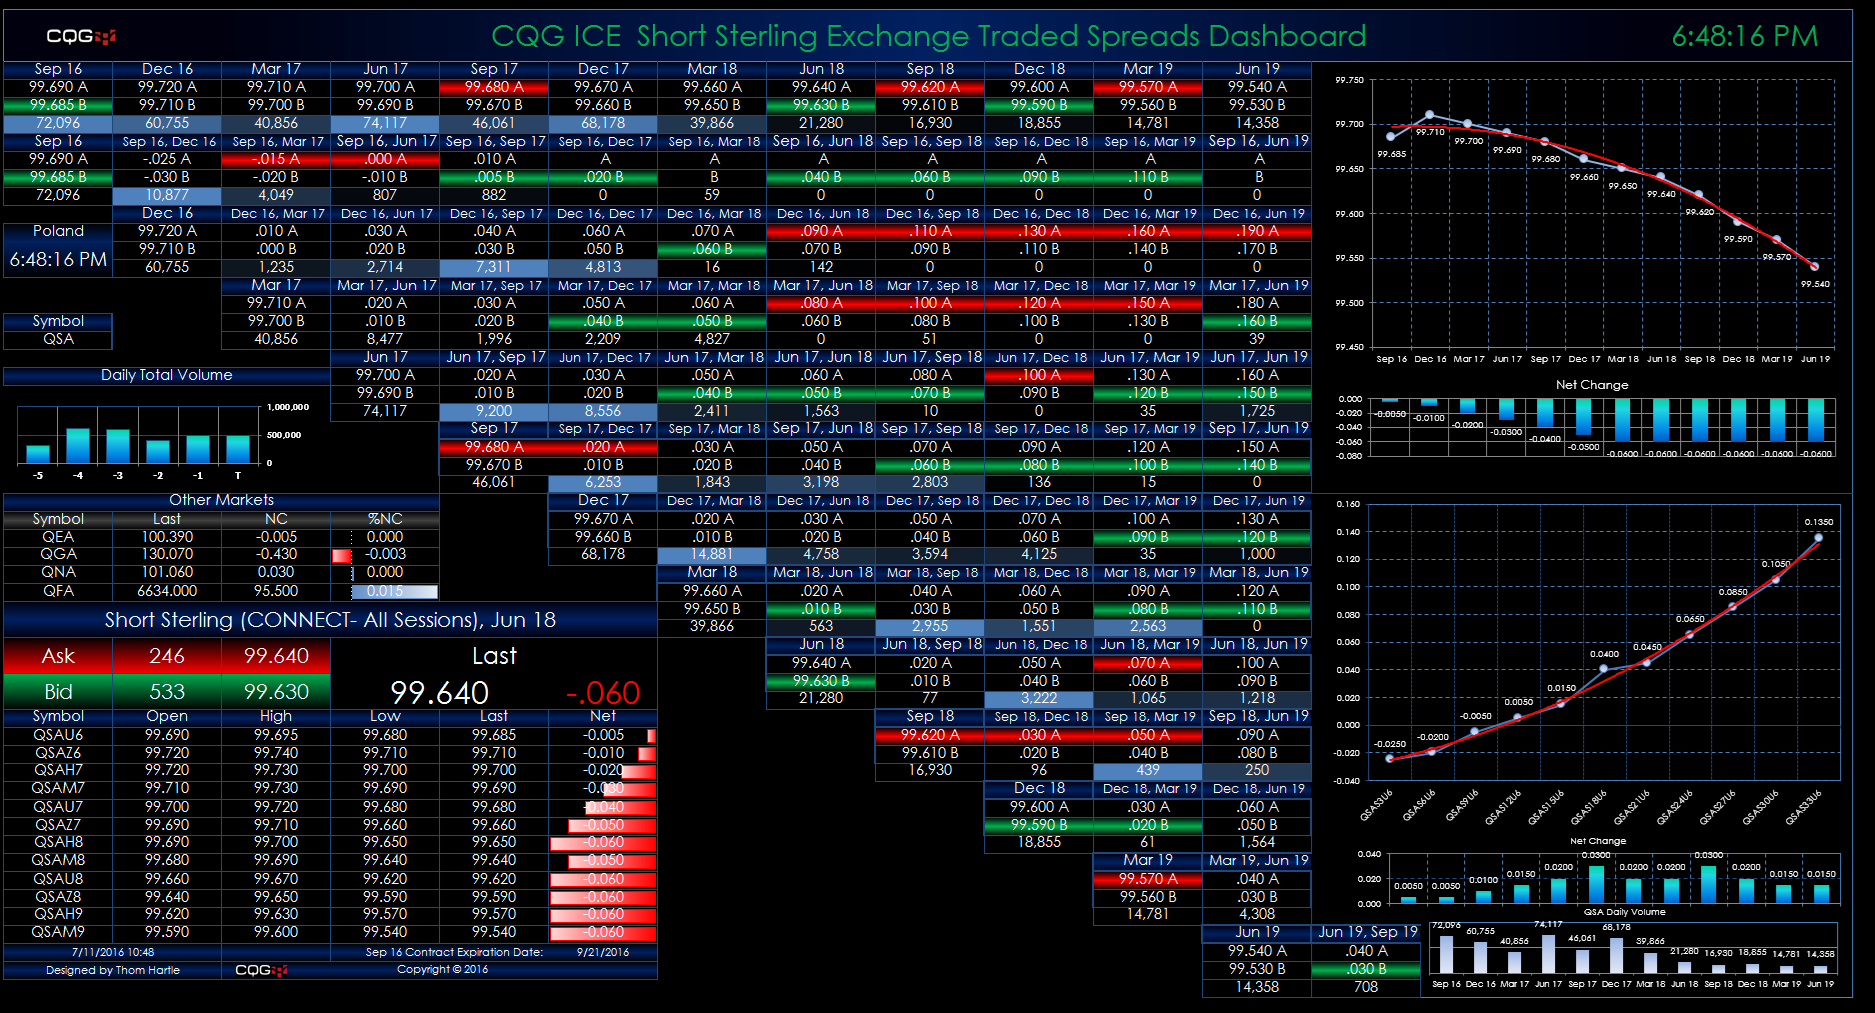
This Microsoft Excel® dashboard displays market data for Short Sterling calendar spreads traded on the ICE platform. This monitor uses a matrix-style format. The outrights are displayed along the… more
Customers using our flagship product, CQG Integrated Client (CQG IC), have access to a new study called Algo Orders. Using a proprietary algorithm, this trading activity indicator detects and… more
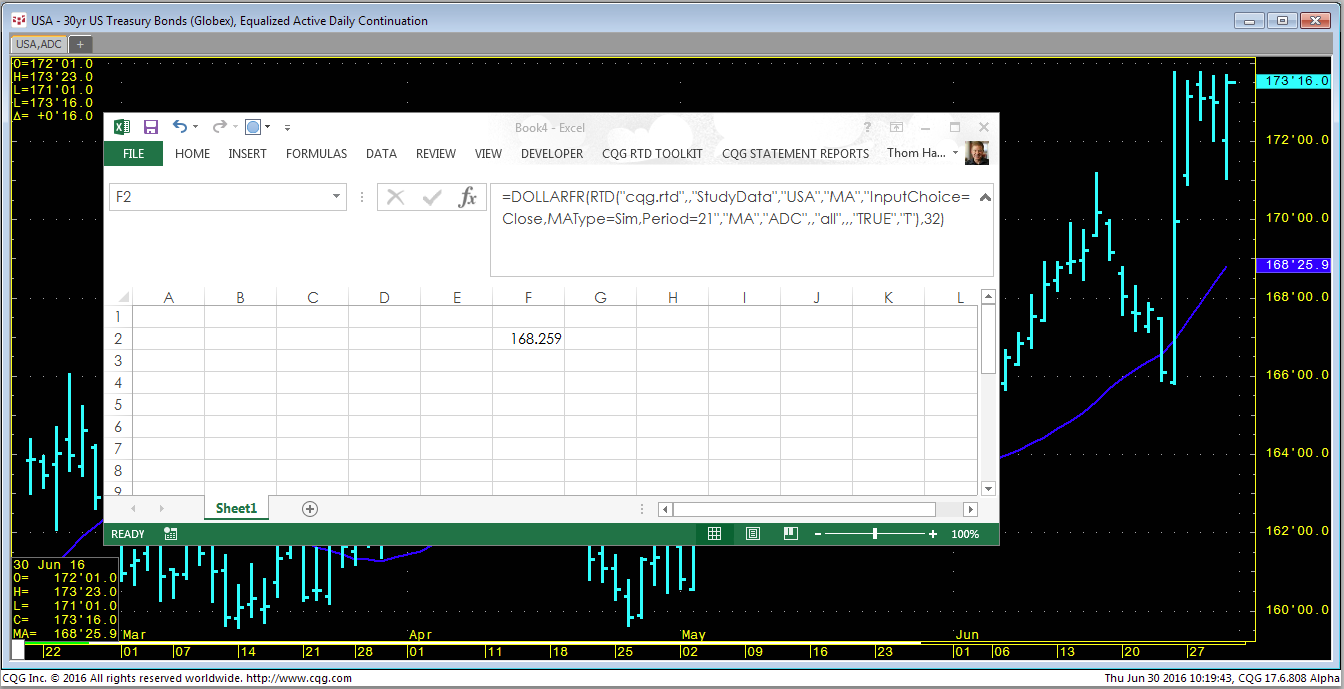
When pulling a study value into Excel using RTD, you may not see the same value in Excel that you see on a chart. It is important that the RTD formula uses the same parameters as applied to the… more
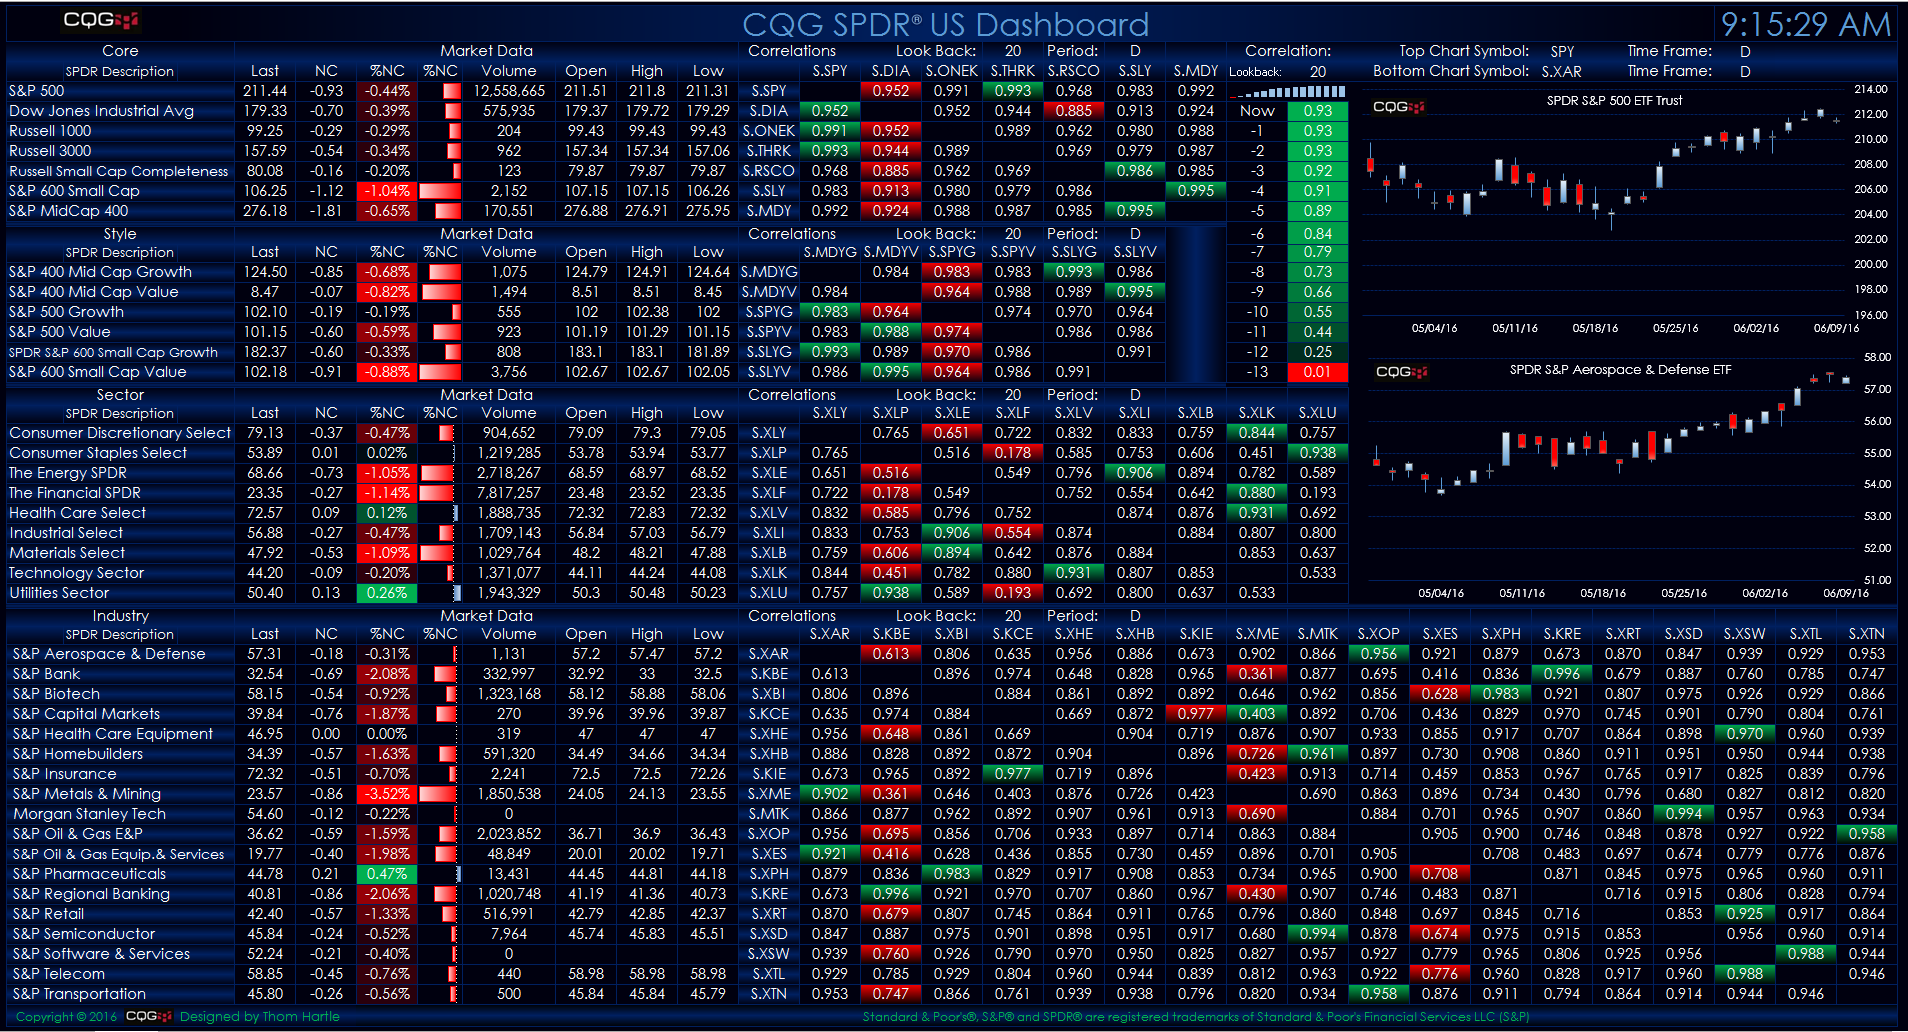
This Microsoft Excel® dashboard displays market data and correlations of US equity SPDR® (Standard & Poor's Depositary Receipts) ETF products. The ETFs are grouped by Core, Style, Sector, and… more
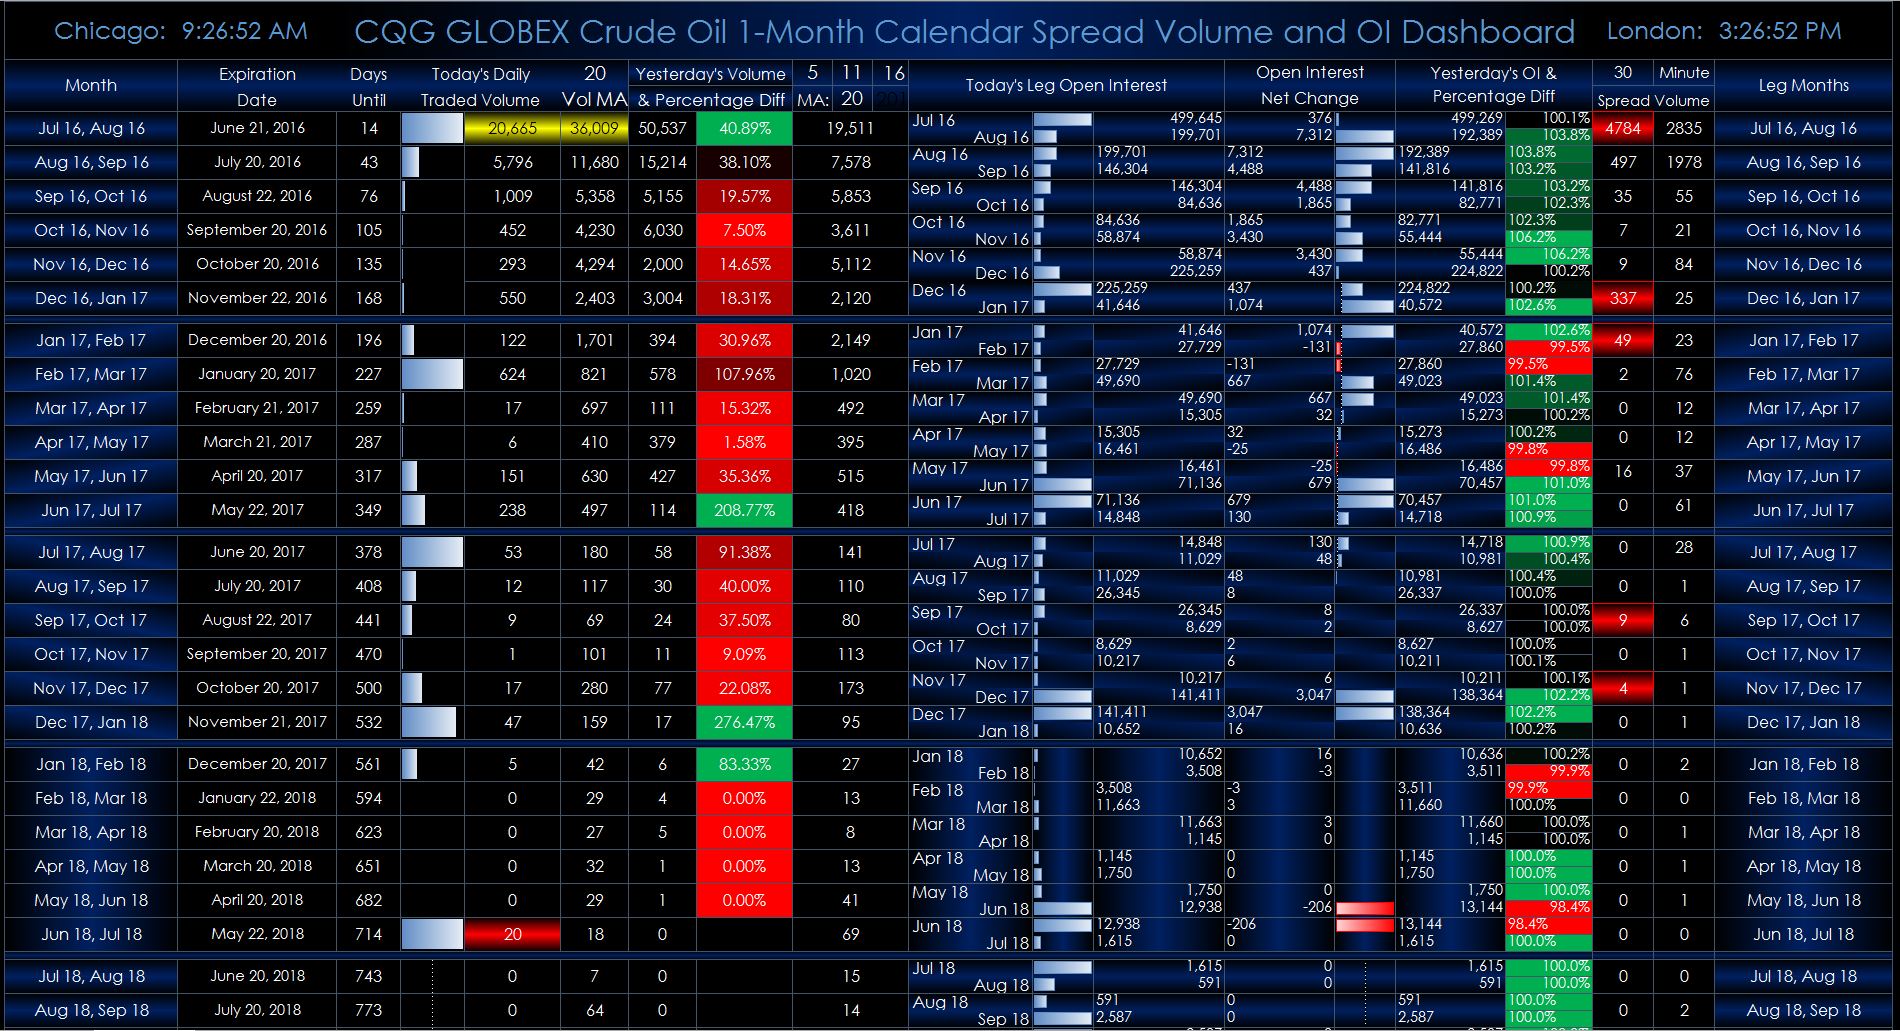
This Microsoft Excel® dashboard displays individual one-month crude oil calendar spreads traded on CME Globex and their individual legs for tracking the volume and open interest rolls. All of… more
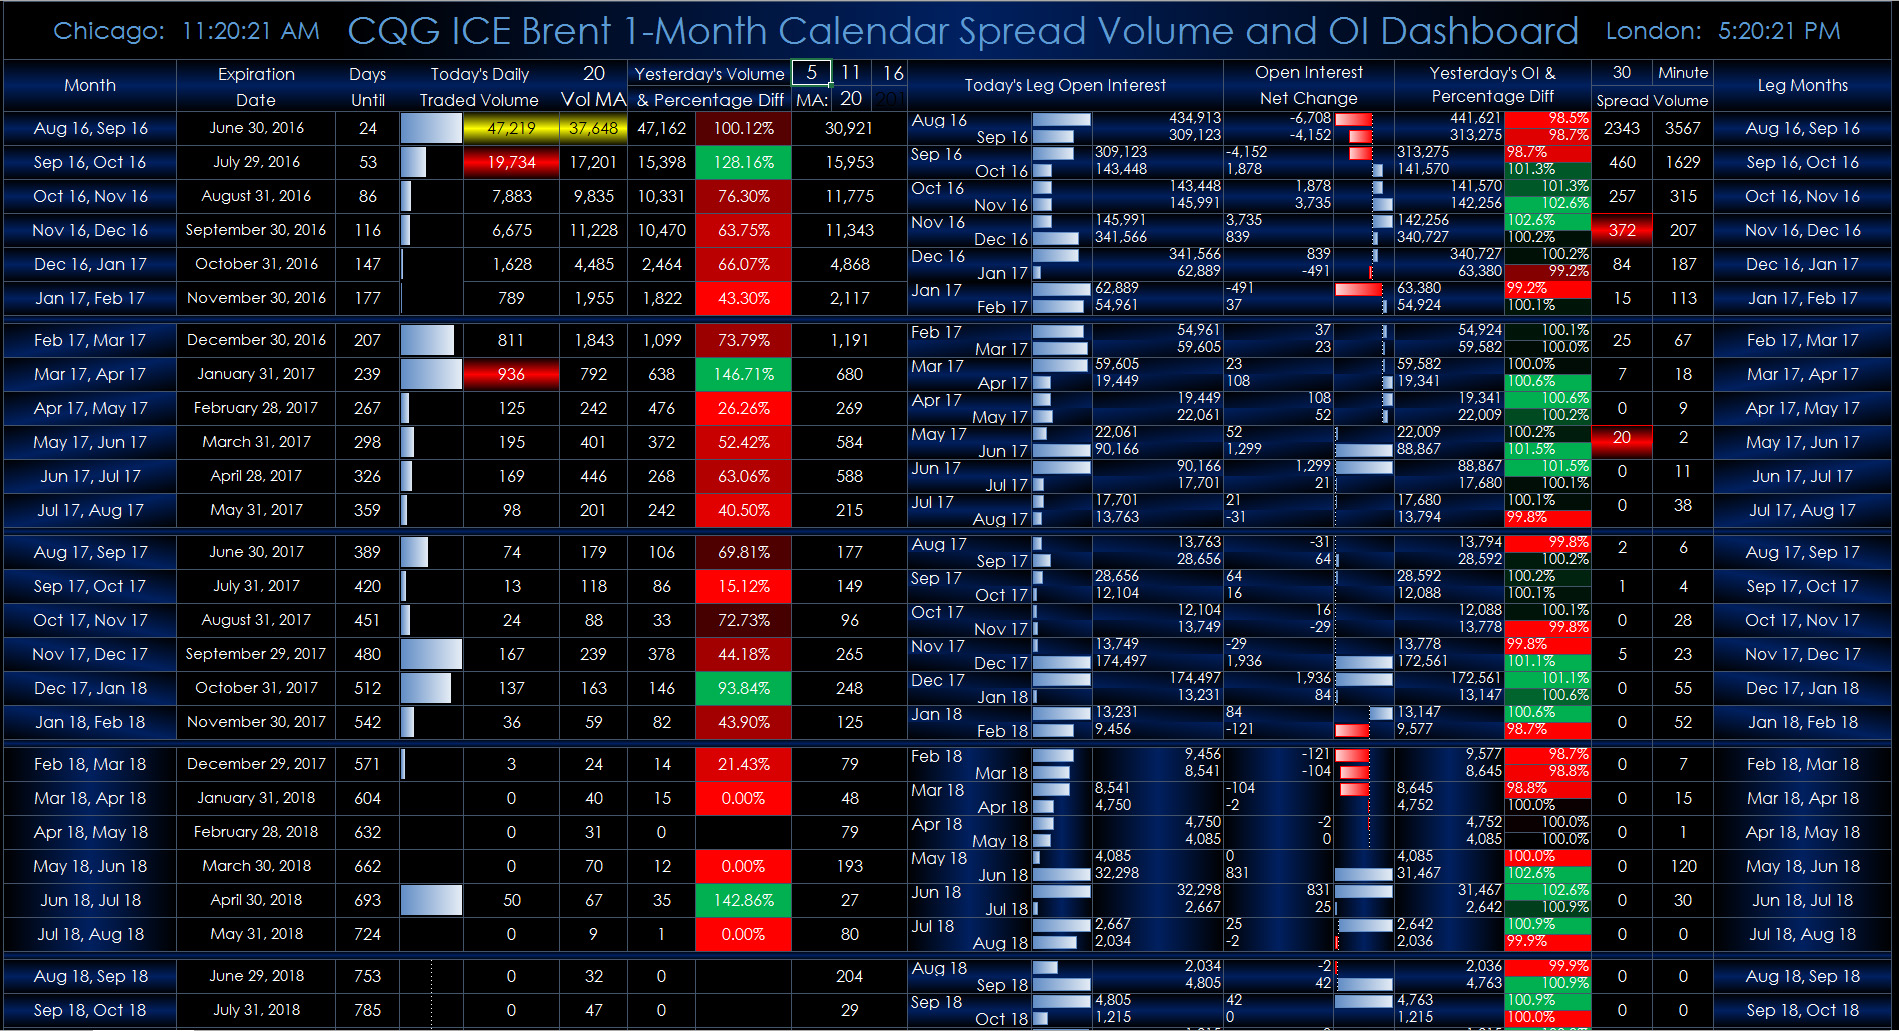
This Microsoft Excel® dashboard displays individual one-month Brent crude oil calendar spreads and their individual legs for tracking the volume and open interest rolls. All of the active… more
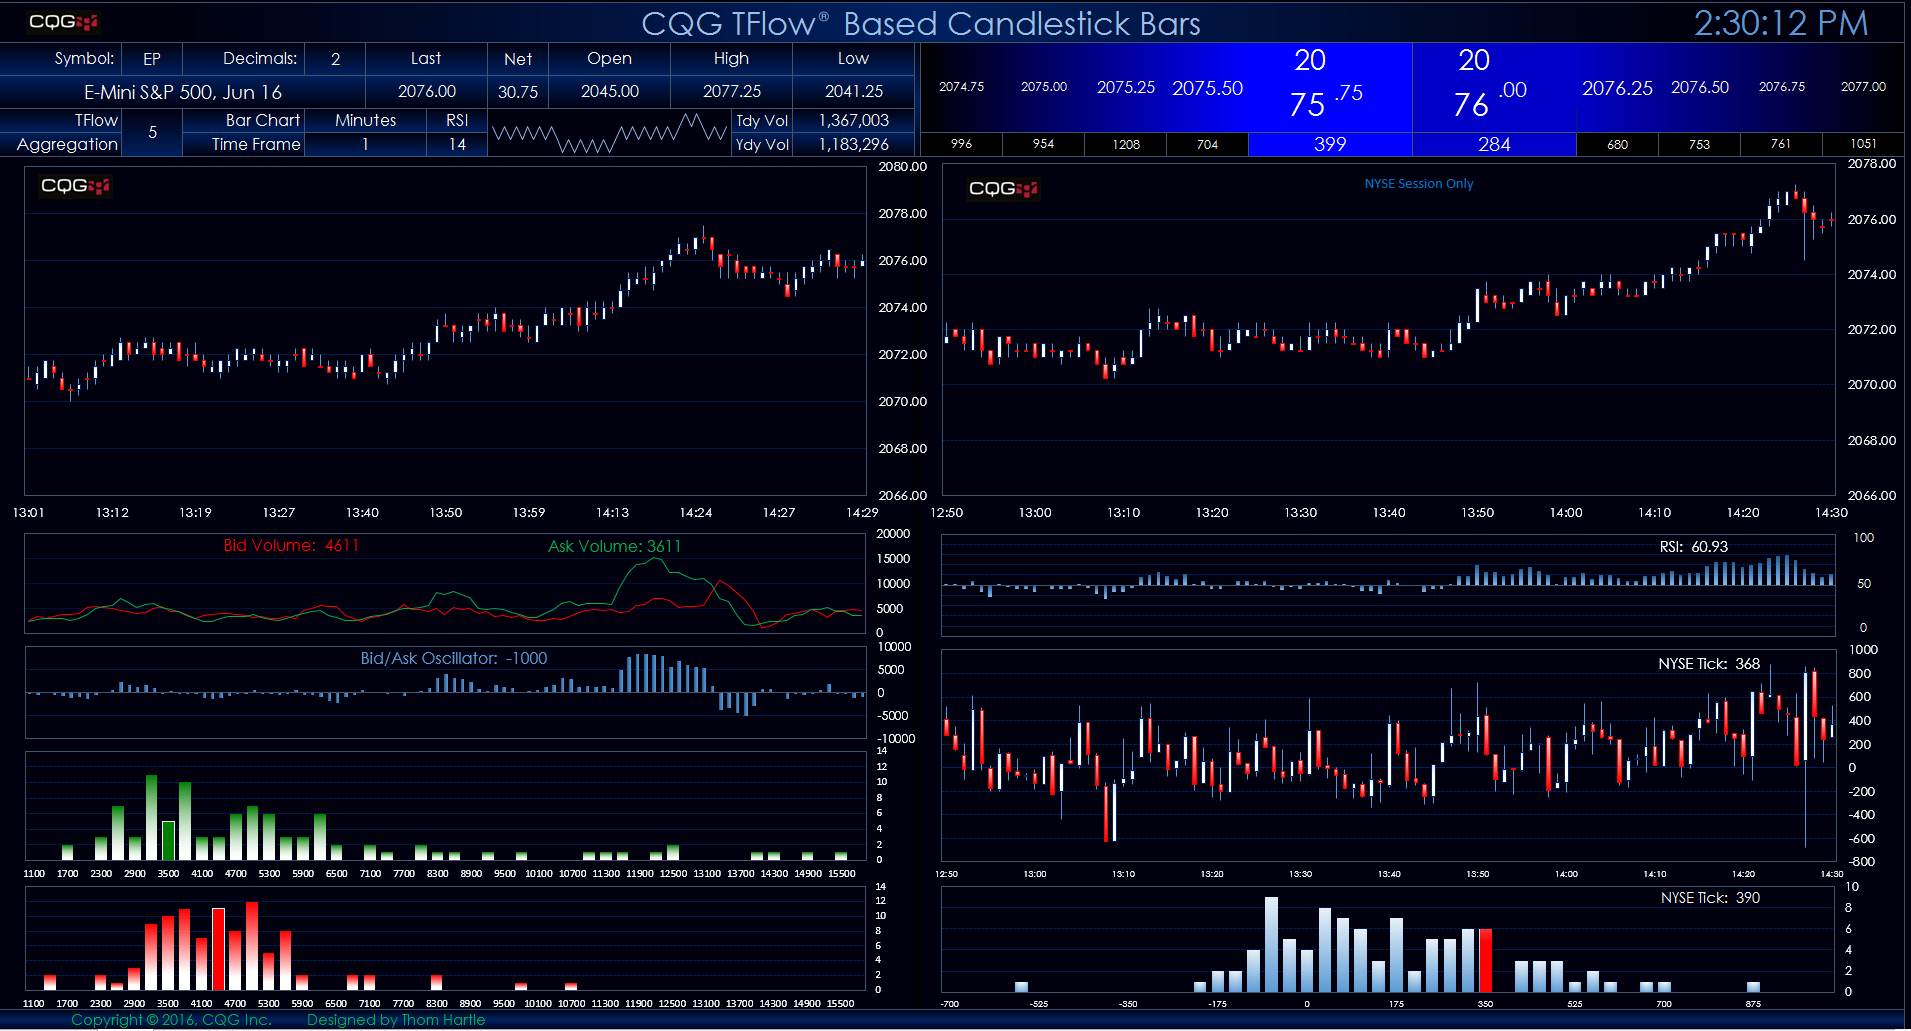
This Microsoft Excel® spreadsheet presents two views of the E-mini S&P contract. The left-hand view displays candlestick bars using CQG’s proprietary TFlow chart data. You can use the… more
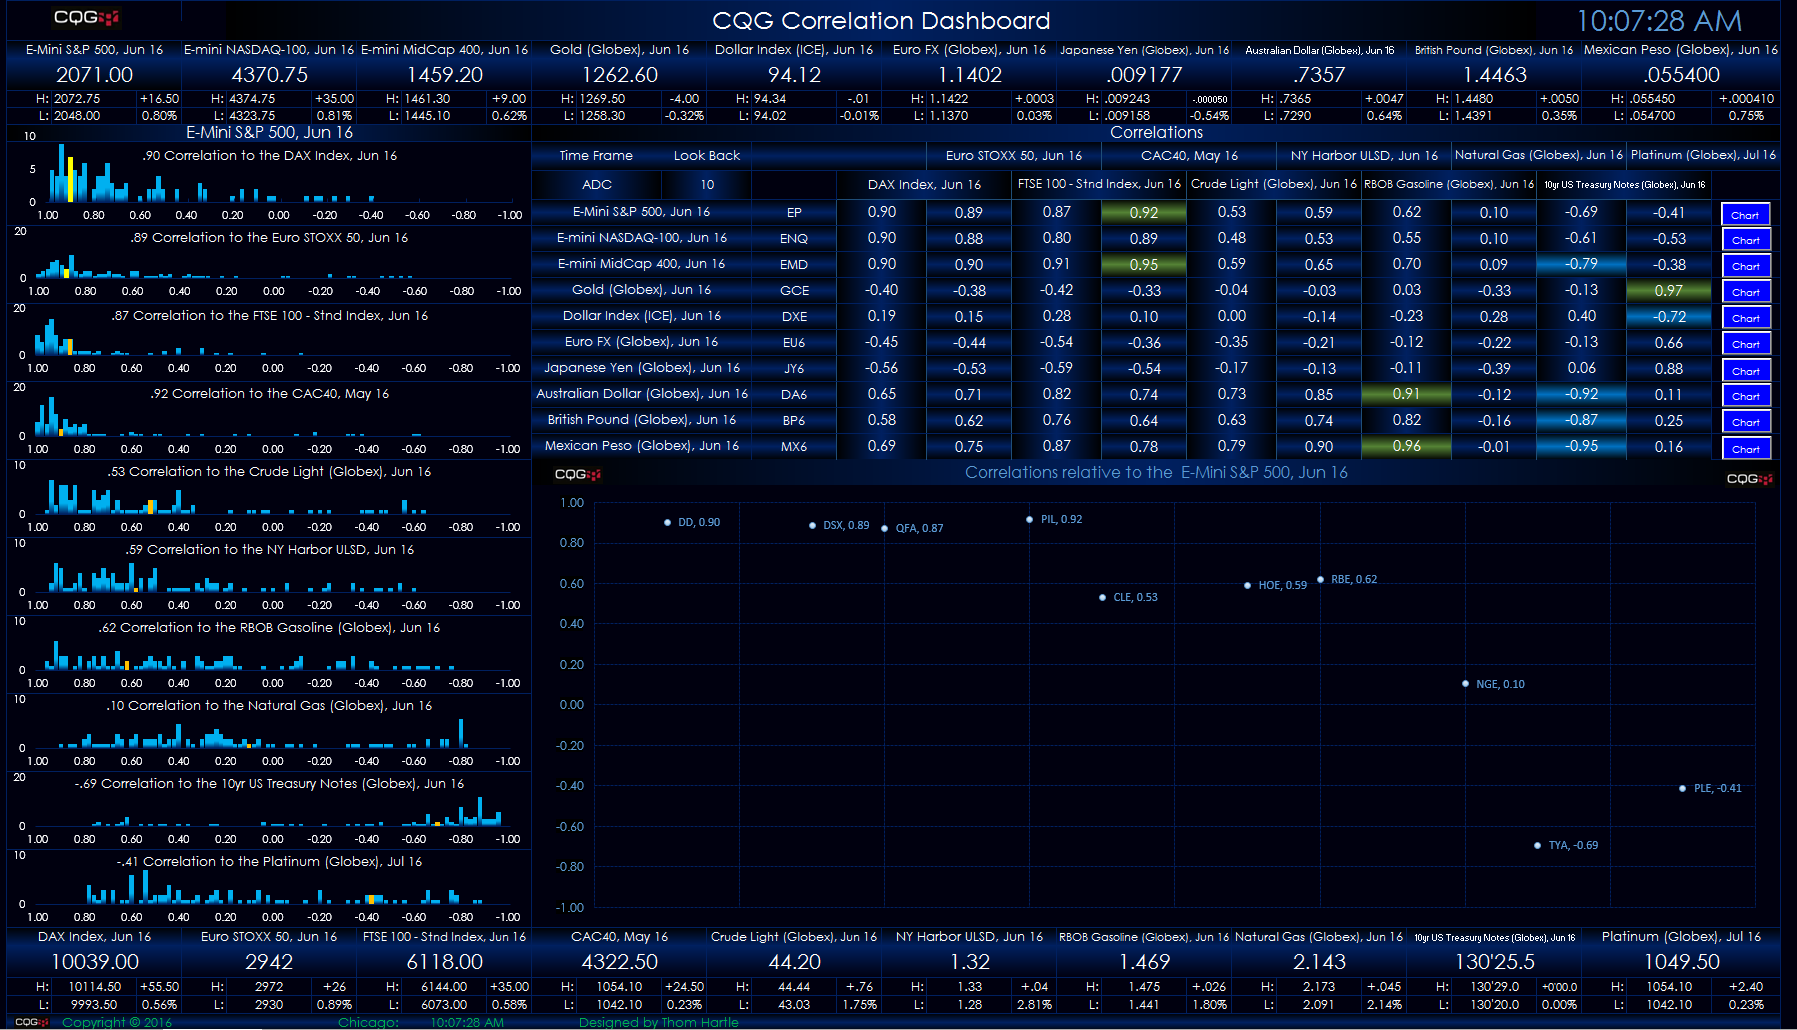
This Microsoft Excel® spreadsheet presents a ten-by-ten correlation matrix.
There is a symbols tab where you enter symbols and price formatting, such as two decimal places, etc. The… more