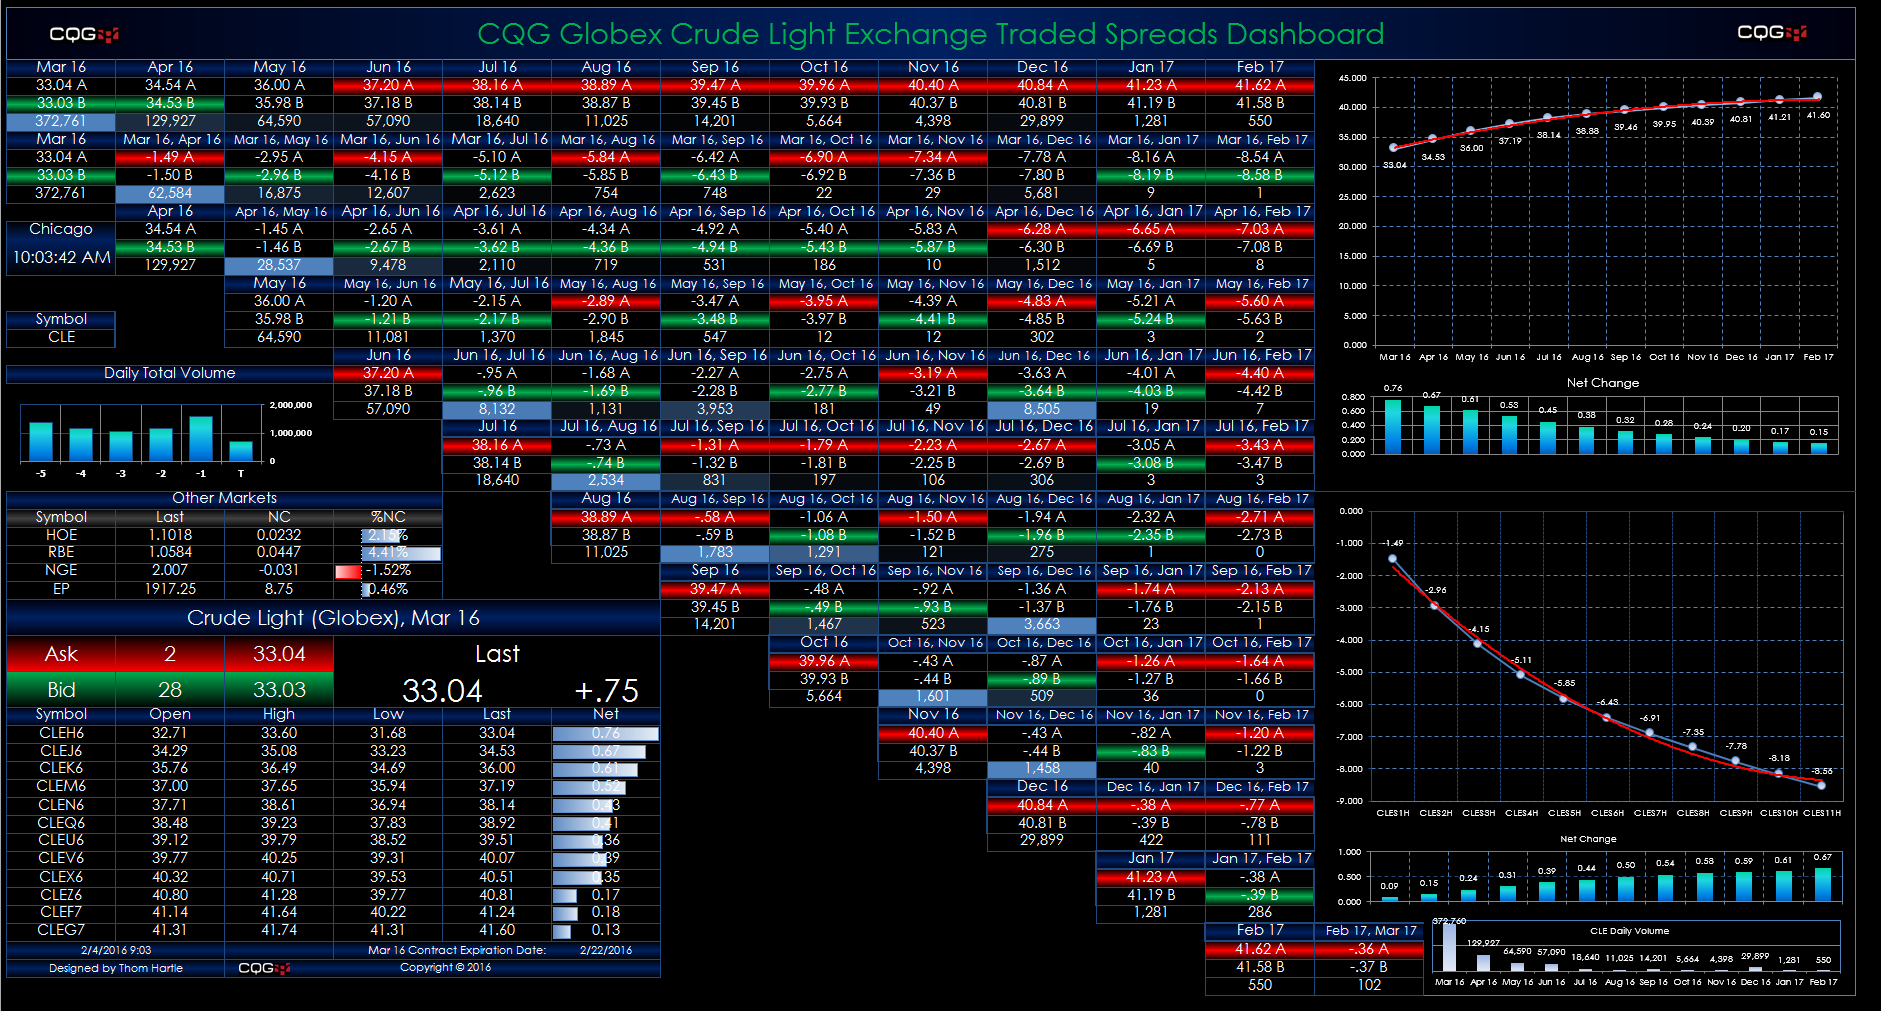
This Microsoft Excel® dashboard displays market data for crude oil spreads traded on the CME Globex platform. The dashboard is in a matrix-style format. The outrights are along the top row and the… more
Excel/RTD
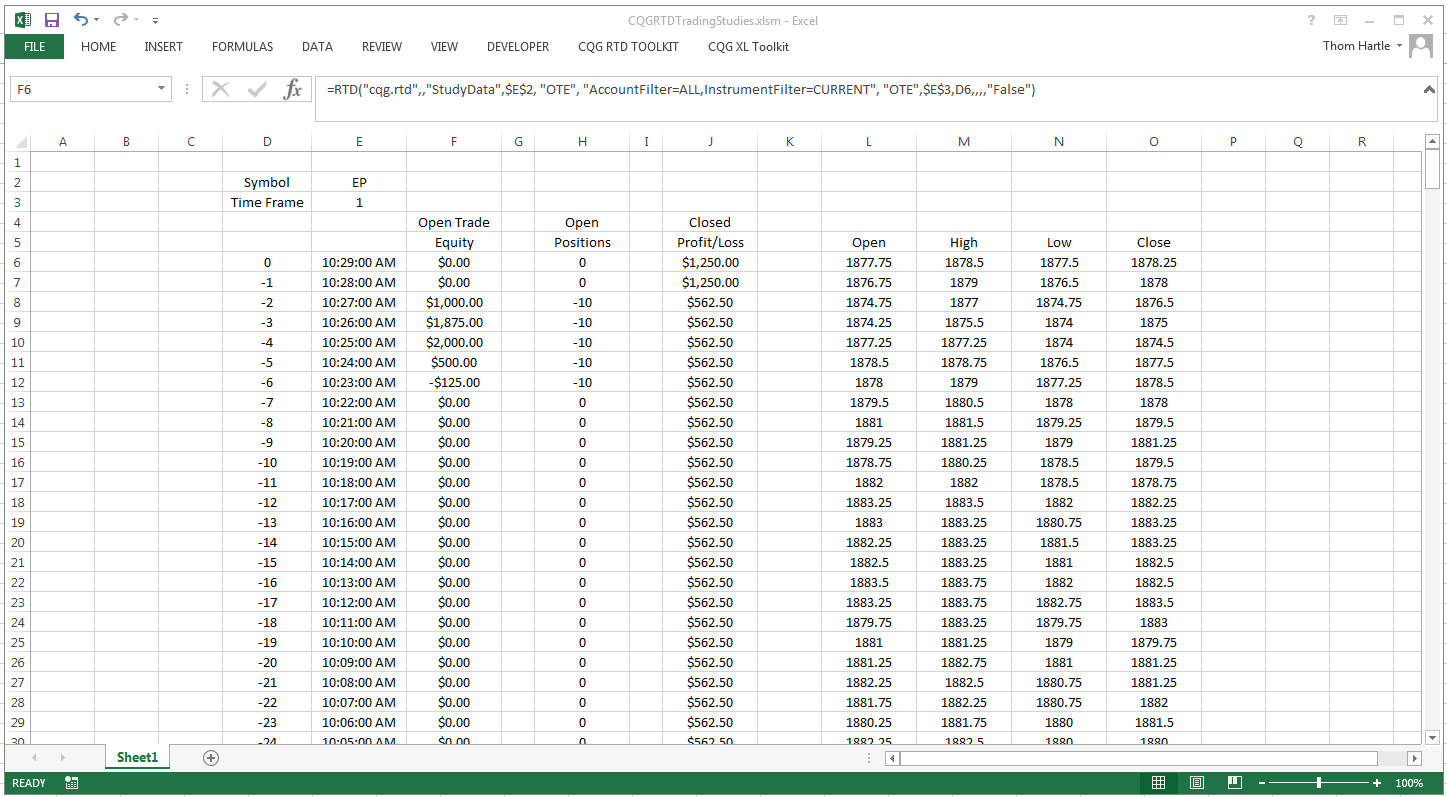
This Microsoft Excel® dashboard uses RTD formulas to pull the following CQG Trading Studies into Excel:
Open Trade Equity Position Profit & LossThese are study formulas and… more
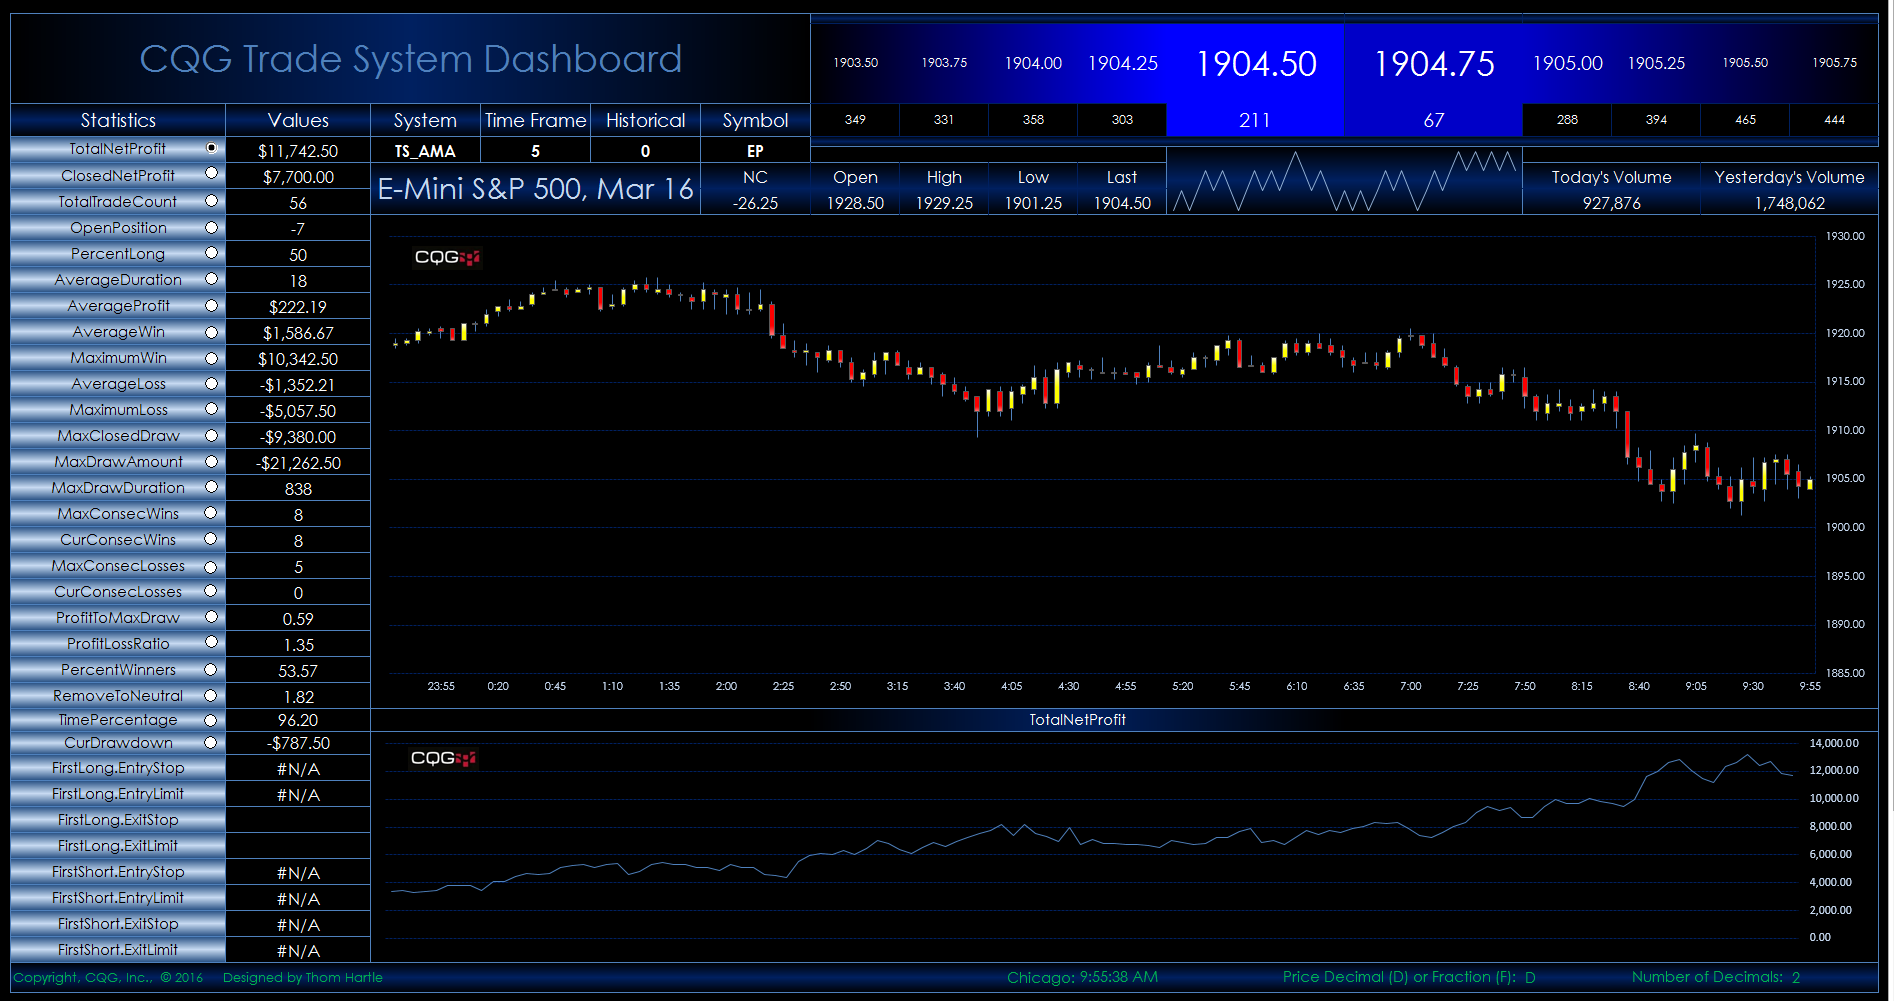
This Microsoft Excel® dashboard displays trade system statistics pulled from CQG’s Backtesting module. Enter the system's “short’ name, chart time frame, and symbol.
This new version… more
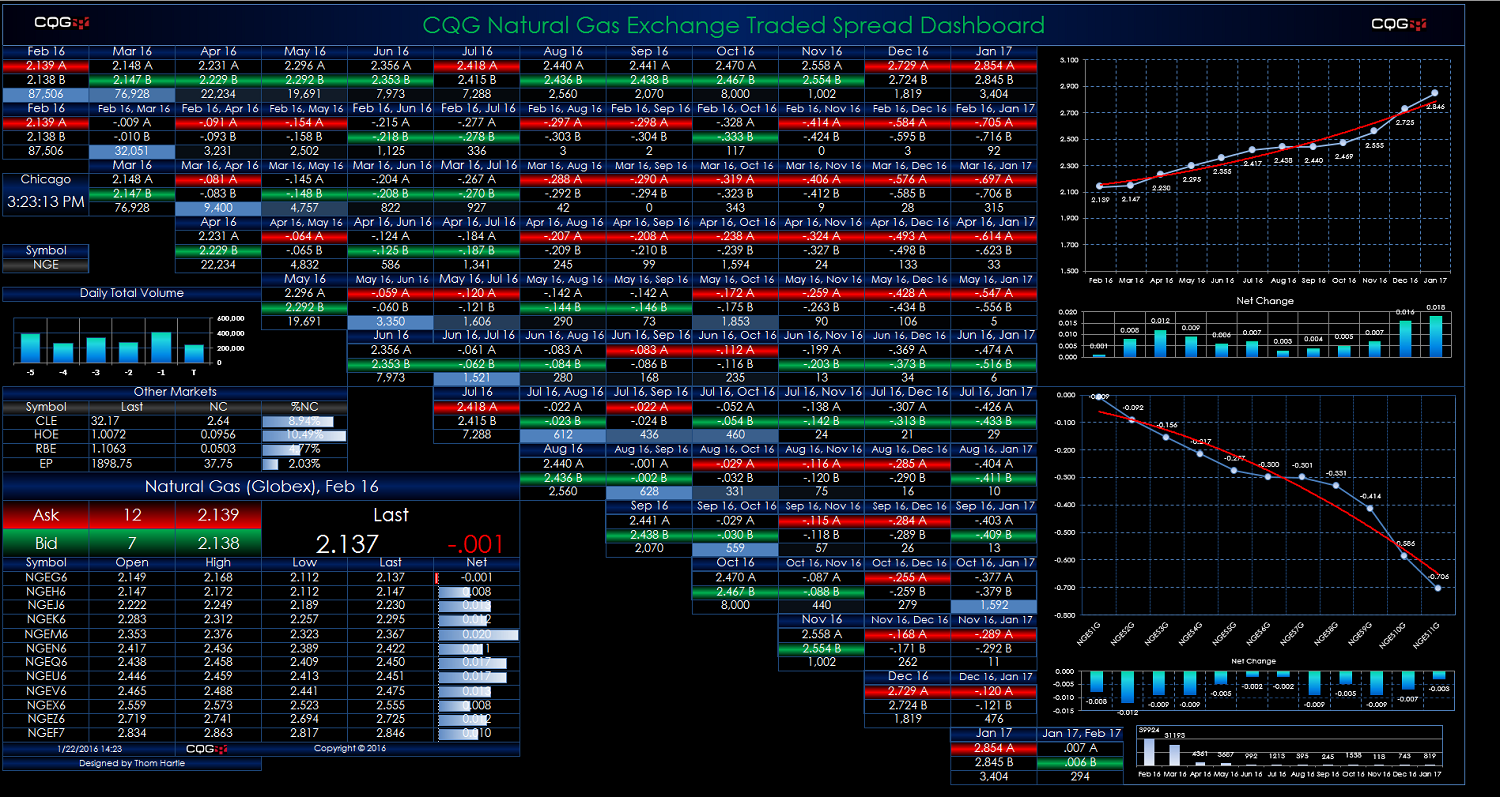
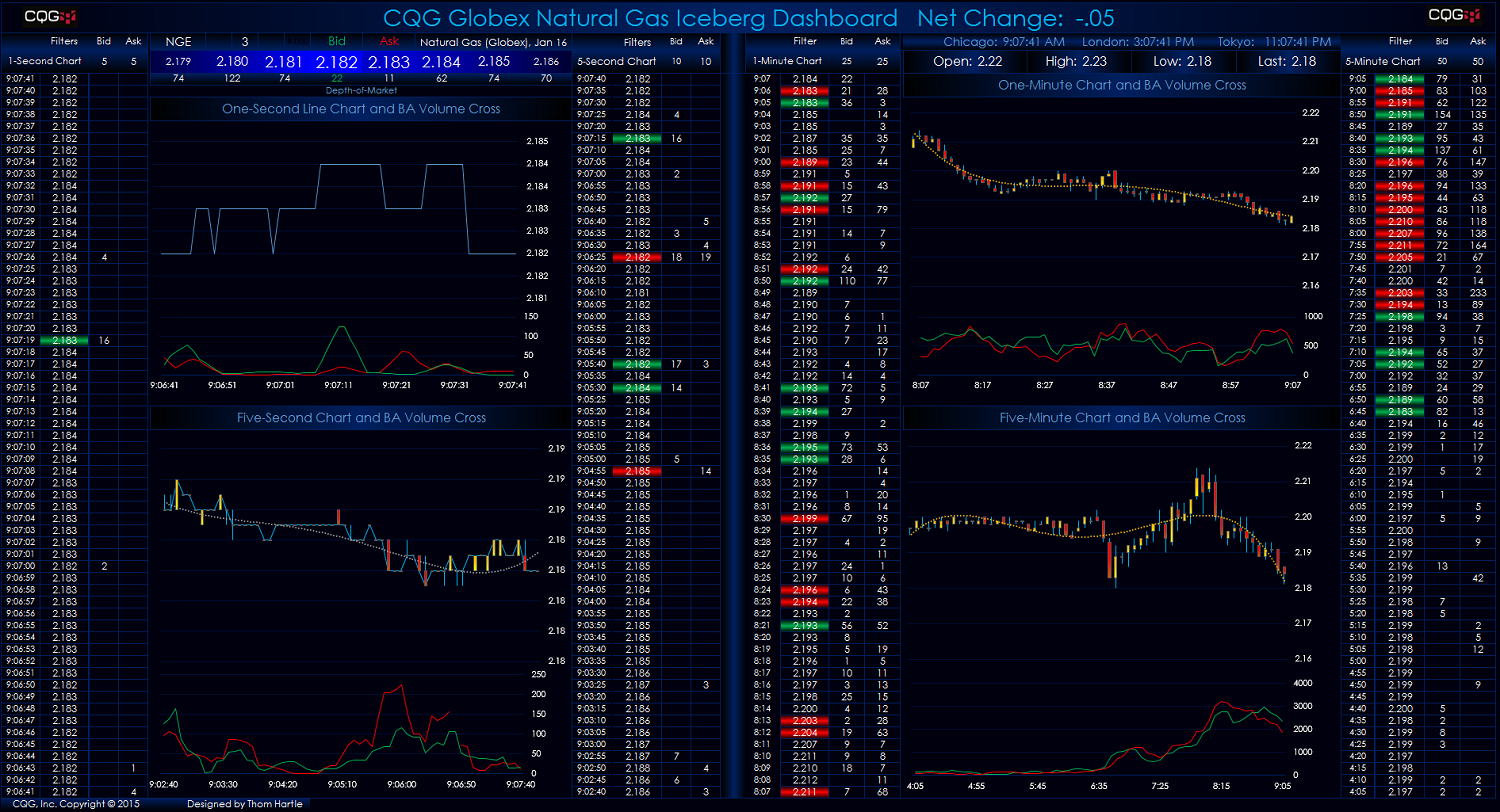
This Microsoft Excel® dashboard displays market data for natural gas spreads traded on the CME Globex platform. This monitor uses a matrix-style format. The outrights are along the top row and the… more

This Microsoft Excel® dashboard displays market data for Soybean Crush Spreads traded on the CME Globex platform. These spreads have an added layer of complexity due to the soybean contract not… more
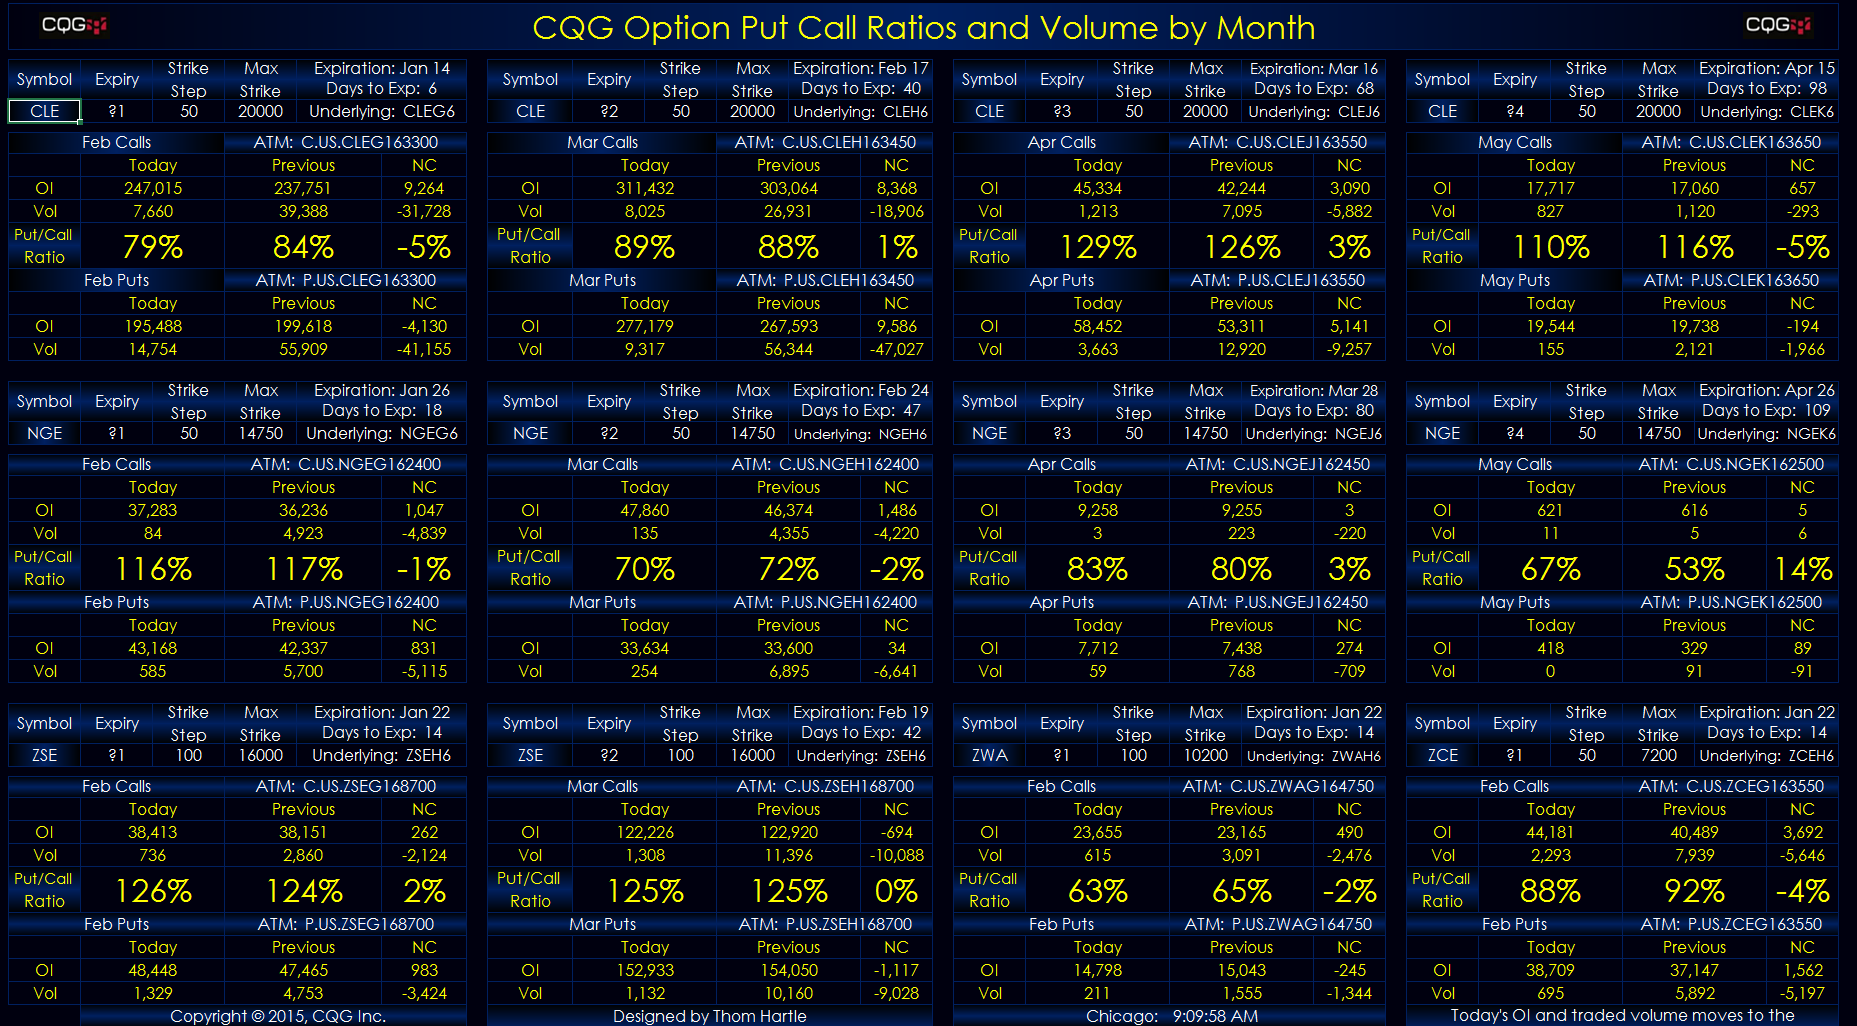
This Microsoft Excel® dashboard displays today’s open interest and traded volume for all of the strikes by month for both call and put options on futures. In addition, the current put/call ratio… more
Customers using our flagship product, CQG Integrated Client (CQG IC), have access to a new study called Algo Orders. Using a proprietary algorithm, this indicator of trading activity detects and… more
Customers using our flagship product, CQG Integrated Client (CQG IC), have access to a new study called Algo Orders. Using a proprietary algorithm, this indicator of trading activity detects and… more

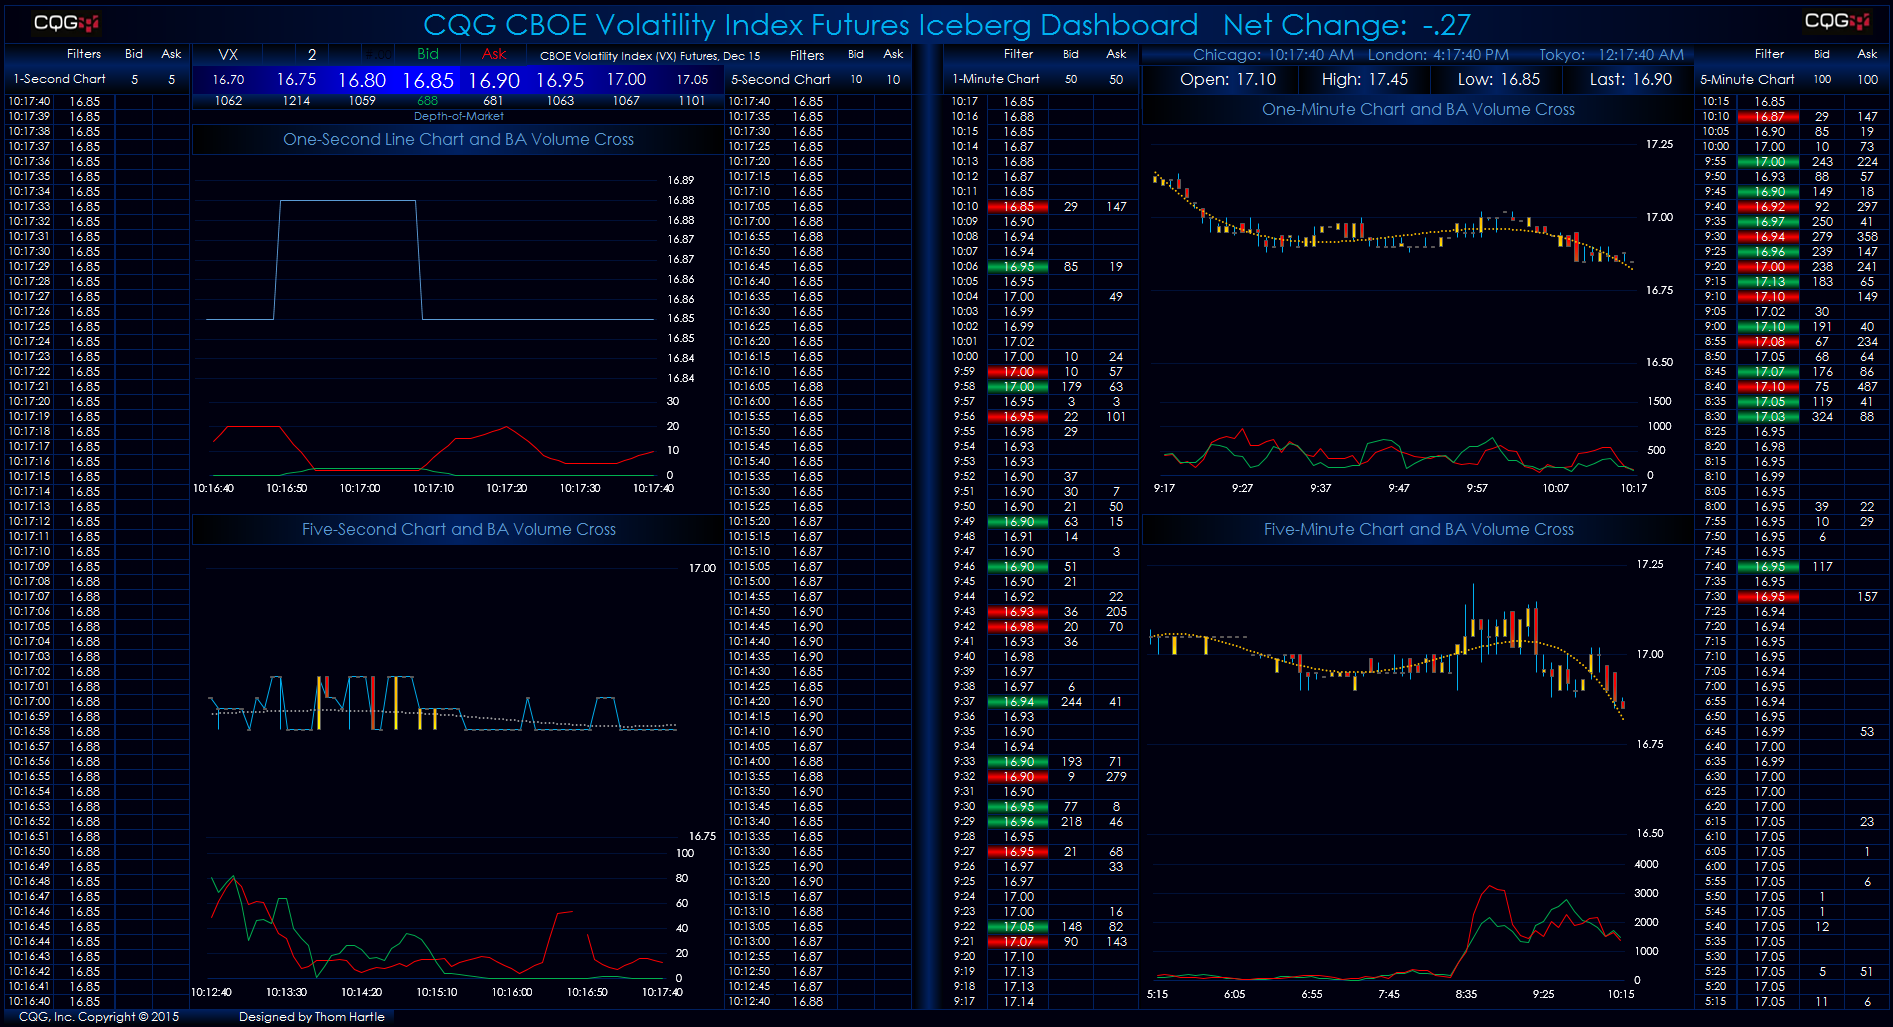
This Microsoft Excel® dashboard displays a depth-of-market (DOM) view of CBOE Volatility Index futures weekly reverse calendar spreads. The exchange quotes these markets as negative numbers for… more
Customers using our flagship product, CQG Integrated Client (CQG IC), have access to a new study called Algo Orders. Using a proprietary algorithm, this indicator of trading activity detects and… more