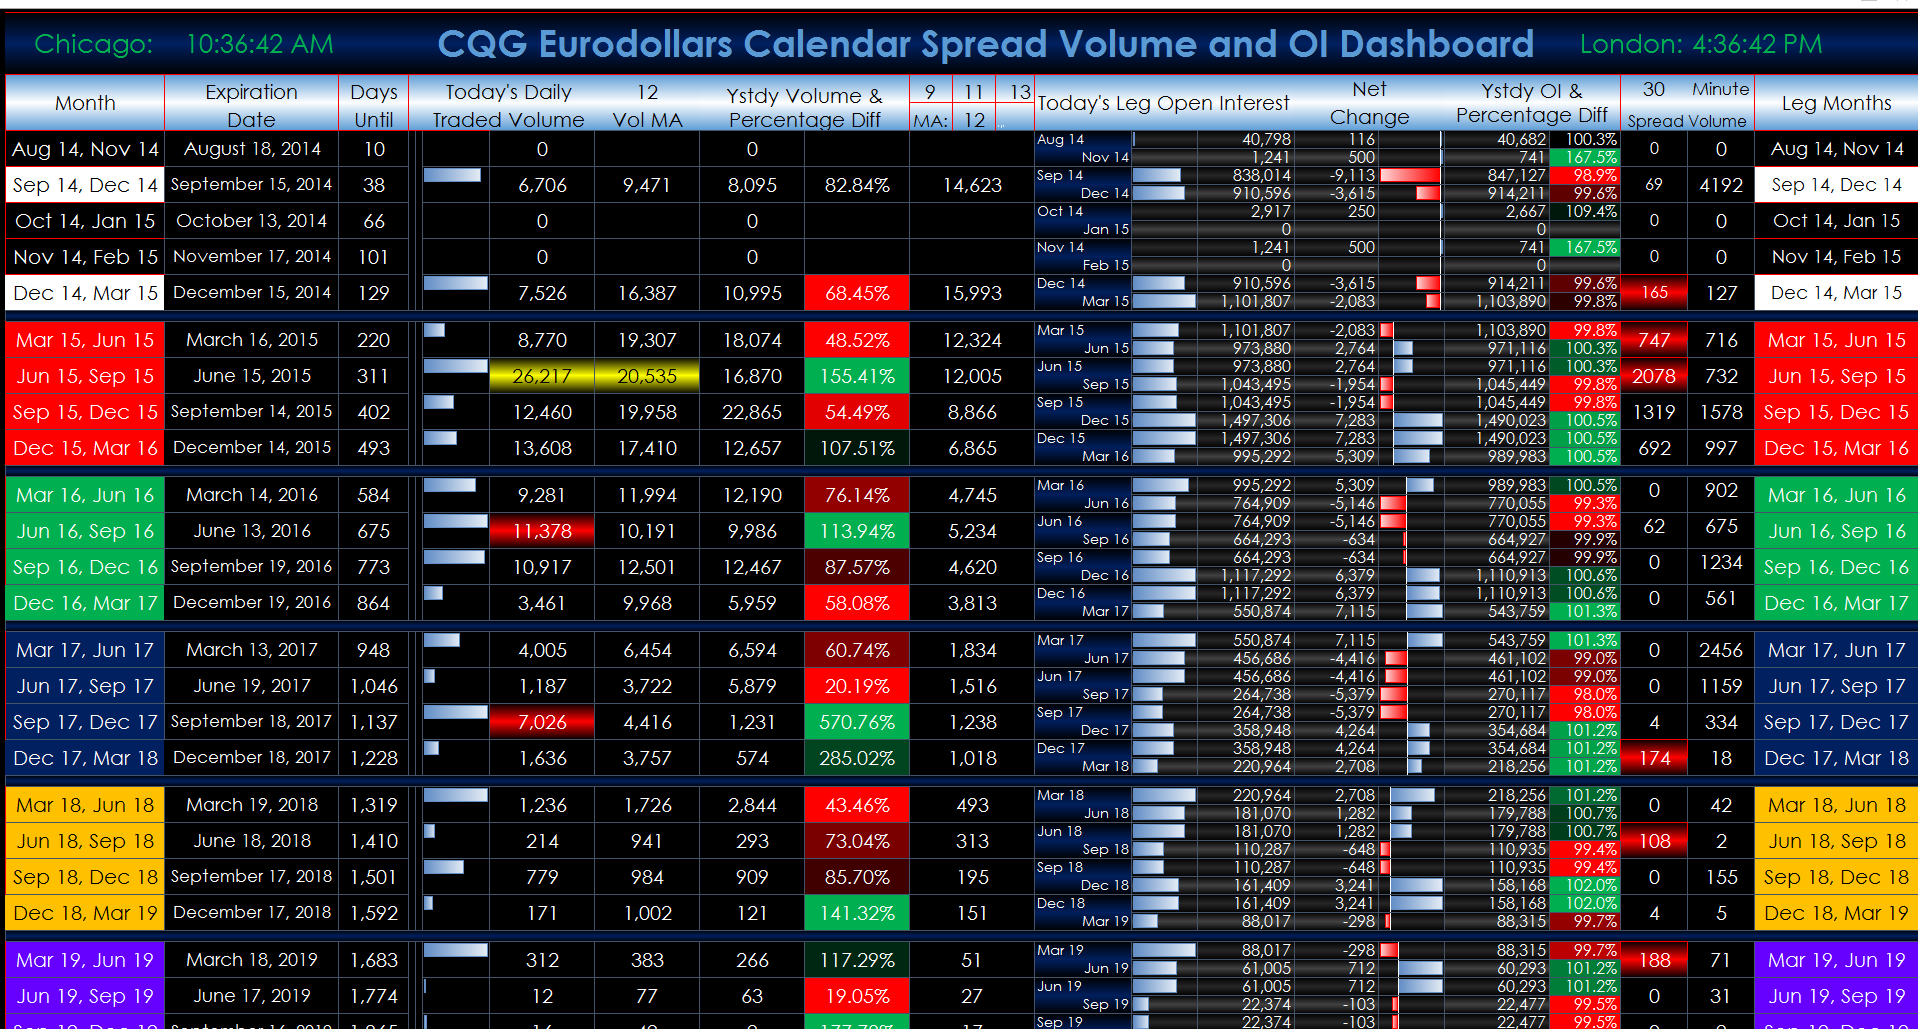
This Microsoft Excel® dashboard displays all of the Globex-traded Eurodollar three-month calendar contracts. The volume column includes a red highlight if today's traded volume exceeds the previous session's traded volume. The volume column highlights in gold the contract that has the largest twelve-day moving average. You can change the look-back period for the moving average. You can also enter in a calendar date and pull a moving average value of the volume from that date. The open interest and changes in open interest for the individual legs are displayed. Finally, if the thirty-minute volume exceeds yesterday's thirty-minute volume for the same time, then the volume is highlighted in red. Other short-term interest rate roll dashboards are available by contacting the author.
Make sure to lower your Excel RealTimeData (RTD) throttle to 50 milliseconds. Learn how to do that here.
Requirements: CQG Integrated Client, data enablements for all symbols displayed in this spreadsheet, and Excel 2010 or more recent.