Version 3
This CQG-powered Microsoft Excel® dashboard offers a ten-year performance review for a period defined by the user. You can use futures and stock symbols. Enter one starting futures symbol and Excel will do the rest. If you enter in a Treasury symbol, then change the "N" to "Y" in the Symbols window and set the Price Change Decimals value to six.
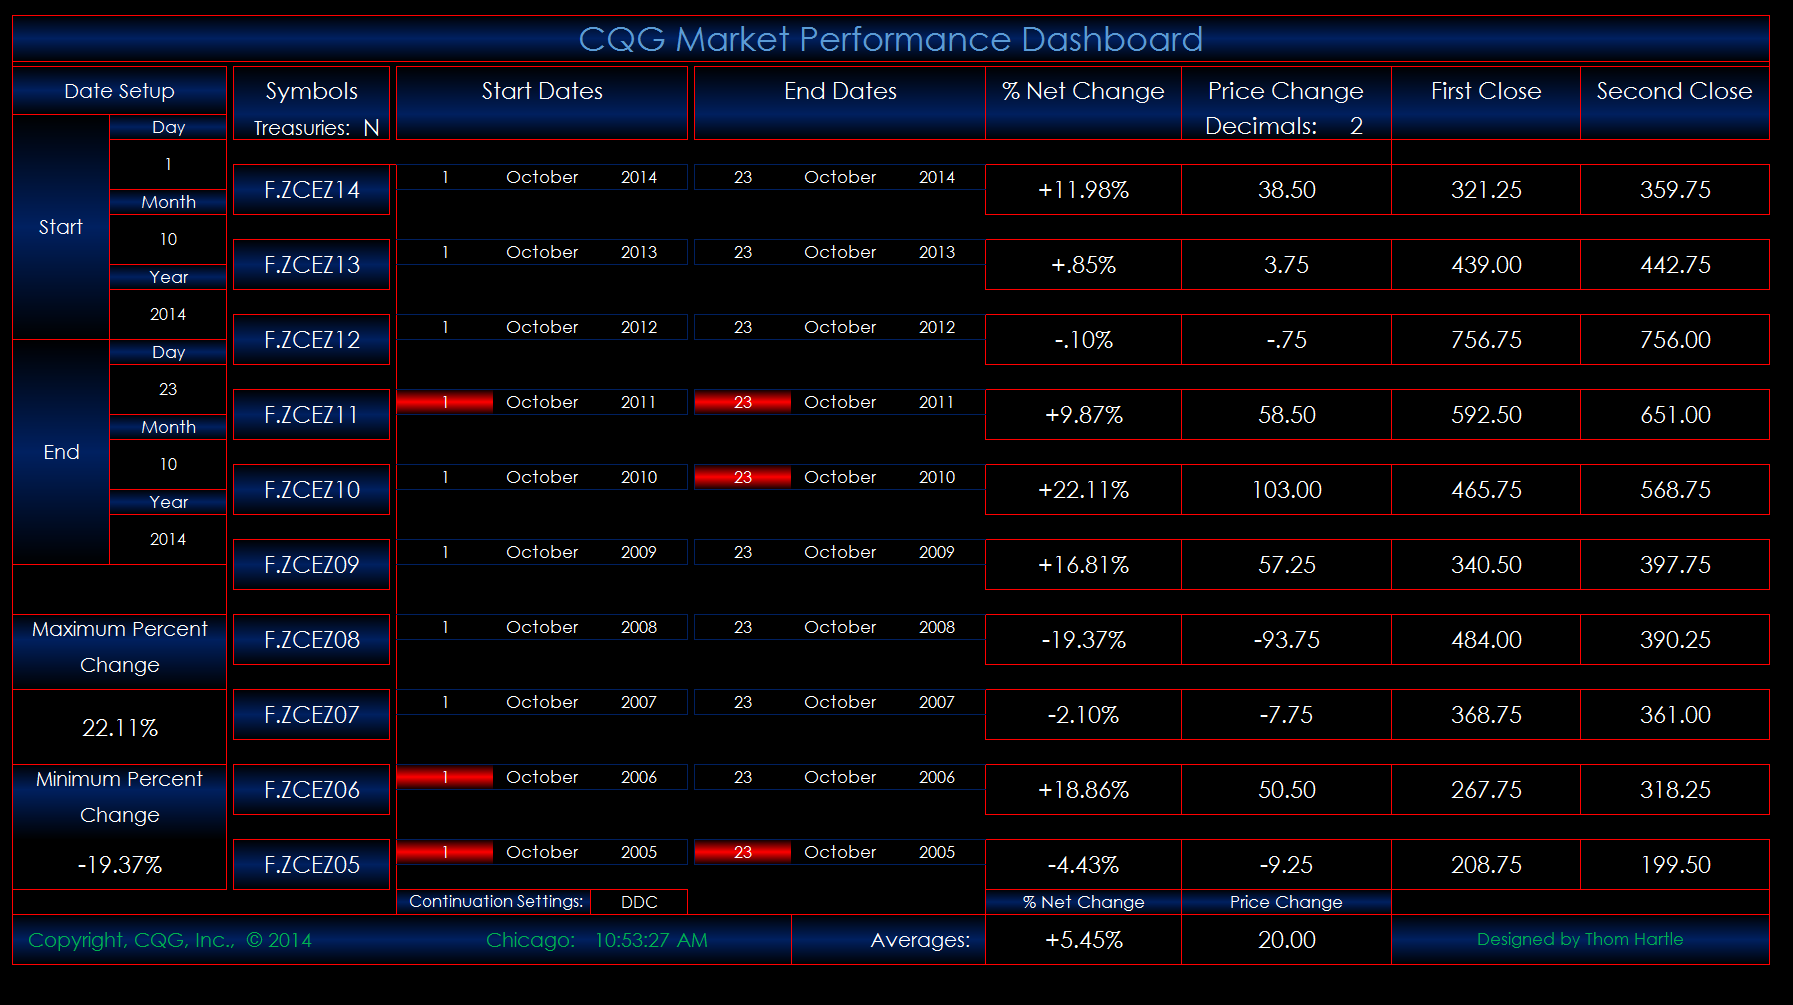
Please read the Instructions tab for more information.
Make sure to lower your Excel RealTimeData (RTD) throttle to 0 milliseconds. Learn how to do that here.
Requires CQG Integrated Client, data enablements for all symbols displayed in this spreadsheet, and Excel 2010 or more recent.