This Microsoft Excel® spreadsheet uses a horizontal DOM display with FX-style formatting of the best bid and best ask for three markets along with bar or sub-minute charts. The fourth display is a correlation display. You configure the correlation display by entering the symbols, time frame, and look-back period on the main display.
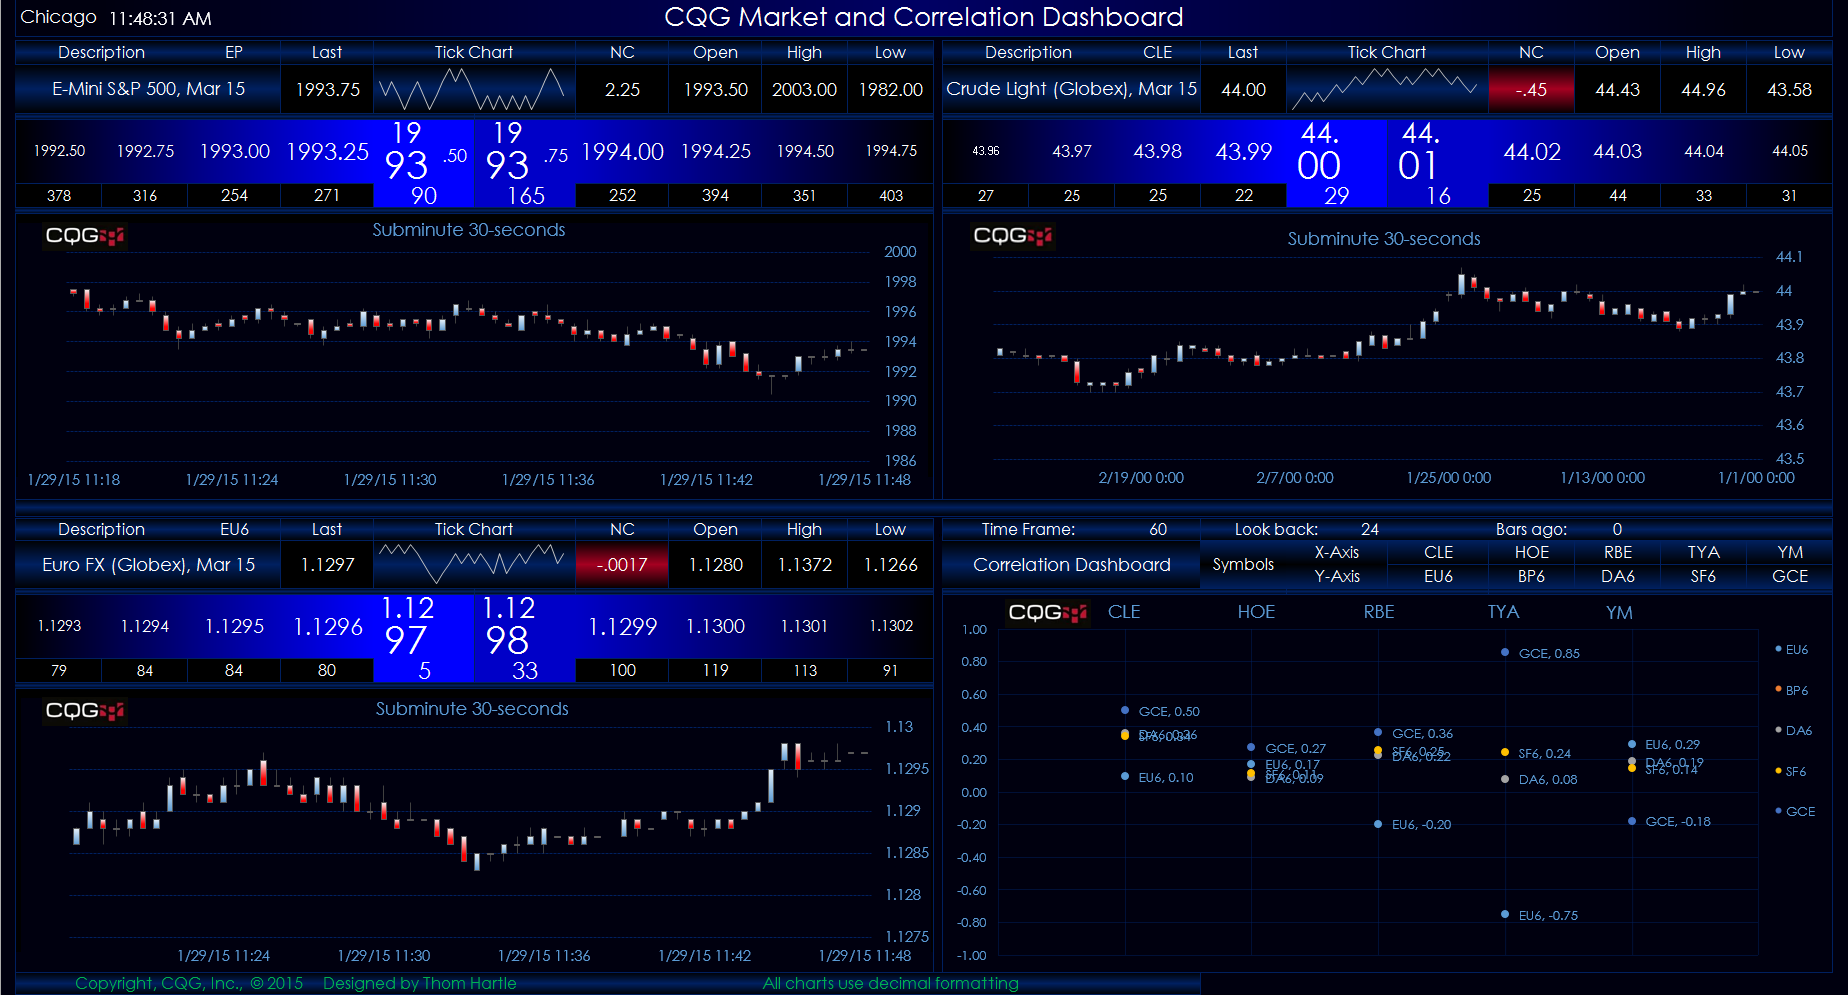
For the DOM and charts display, there is a tab where you enter the symbols and set the number of decimals. You can format the look of the best bid and best ask with the FX style. Instructions are included on the tab.
For the best display, it is recommended that you turn off the Excel Ribbon, formula bar, and headings.
Please review this document on higher time frames using continuation charts: http://help.cqg.com/cqgic/15/#!Documents/enteringsymbolswithc3.htm.
Requires CQG Integrated Client or CQG QTrader, data enablements for all symbols displayed in this spreadsheet, and Excel 2010 or more recent.