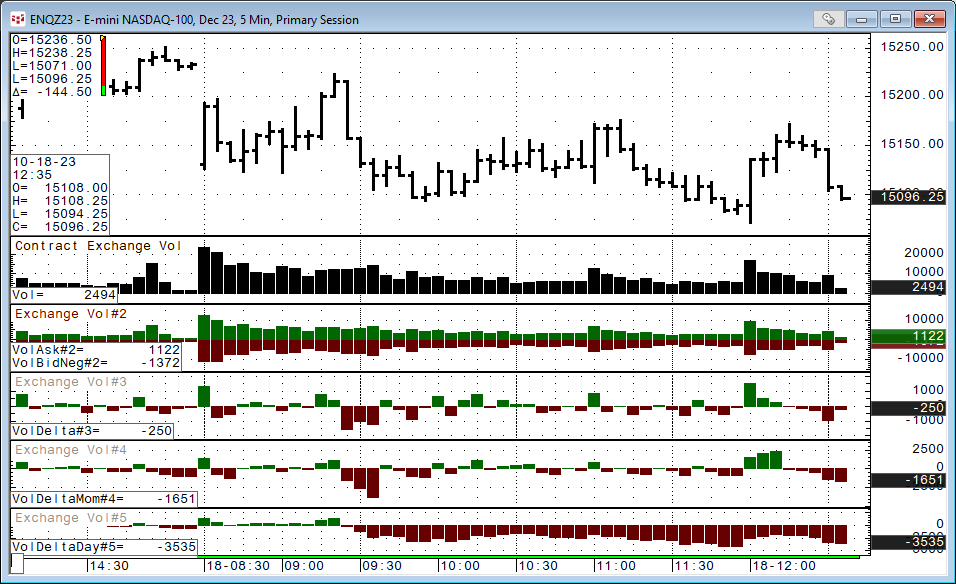
There are a number of volume-based studies available to customers using CQG IC or QTrader. This post walks you through the basic details of the various studies, then correlation analysis is… more
Workspaces
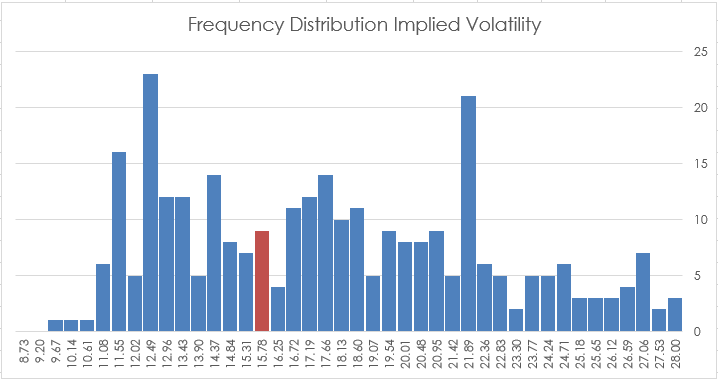
CQG IC and QTrader offer two studies that track volatility: Implied Volatility and Historical Volatility. This post details each study and provides an Excel spreadsheet for tracking the two.
… more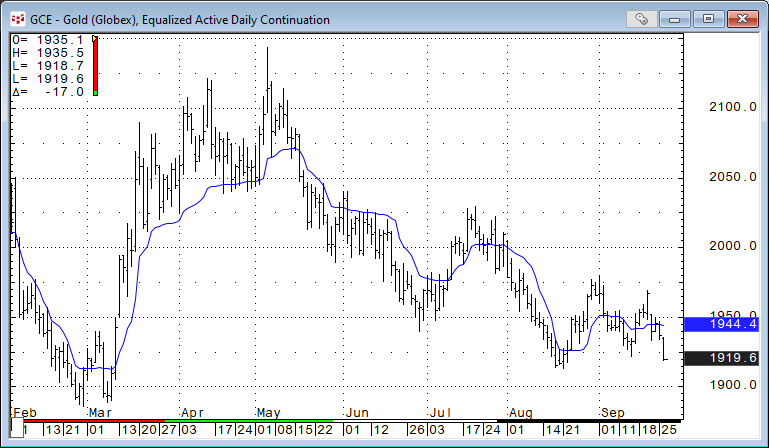
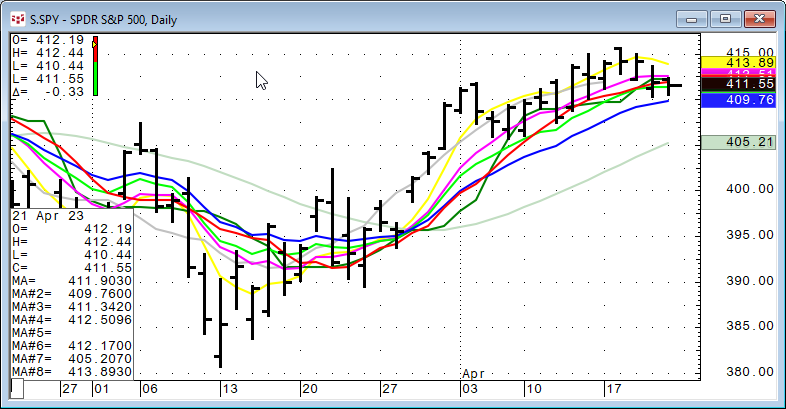
The Adaptive Moving Average (AMA) was developed by American quantitative financial analyst and author Perry J. Kaufman. The AMA study is like the exponential moving average (EMA), except the AMA… more
Technical analysts and technical based traders apply various studies to price data, such as a moving average, to smooth the price action. The goal is to filter the moment-to-moment price action,… more

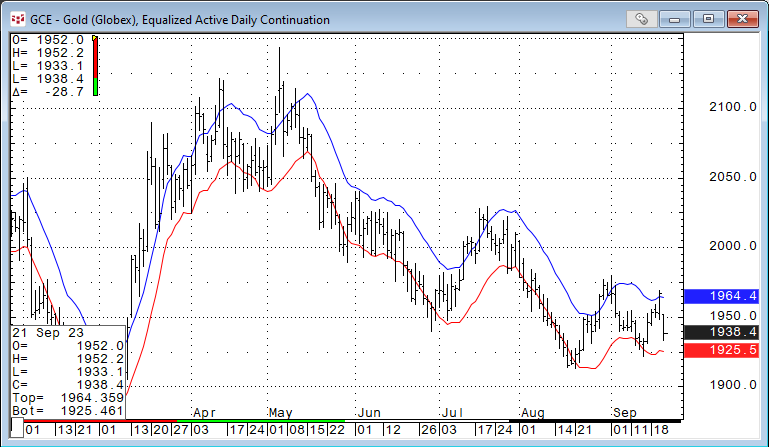
Bollinger Bands are included in a group of studies that display price bands surrounding the trading activity.
Here is a list of the group of studies available in CQG:
Bollinger… more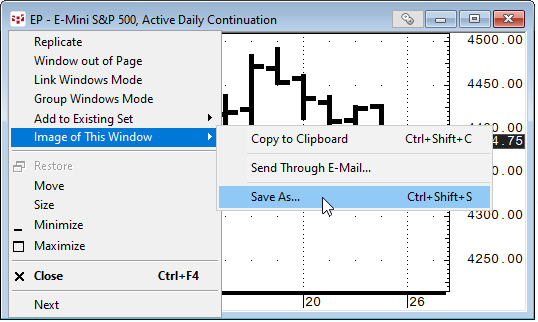
If you are an analyst, blogger, or simply want to post a screen capture of an IC or QTrader chart on social media then the steps to copying a screen capture to your clipboard are very easy.
… more
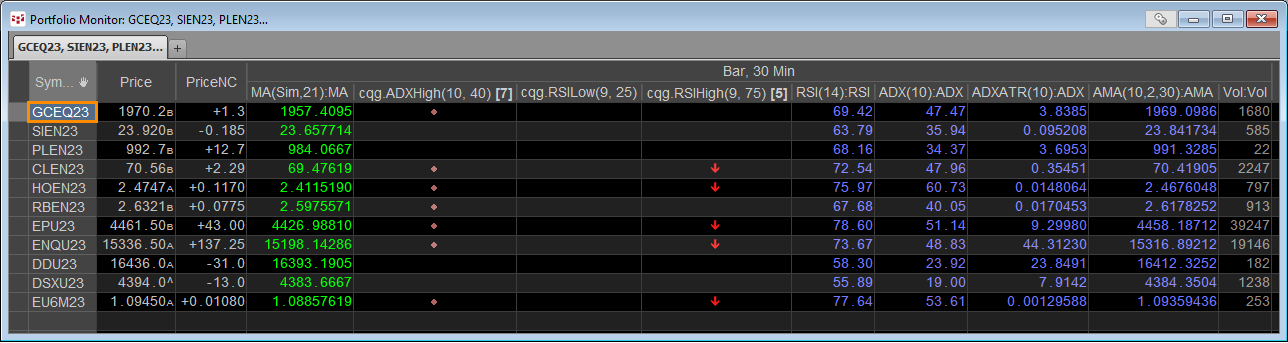
The Portfolio monitor is a combination market quotes and study values display. In addition, the Portfolio monitor can display the status of conditions, such as a study has hit an overbought level… more
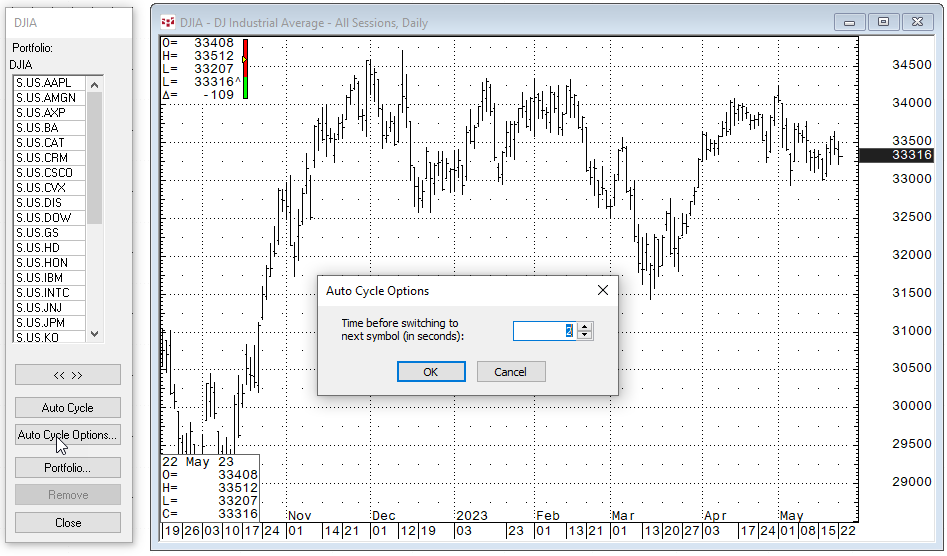
CQG IC and QTrader have a portfolio manager that enables you to create a portfolio of instruments. Once a portfolio is created a common use is for CQG IC users to run a Market Scan testing various… more
CQG products such as CQG IC, QTrader and CQG One come with a collection of price-based studies which can be applied to charts to facilitate analysis. This post offers insight into the collection… more