There are a number of volume-based studies available to customers using CQG IC or QTrader. This post walks you through the basic details of the various studies, then correlation analysis is applied to the collection of studies for further insights.
Volume (Vol)
The first study is the basic volume study. This study applied to a chart presents, using a histogram bar format, the total executed Actual Volume or tick volume for each price bar.
Actual Volume represents the total number of contacts, shares, or lots traded during the selected chart interval.
Tick Volume represents the number of inside price changes, i.e., the count of how many times the last price has changed during the selected chart interval.
You can set the histogram bars to display actual volume of total trades, or the histogram bars can be set to display the volume separated as executed volume at the bids and asks.
The Auto Volume parameter sets the system to automatically switch from tick volume to actual volume when actual volume is available.
The following list are the choices for the display parameters available for volume data:
- Total Trades
- Bids/Asks (separate histograms)
In addition, there are three extra display parameters available for volume data:
- Delta is the difference between bid volume and ask volume
- Delta Momentum is the accumulation of previous deltas
- Delta Day is the net order flow for the day
More information is available from the Help file.
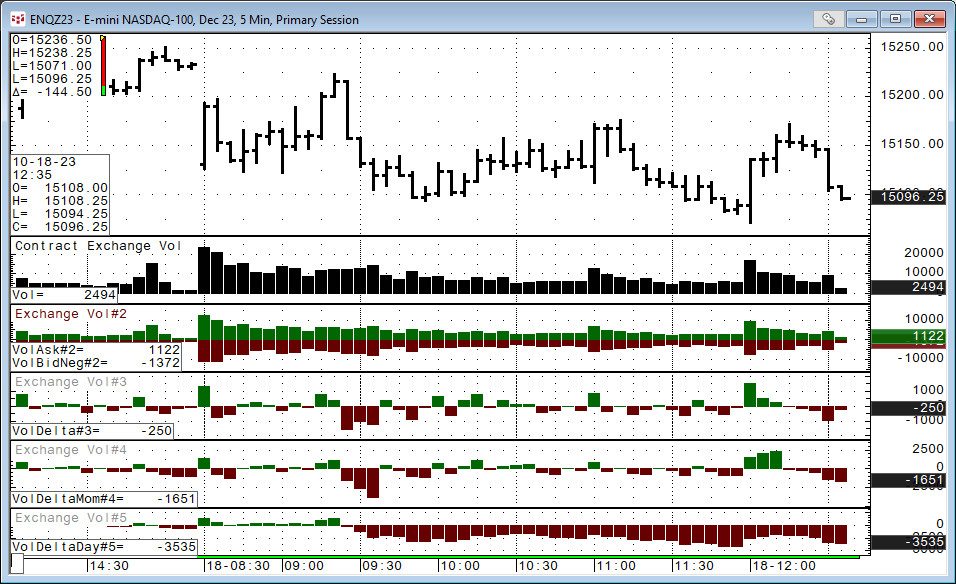
The image above presents the Total Traded volume, Traded Bids/Asks volume (separate histograms), Delta Volume, Delta Momentum, and Delta Day studies.
On Balance Volume (OBV)
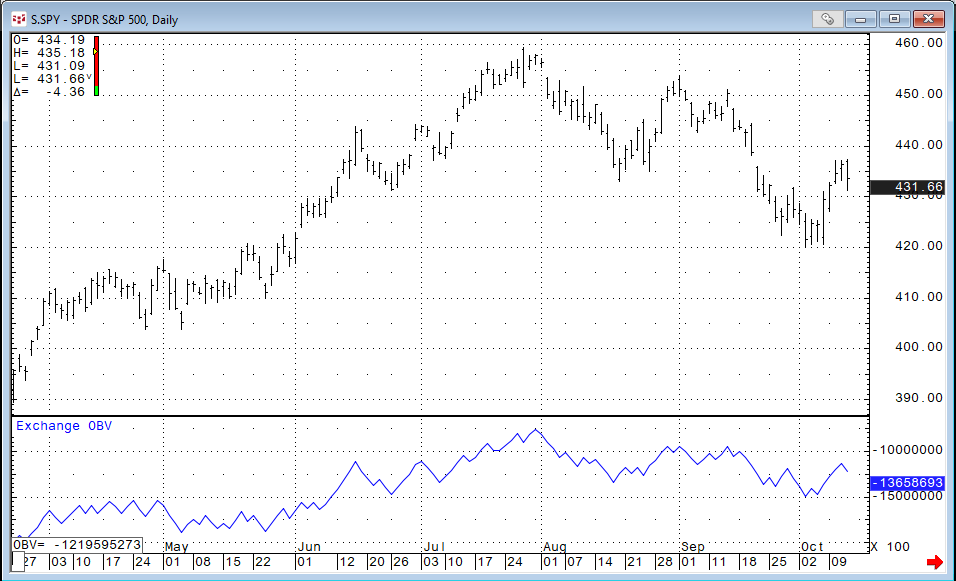
On Balance Volume (OBV) was developed by financial writer and investment seminar speaker Joe Granville. The On Balance Volume line plots the cumulative total of exchange volume or tick volume if exchange volume is unavailable.
OBV is a measure of accumulation/distribution. Upward sloping OBV lines are typically seen in uptrends. Divergences between the price action and the OBV line at tops and bottoms may indicate a reversal.
The calculation is:
- If the current close is greater than the previous close, the current bar's volume is added to the cumulative total.
- If the current close is less than the previous close, the current bar's volume is subtracted from the cumulative total.
- If the current close is equal to the previous close, the value for the OBV is unchanged.
More information is available from the Help file.
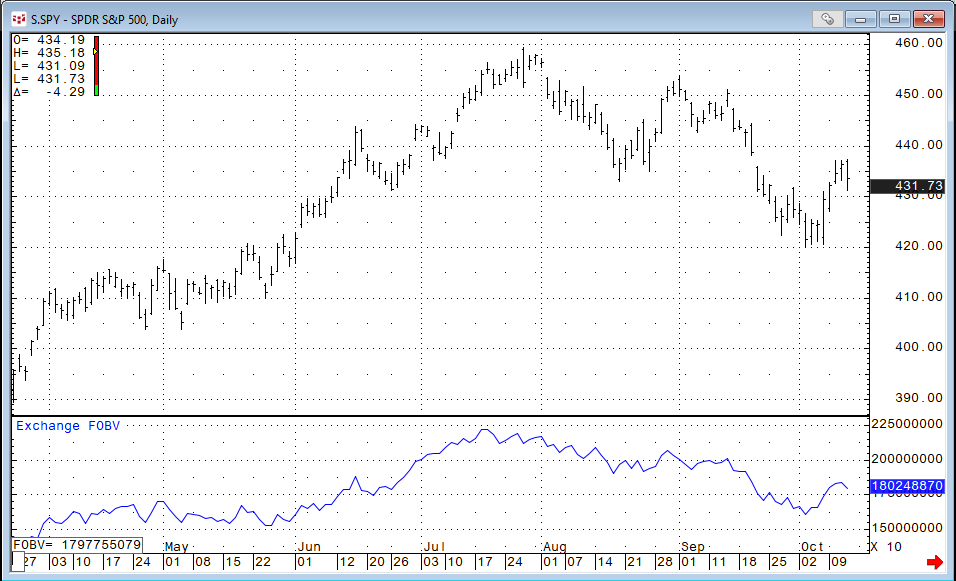
Fancy On Balance Volume (FOBV)
Fancy On Balance Volume is an On Balance Volume calculation where actual volume or tick volume is divided into buying and selling activity.
The Total Selling volume is subtracted from the Total Buying volume, and the difference is then added to a cumulative total. This may provide a more accurate value over the traditional On Balance Volume calculation.
The division of the volume is determined by the following ranges. The "points" for this example are from the sample bar below:
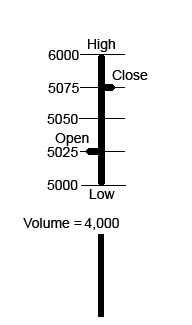
For this hypothetical example: Assume that Actual Volume = 4,000 contracts.
Open - High (Buying) = 75 points
Open - Low (Selling) = 25 points
High - Close (Selling) = 25 points
Low - Close (Buying) = 75 points
Total Buying = 150 points out of 200, or 75%
Total Selling = 50 points out of 200, or 25%
Total Buying - Total Selling = 100 points out of 200, or 50%
The volume distribution formula can be simplified = (close - open)/(high - low): (5075 – 5025)/6000 – 5000) = 50%
50% of the actual volume which is 50% of 4,000 would be added to the cumulative total, therefore, the FOBV would increase by 2000.
More information is available from the Help file.
Volume-Weighted Average Price (VWAP)
VWAP is the volume-weighted average price for a futures contract plotted as a line on the price chart. The calculation is the sum of traded volume times the price divided by the sum of the traded volume.
This study has several uses. It provides the current volume weighted average price for the trading day or the trading session. Traders can compare the current price to the VWAP. In addition, the VWAP can be calculated using a set look back period and smooth the price data similar to a standard moving average.
VWAP = (Sum of traded volume*price)/ (Sum of the traded volume)
The default calculation uses the mid-bar price, but the user can use the close of the bar price.
More information is available from the Help file.
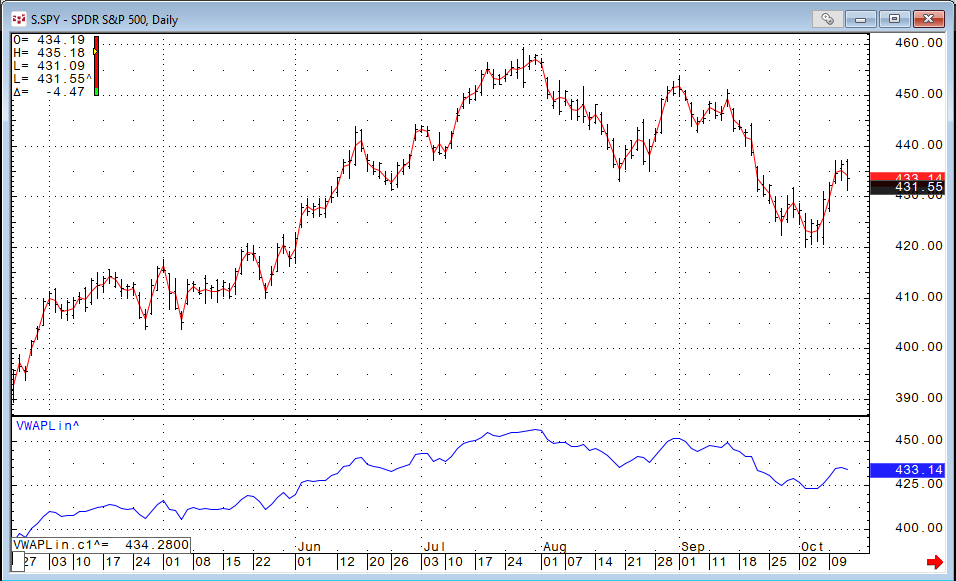
In the above image the VWAP study is displayed as an overlay (default) on the price bars. A custom study version was displayed in a separate study window,
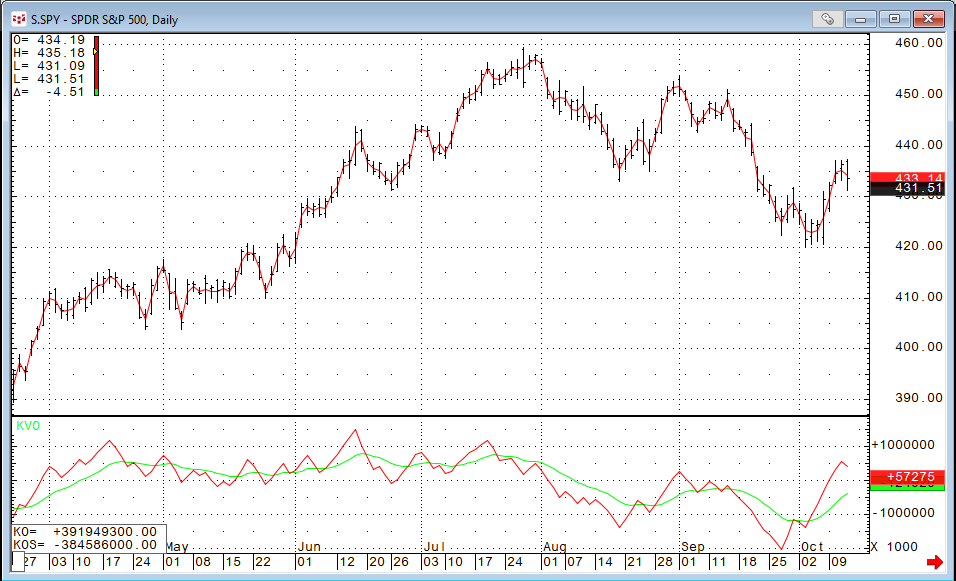
Klinger Volume Oscillator (KVO)
The Klinger Volume Oscillator was developed by Stephen Klinger, CMT. The study uses the difference between two exponential smoothed moving averages of the “Volume Force” and includes a signal line.
KVO Formula
Key Price current bar = (High current bar + Low current bar + Close current bar)/3
Key Price previous bar = (High previous bar + Low previous bar + Close previous bar)/3
Volume Force = VF = (if Key Price current bar > Key Price previous bar then VF = Volume otherwise VF = -1*Volume)
KVO = EMA short period (VF)− EMA long period (VF)
Klinger Oscillator Signal line = KOS = 13 Period EMA of KVO
The basic application is if the KVO crosses above the KOS then the trend is up. If the KVO crosses below the KOS, then the trend is down.
More information is available from the Help file.
Correlation Analysis
One question regarding the four studies just discussed is their similar behavior by the studies. Here, is the list of the four studies:
- On Balance Volume (OBV)
- Fancy On Balance Volume (FOBV)
- Volume-Weighted Average Price (VWAP)
- Klinger Volume Oscillator (KVO)
This chart below shows all four studies, and the displays do look similar.
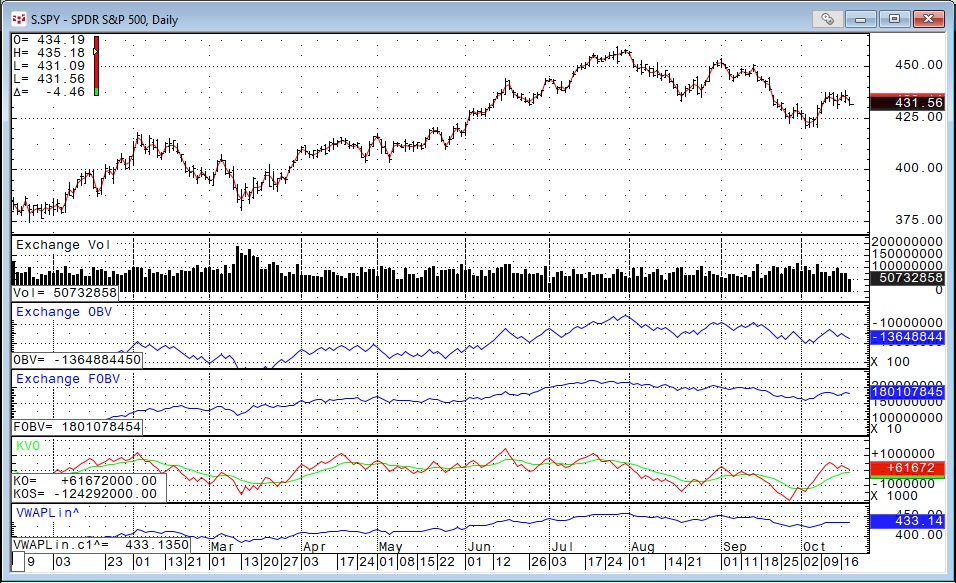
To gain insight into just how similar the studies are, a 10-bar rolling correlation for 220 daily bars was done for each study using the OBV study as the base for comparison.
Then, once the correlation analysis was completed a Frequency Distribution of the correlations was performed.
This analysis breaks down the correlations ranging from +1 to -1 into 40 bins. Then, there is a count of how many times a correlation value fell into each bin.
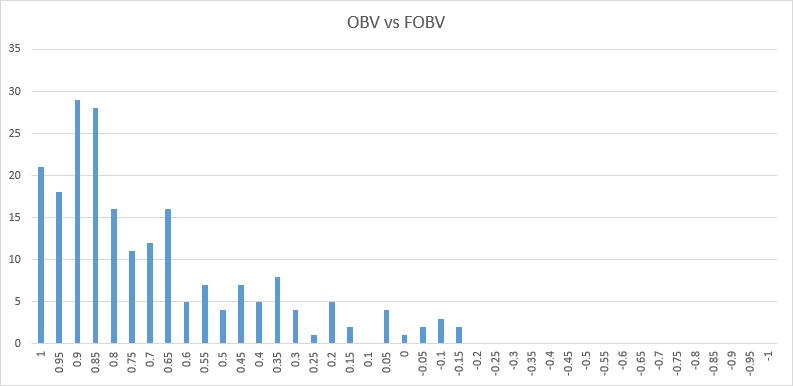
Looking at the correlation count for the OBV versus the FOBV the total amount of observed correlations greater than 0.80 is 112 or 51%.
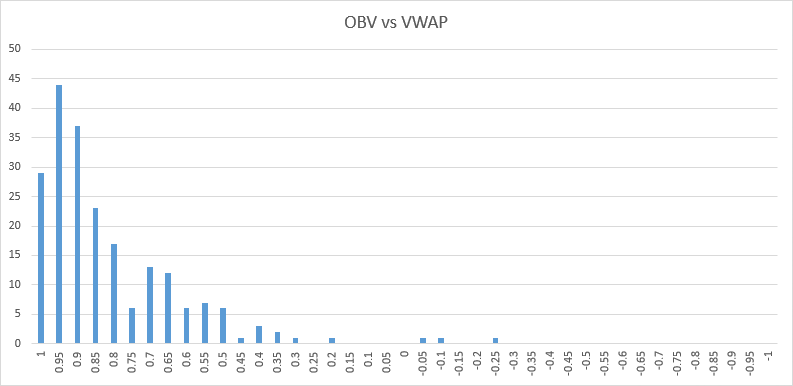
Looking at the correlation count for the OBV versus the VWAP the total amount of observed correlations greater than 0.80 is 150 or 68%.
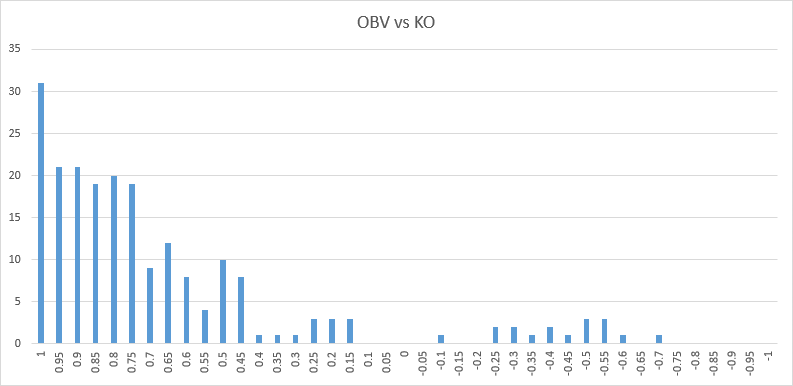
Looking at the correlation count for the OBV versus the KO the total amount of observed correlations greater than 0.80 is also 112 or 51%. Interestingly this comparing had the highest count for correlations greater than 0.95.
One last volume-based study to review is the Volume Profile study.
Volume Profile (VP)
Volume Profile is only available to users of CQG IC.
The Volume Profile study displays either:
- Volume distribution (Total Volume)
- Bid and ask distribution (Bid/Ask)
- Distribution of difference between bids and asks (Bid/Ask Delta)
The distribution type is selected using Highlight preferences.
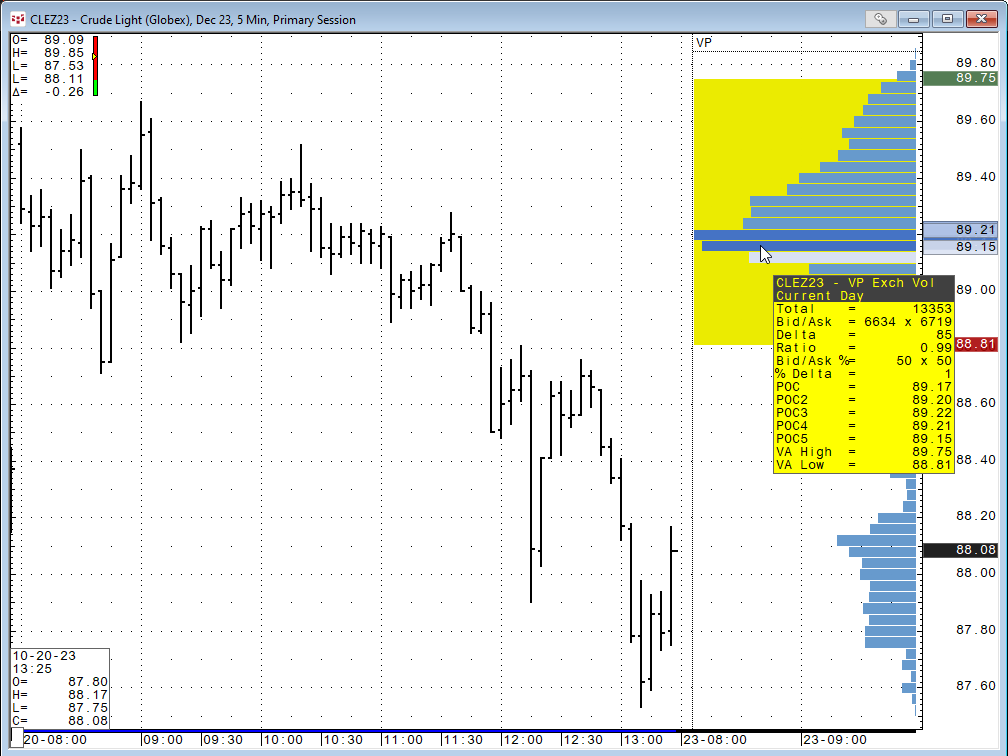
Hovering the mouse over the display opens a tooltip with comprehensive volume data:
- Total volume
- Bid and ask volume
- Delta = difference between bid and ask volumes
- Ratio = ratio between bid and ask volumes (shows two digits after decimal)
- Bid/Ask % = Bid Volume/Total Volume * 100 x Ask Volume/Total Volume * 100
- % Delta = (Ask Volume - Bid Volume) / Total Volume * 100
If you have overlapping volume profiles on the chart, hovering the mouse over the profile exposes all values.
Contact CQG to be enabled for this study.
More information is available from the Help file.