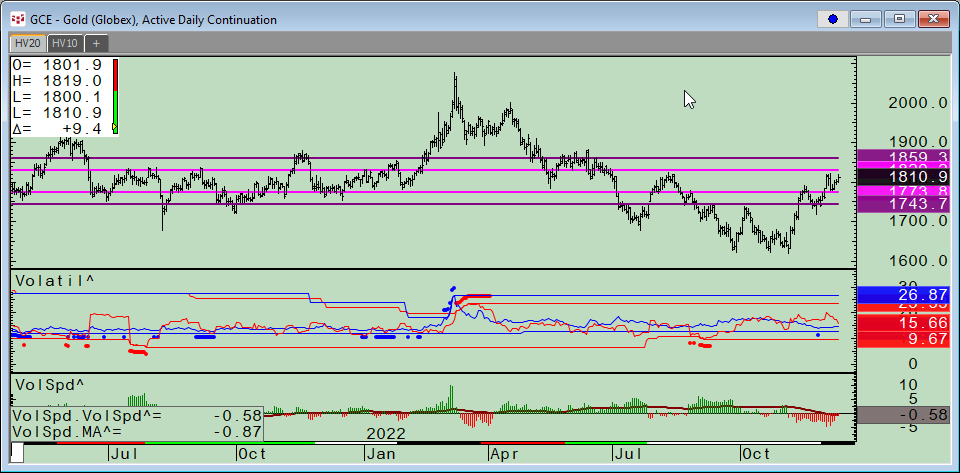
CQG Product Specialist Stan Yabroff designed a CQG page for customers to track and analyze a market’s implied volatility and historical volatility. This post details the features and functionality… more
Workspaces
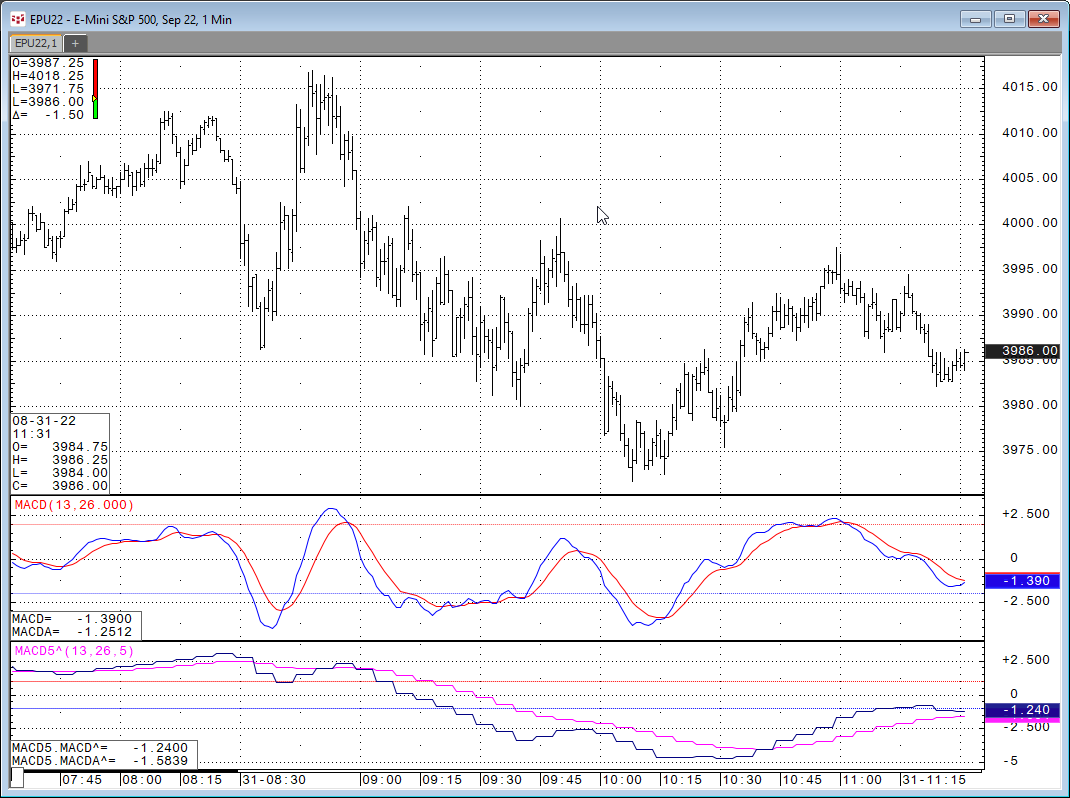
Let's say you want to look at a study on a chart but you want the study to use a different time frame than the time frame for the bars. For example, the MACD Study on a 1-minute chart using 5-… more
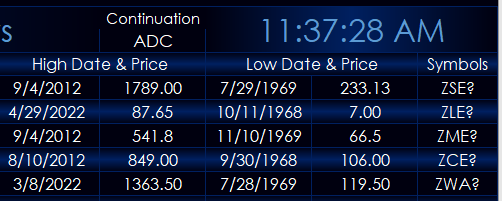
This post details a custom CQG study for pulling a market’s all time high price and date and the market’s all time low price and date.
The custom study was built by CQG’s Product Specialist… more
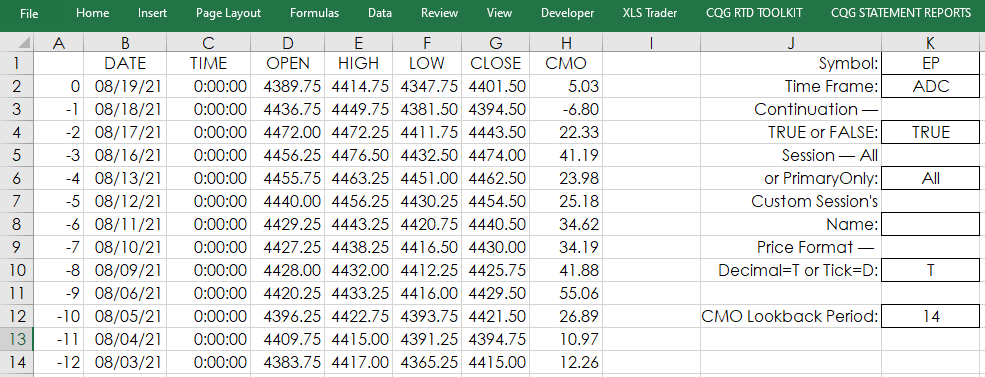
This post builds upon CQG Product Specialist Helmut Mueller's post titled “Most Wanted Seven Studies Plus a Bonus Trading System.” His post provides a PAC with the following studies:
Chande… more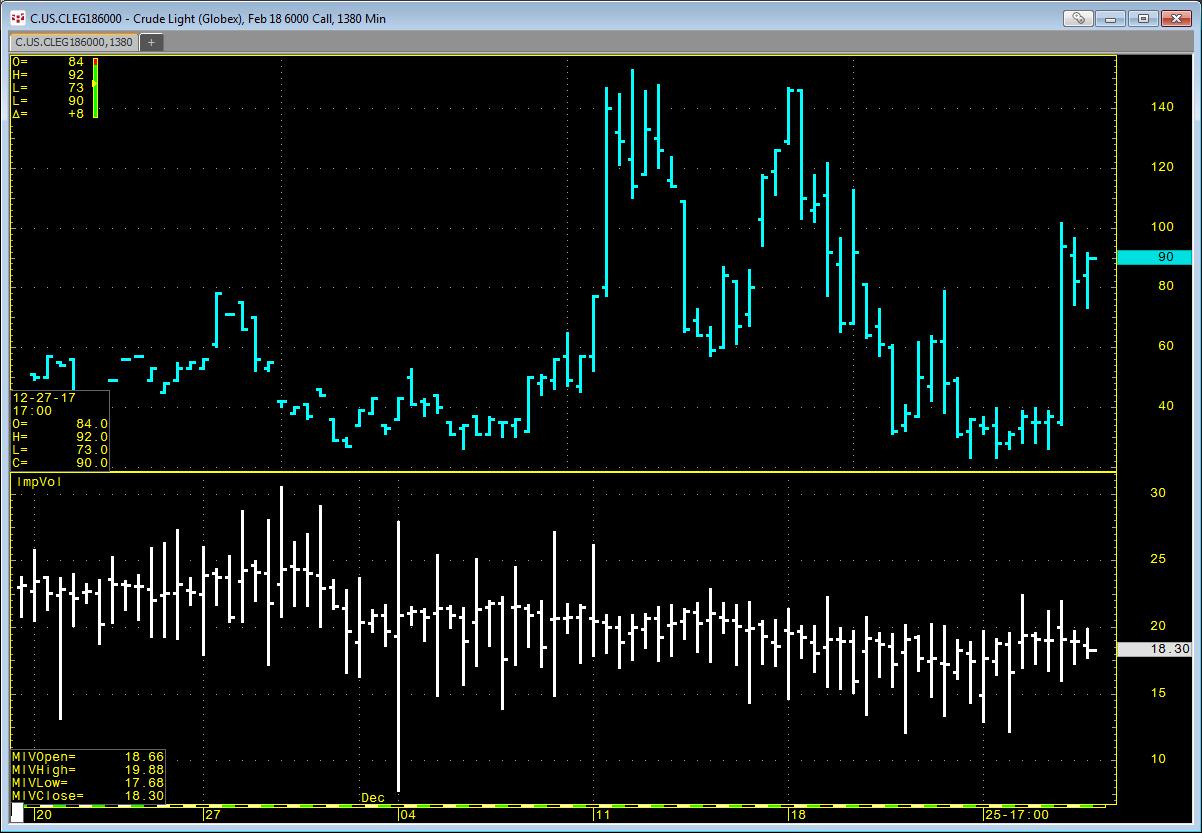
CQG offers an Implied Volatility (ImpVol) study that allows you to pull in historical implied volatility data onto a chart. ImpVol is not the implied volatility of one particular option.… more
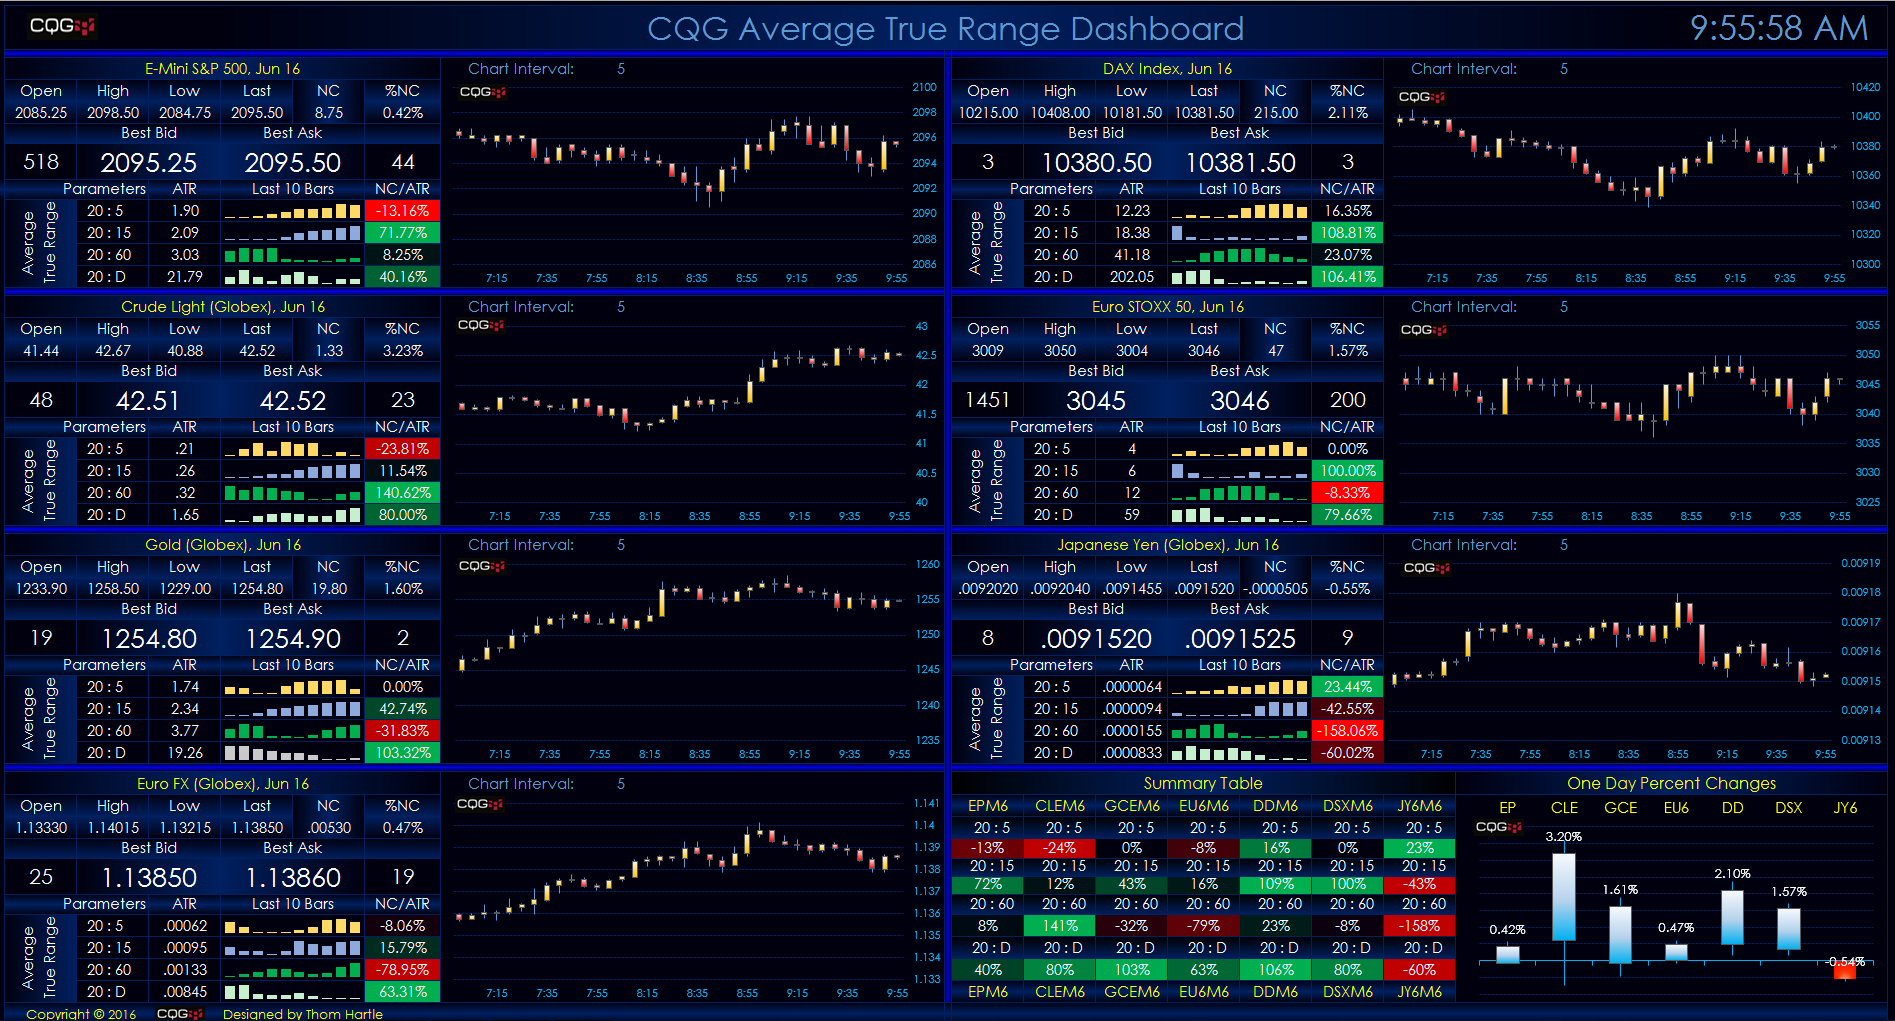
This Microsoft Excel® dashboard tracks four average true range study values for seven markets. On the Parameters tab you can enter the symbol, the number of decimals for prices, and the session… more