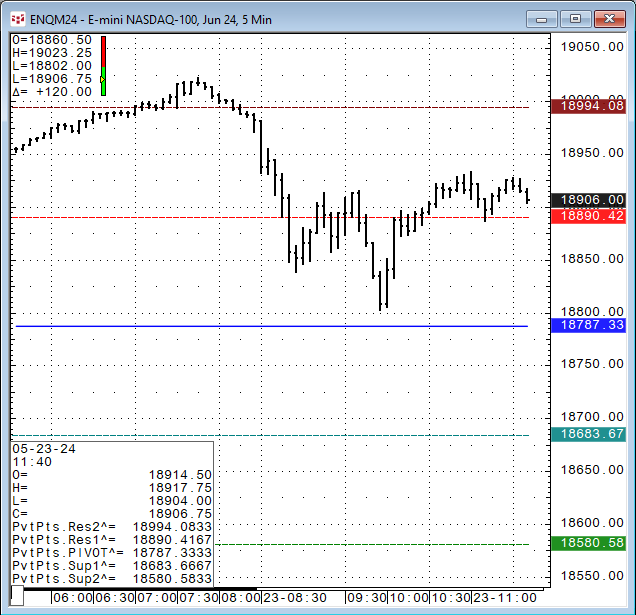
The pivot point is the arithmetic average of the high (H), low (L), and closing (C) prices of the active instrument, Pivot Point = (H+L+C)/3 or Pivot Point = HLC3. The study applied to a chart displays five curves:
- The pivot points.
- Two projected highs.
- Two projected lows.
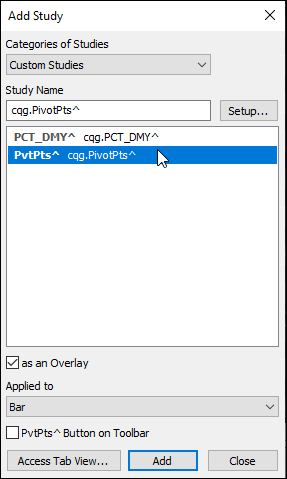
Note that the Overlaid checkbox has been selected so that these curves are plotted over the bars similar to a moving average. It is available from the Custom Studies “Add Study” window.

The ",D" after each term sets the system to use a daily bar for the calculations. This method enables the user to apply daily values to an intraday chart.

Formulas for the curves:
Res2: (HLC3(@),D)[-1] + (Range(@),D)[-1]
Res1: (2 * (HLC3(@),D)[-1]) - (Low(@),D)[-1]
PIVOT: (HLC3(@),D)[-1]
Sup1: (2 * (HLC3(@),D)[-1]) - (High(@),D)[-1]
Sup2: (HLC3(@),D)[-1] - (Range(@),D)[-1]
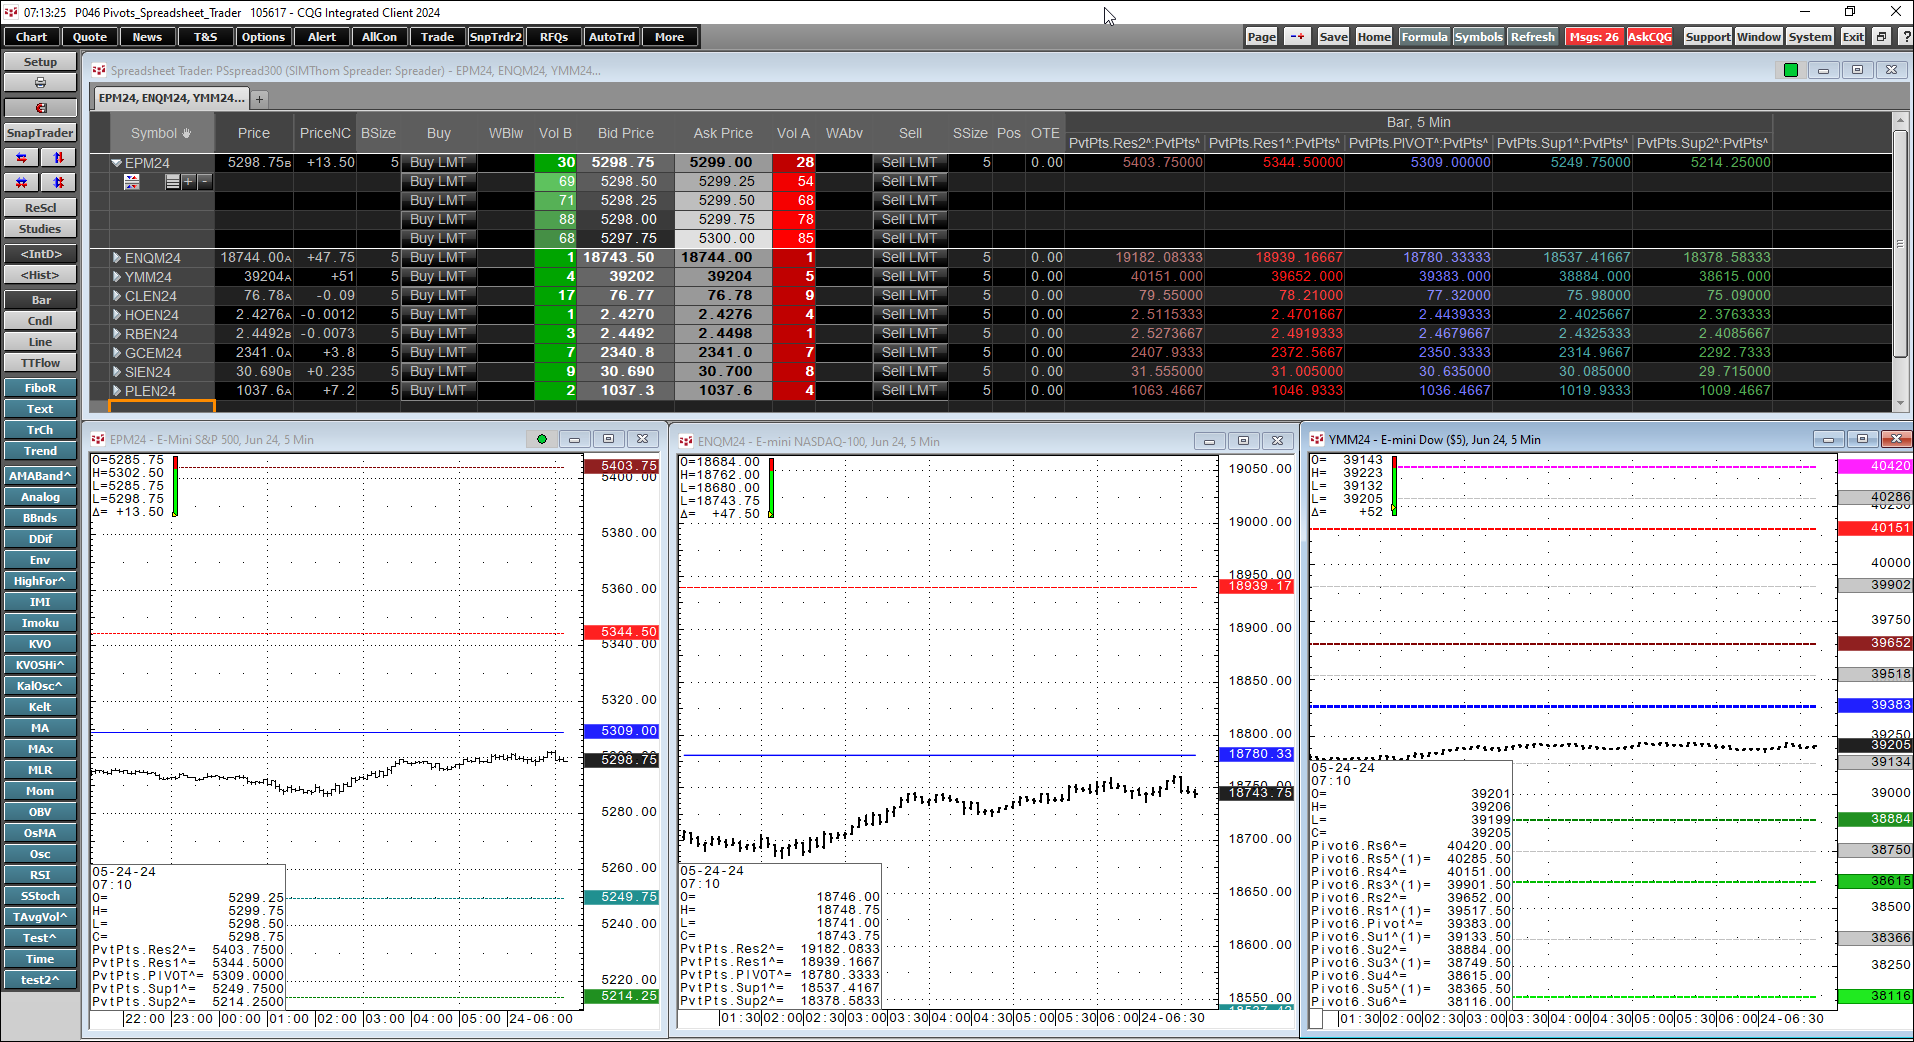
The study values can be displayed in CQG's Spreadsheet Trader.
To add the Pivot Points studies to the Spreadsheet Trader:
- Right-click the study column heading, then click Add Study.
- Select the Pivot Points from the Custom Studies list.
- Click Add.
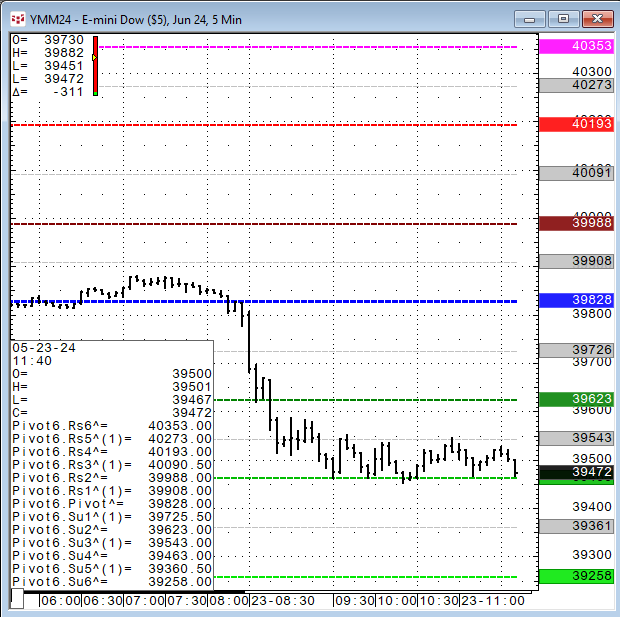
CQG Product Specialist Jim Stavros has created a custom version of the Pivot Points study that displays six support and six resistance lines. The study is named Pivot6 and has halfway pivots that can be displayed as well as a 3rd pivot.

The downloadable CQG PAC at the bottom of the post is a page for CQG that includes the CQG Spreadsheet Trader with the Pivot Points studies, and a linked chart.
In addition, the Stavros custom Pivot Points 6 (Pivot6) study is included.
Requires CQG IC or CQG QTrader.

