United States Department of Agriculture-World Agriculture Supply and Demand Estimates reports are a critical component to gaining insight into both the international and domestic demand and supply… more
Workspaces
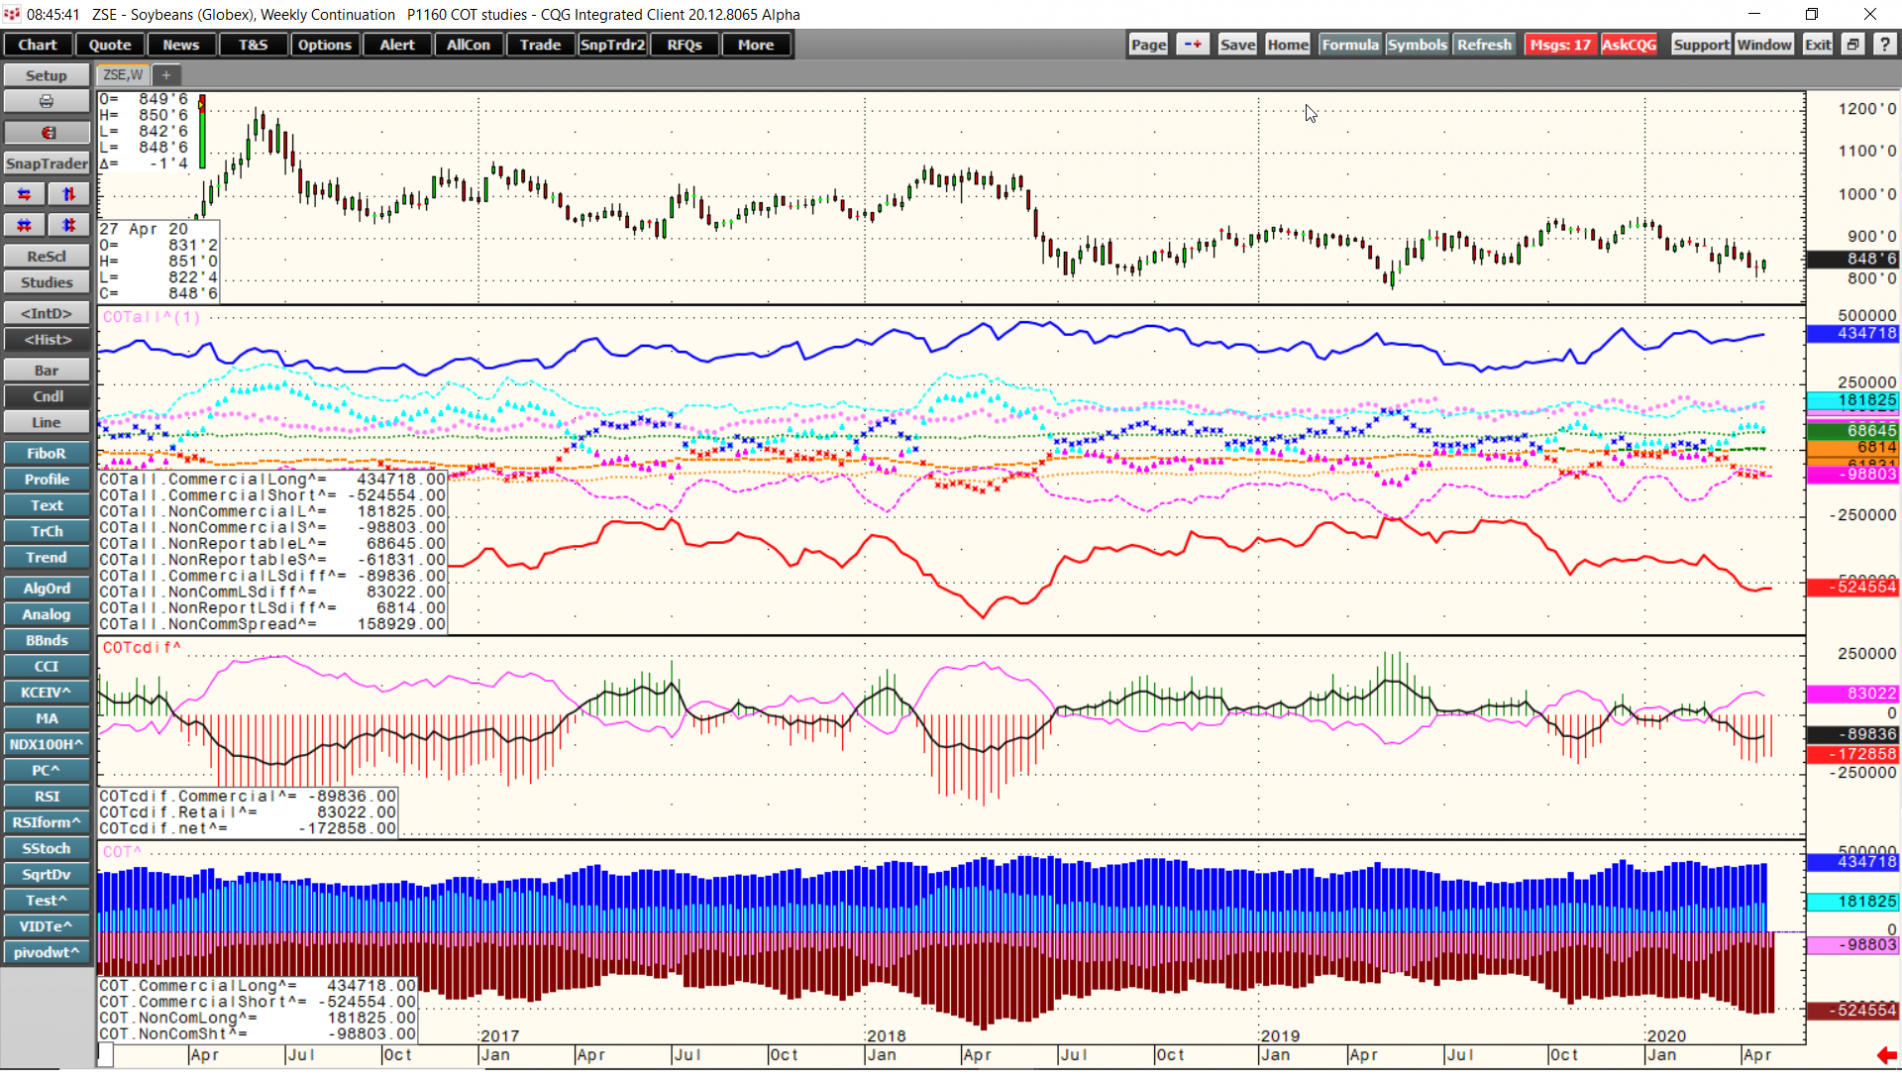
CQG Product Specialist Jim Stavros has created a downloadable CQG PAC that has three new CFTC COT Studies designed to aid in analysis of the COT reports: COTAll, COTcDiff and COT.
COTAll… more
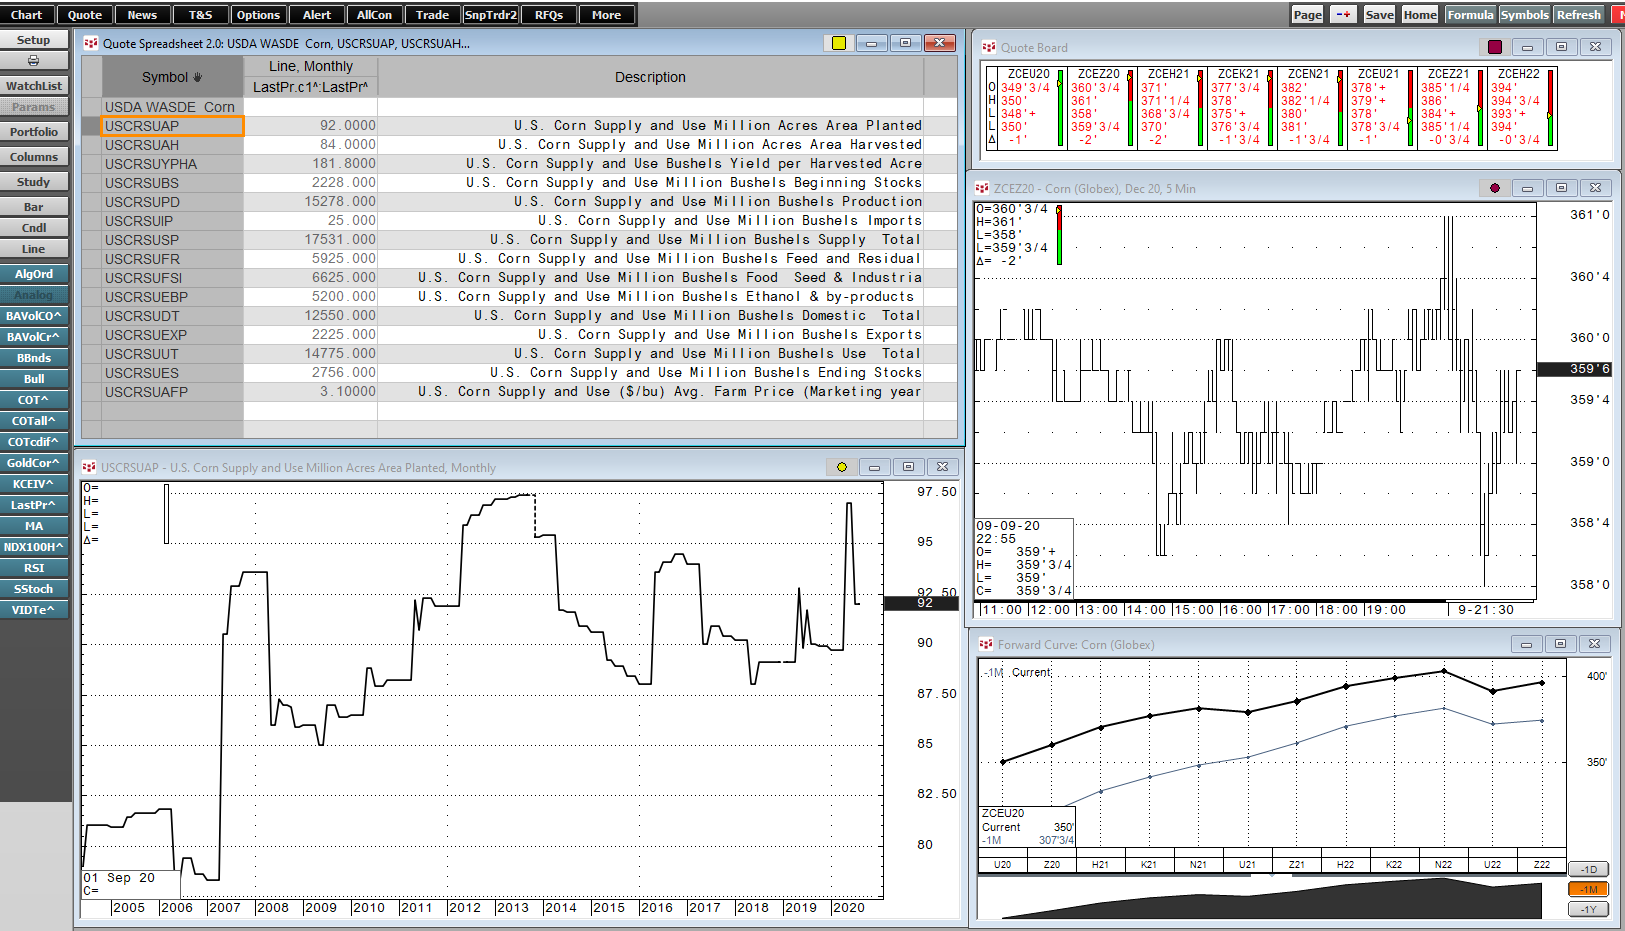
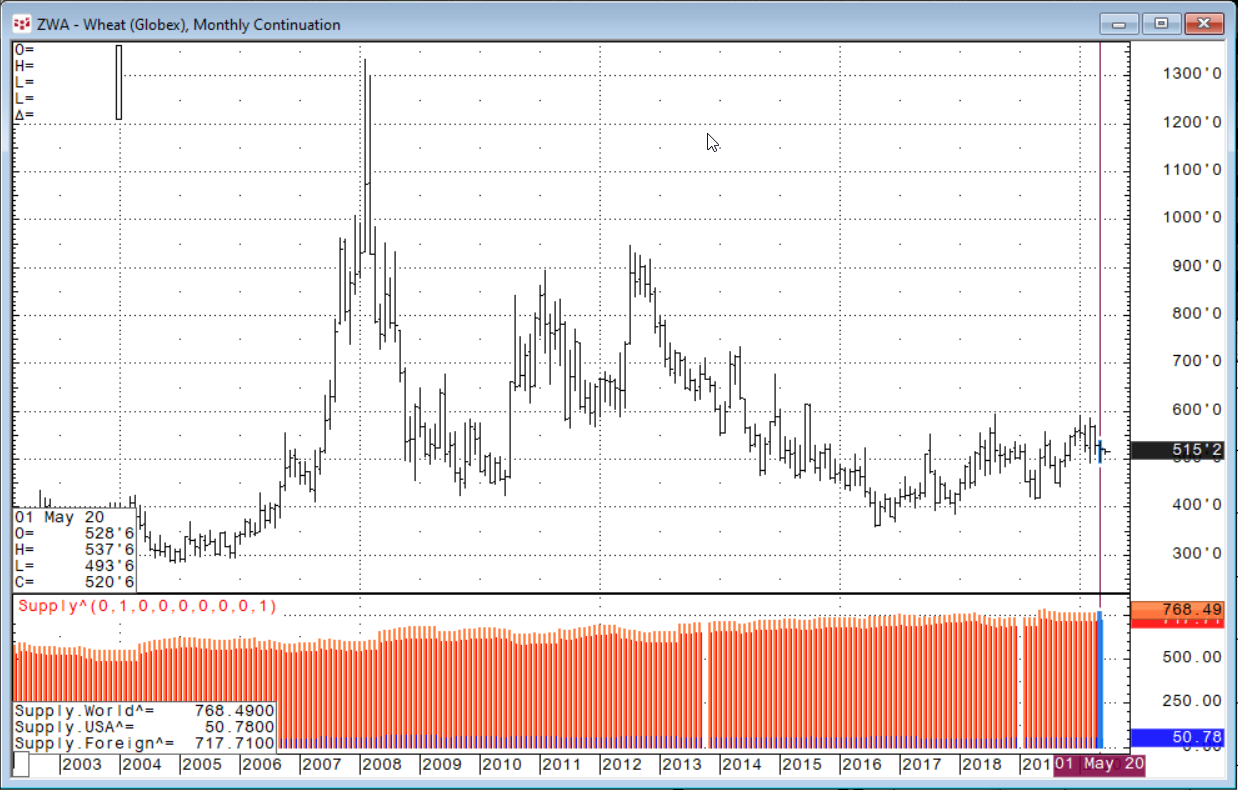
CQG has added the World Agricultural Supply and Demand Estimates (WASDE) data to the data feed. Published monthly by the United States Department of Agriculture (USDA), the World Agricultural… more
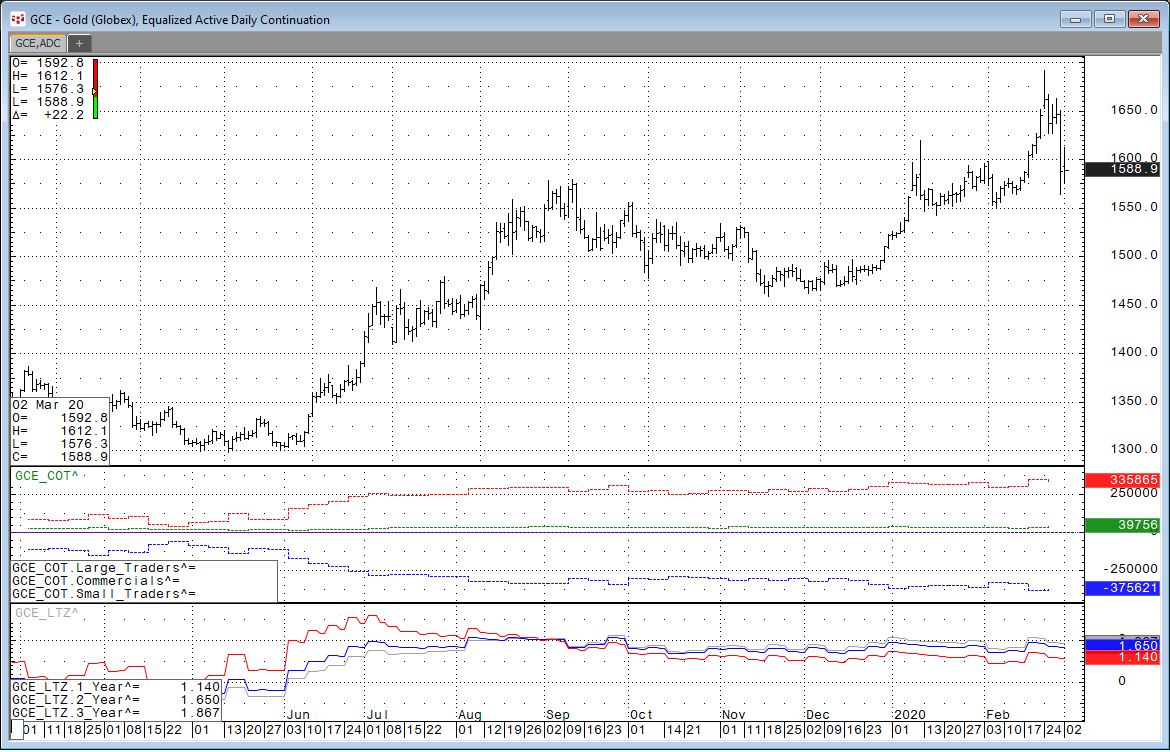
CQG has added the CFTC Commitment of Traders reports to the data feed. Under Exchanges in the CQG Symbol Finder you can find “CFTC Commitment of Traders.”
An easy way to find the… more
Bring Updating Time-Series Data from Microsoft Excel® Into CQG
The XL Real-Time study is included in CQGIC subscriptions enabled for CQG Trading, or Spreader, as well as CQG Spreader systems. The… more
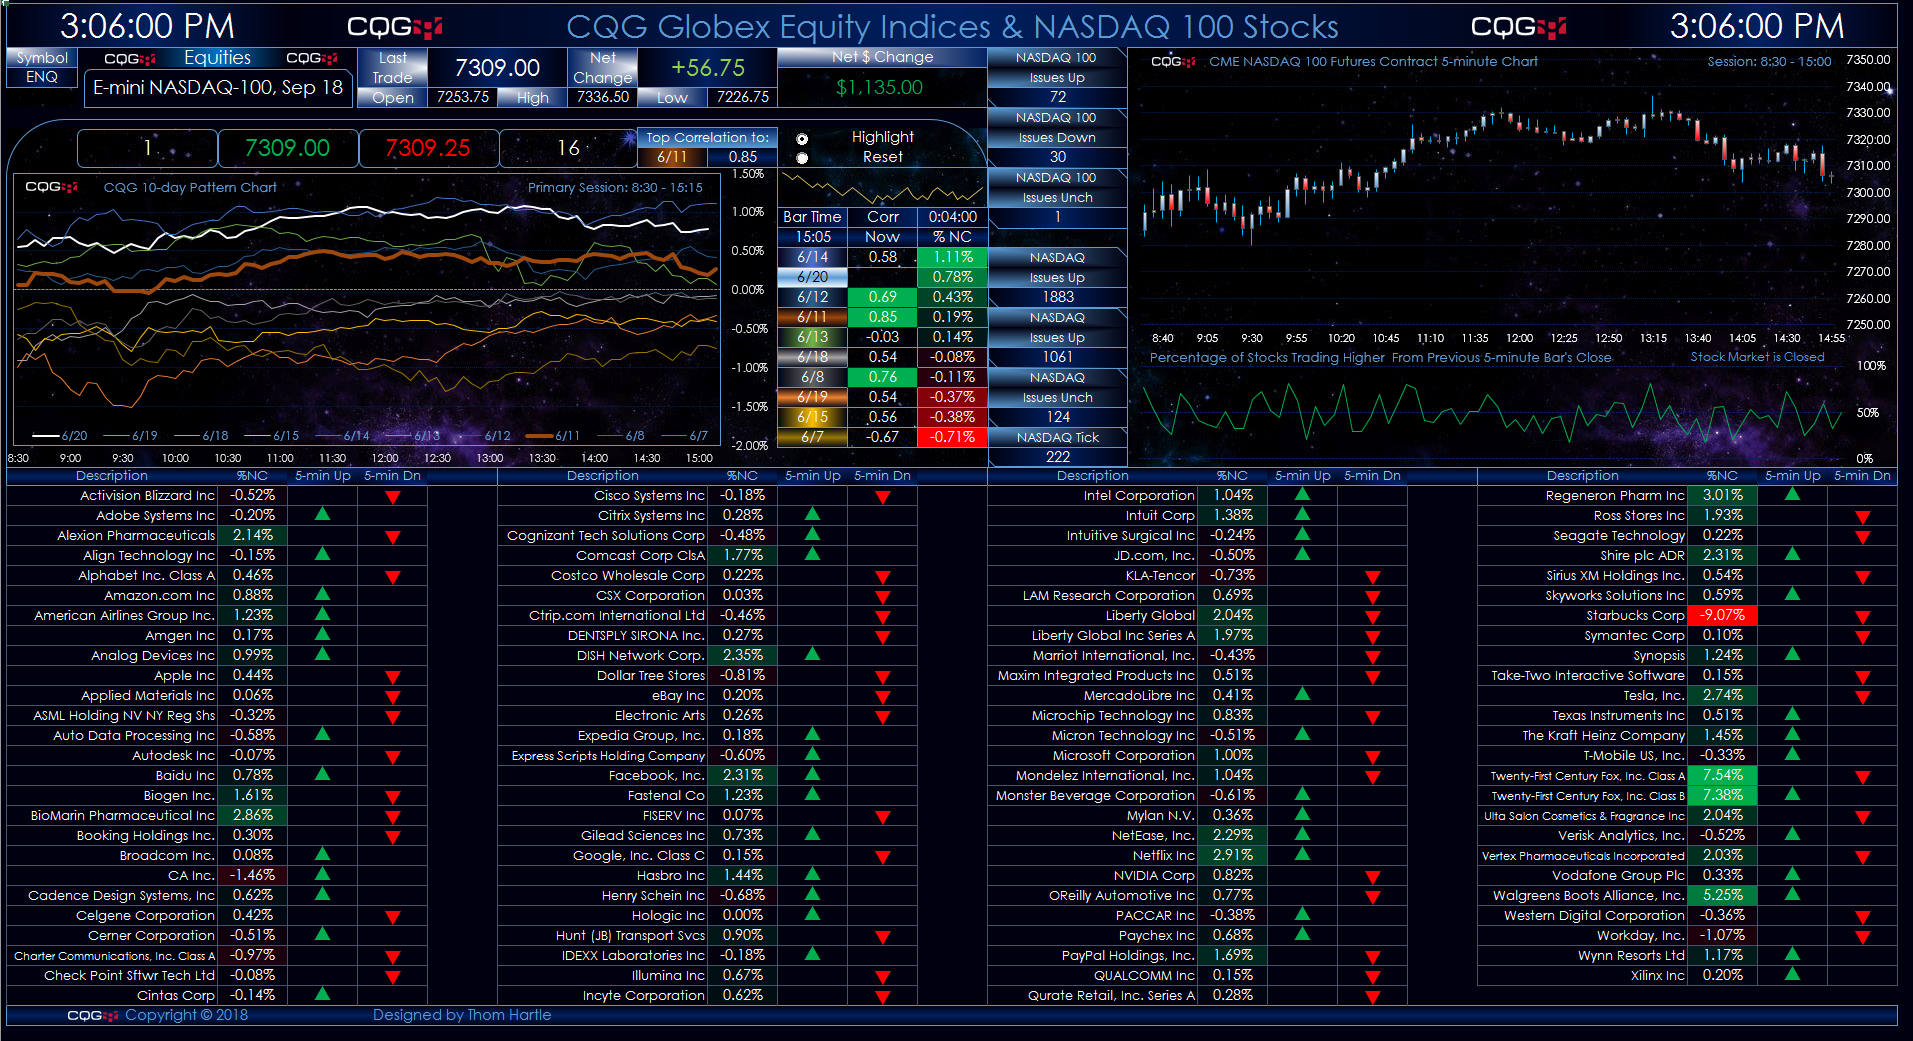
This Microsoft Excel® dashboard presents two charts of the Nasdaq-100 futures contract and market data for the one hundred stocks that are constituents of the Nasdaq 100 Index.
… more
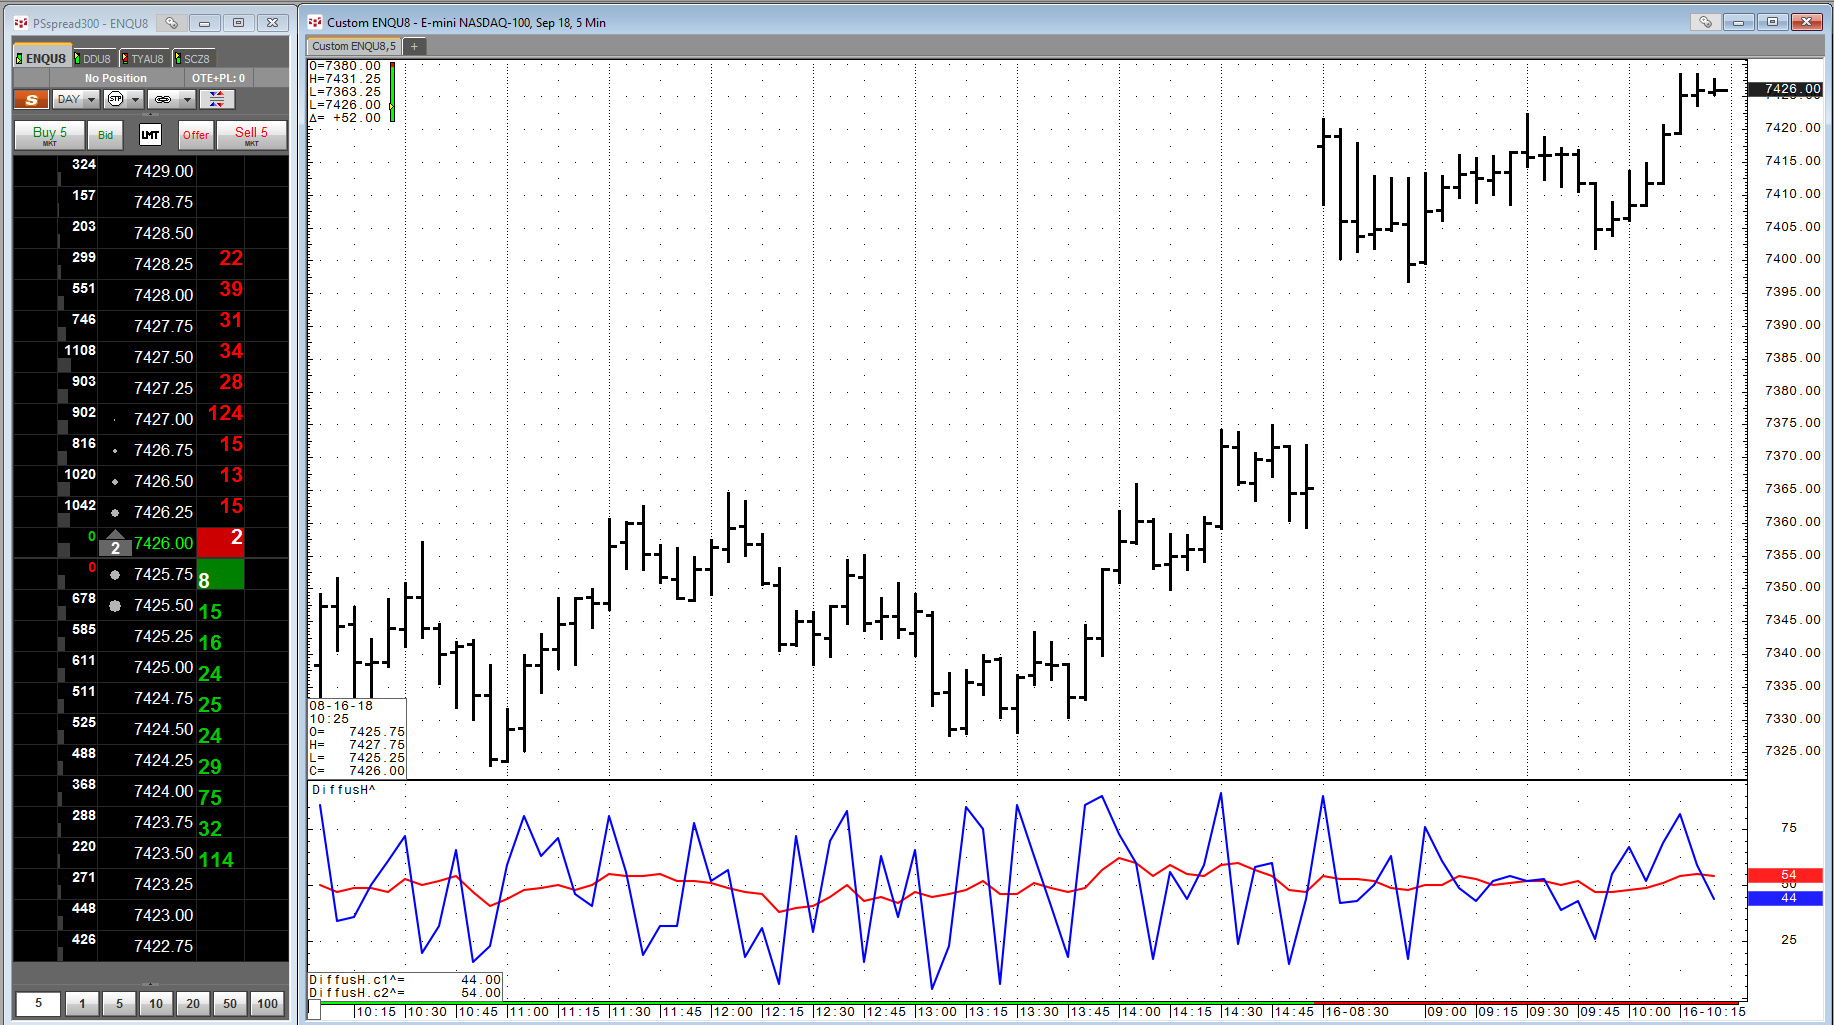
CQG customers who create their own custom studies can easily use RTD to pull custom study values into Excel.
There are only two unique requirements in the RTD formula for a custom study:… more
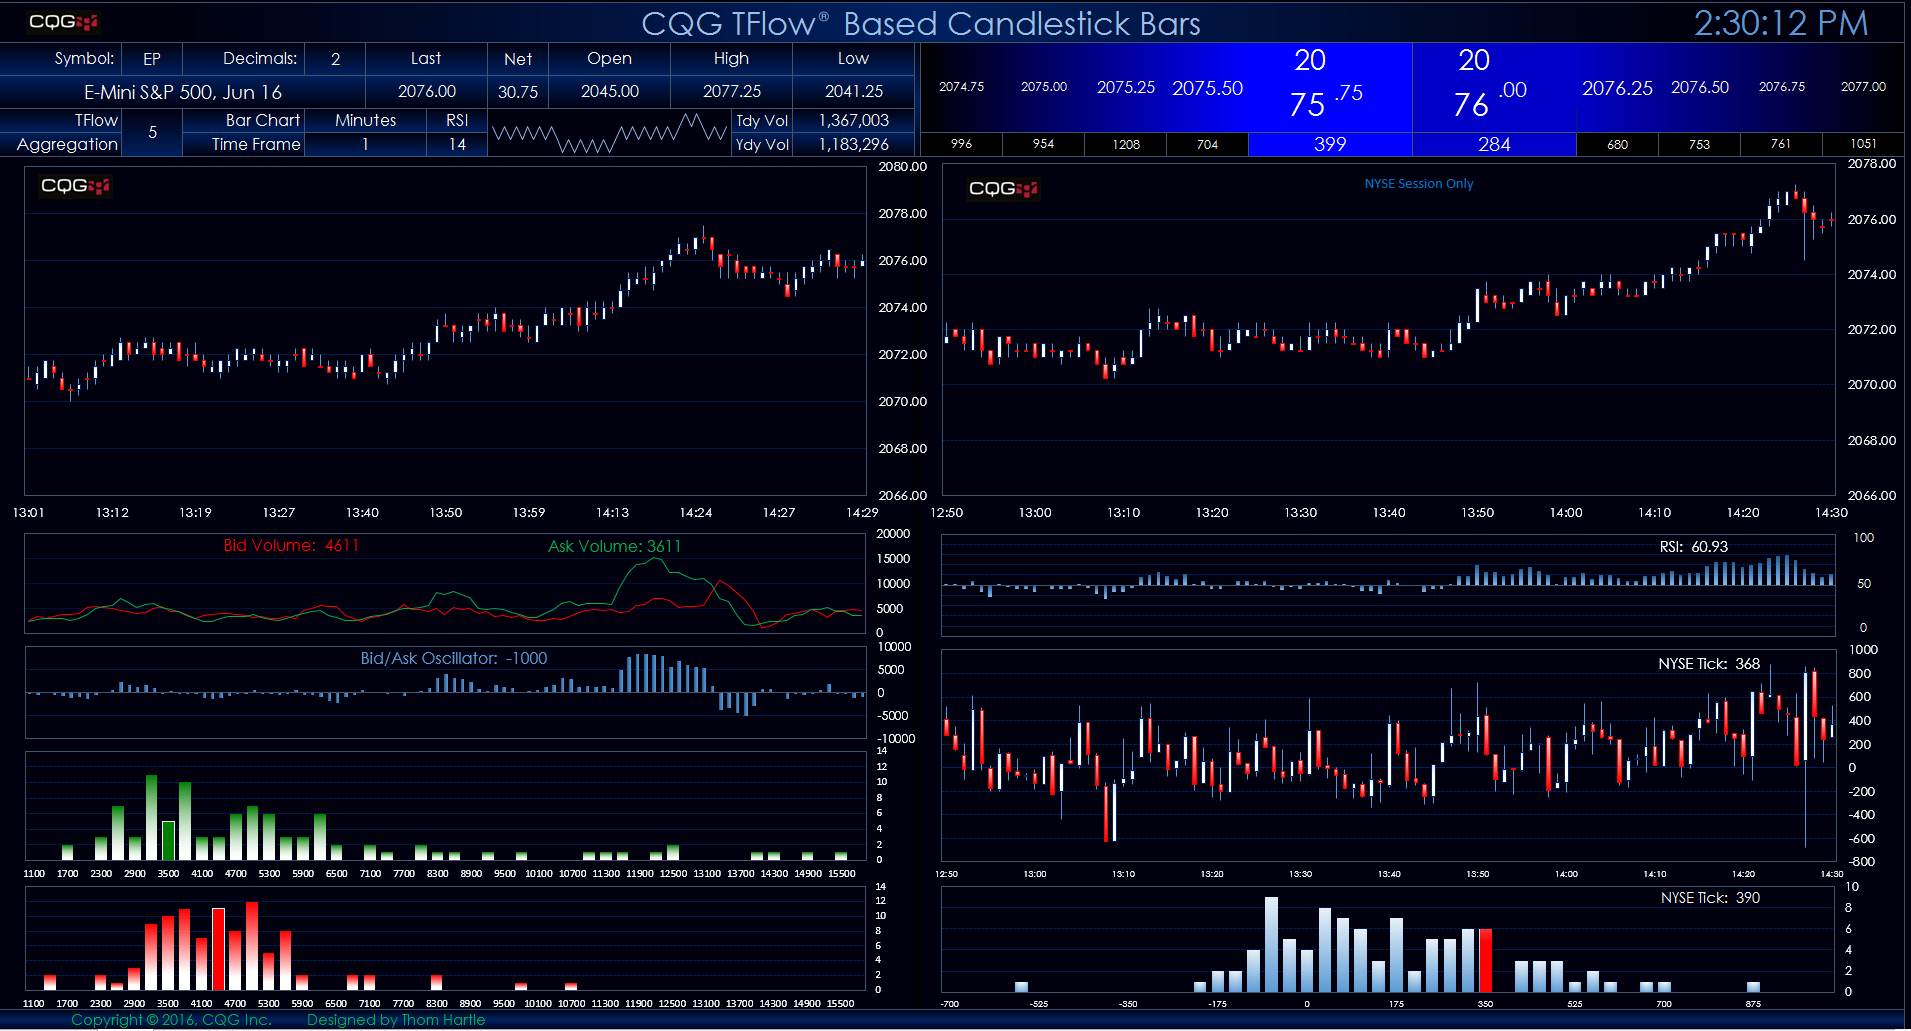
This Microsoft Excel® spreadsheet presents two views of the E-mini S&P contract. The left-hand view displays candlestick bars using CQG’s proprietary TFlow chart data. You can use the… more

Powered by CQG FX, this Microsoft Excel® dashboard measures volatility by using the difference between the upper and lower Bollinger Bands and dividing the difference by the Moving Average. The… more

This Microsoft Excel dashboard measures volatility by using the difference between the upper and lower Bollinger Bands and dividing the difference by the Moving Average. The dashboard then sorts… more