Updated July 24, 2025
Bring Updating Time-Series Data from Microsoft Excel® Into CQG
The XL Real-Time study is included in CQGIC subscriptions enabled for CQG Trading, or Spreader, as well as CQG Spreader systems. The XL Real-Time Study is available to base CQGIC (without trading enabled) and QTrader subscriptions at additional cost. Customers can now build models in Excel and import the model outputs on a real-time basis to CQG for charting, auto trading, and more.
This article details a simple Excel model for monitoring the performance of the stocks that are constituents of the NASDAQ 100 index. Excel does the analysis and CQG constantly pulls the output of the model into CQG, displaying the data as a study on a chart. Stock data is not available to QTrader users.
The Excel sample spreadsheet is available, along with a CQG pac file that contains the chart, the study, as well as the custom session (matches NYSE Trading) for using the study with the E-mini Nasdaq 100 futures contract (Symbol: ENQ).
The Excel model tracks, on a 5-minute basis, the current percentage of stocks that are trading above their respective previous 5-minute bar’s close. The symbols for the stocks in the NASDAQ 100 index are located in the first row in Excel. The lookback bar count for the studies is column A. The RTD calculations are using the Fill Gap bar type in case a less actively traded stock does not have a previous close for the 5-minute bar. The Fill gap chart type will automatically use the last close available. This avoids calculation errors. All of this is hidden, but you can easily expose it by selecting the columns, right-click and select unhide. The XL TS study will pull in the last 100 5-minute bars from Excel.
Below is the ‘IF Then’ Excel formula wrapping an RTD formula used in cell B2. The stock symbol is in cell B1, the current bar’s bar count is in cell A2 and the previous bar’s count is in cell A3. If the current bar’s price is above the previous 5-minute bar’s close then the cell displays “1”.
=IF(RTD("cqg.rtd",,"StudyData",B$1,"FG","","Close","5Min",$A2,"all","","","False","T")-RTD("cqg.rtd",,"StudyData",B$1,"FG","","Close","5Min",$A3,"all","","","False","T")>0,1,0)This formula is copied across for all of the stocks symbols and down all of the columns for the historical calculations of the study in the Excel spreadsheet.
At the end of the rows, the sum of the values is determined and divided by the number of stocks (103) then multiplied by 100 for the percentage:
=SUM(B2:CZ2)/103*100
However, while in Excel, we can format that to display a simple percentage value with no decimal points, i.e., 46%, the chart in CQG may show something like 45.95.
Here is a trick to have the chart in CQG show just 46. Convert the number to text with no decimals then multiply it by 1 to convert it back to a number CQG can read. Cell DF2 contains:
=TEXT((SUM(B2:CZ2)/103)*100,"#")*1
This formula is copied down a column for the current and historical values of this study. To bring the study into Excel a time scale is required, which will be in a separate column.
To pull in the 5-minite bar time, we use:
=RTD("cqg.rtd",,"StudyData","ENQ","Bar","","Time","5Min",A1,"","ENQStockSession","","False","T")Notice above, the parameter " ENQStockSession ". This is a custom session used for the chart of the ENQ futures contract. This custom session uses the same open and closing times of the US Stock market (8:30-15:00 Chicago time).
Finally, there is a 10-period moving average of the study in cell DH2:
=TEXT(AVERAGE(DF2:DF11),"#")*1
The RTD formulas are copied down their respective columns to provide historical data.
XL Time Series Study
Now, that the details of the sample Excel spreadsheet are completed, bringing the data into CQG as a study on a chart is very simple. There are two ways: One is to add the XLTS study to the chart from the External Data Studies Group and second is to create a custom study and add that to the chart. The downloadable CQG pac file at the end of the article uses the custom study version.
To add the XLTS study to a chart, right-click somewhere on the chart and select Add Study, choose the External Data Studies, select XLTS and then click the Setup button.
The Setup for XL Time Series requires you to enter the name of the spreadsheet with the extension (NASDAQ100DiffusionIndex.xlsx), the Sheet name (Sheet2), and the Cell References (DE2:DF101).

If you had a column for date and a column for time then you check the Separate Date/Time box.
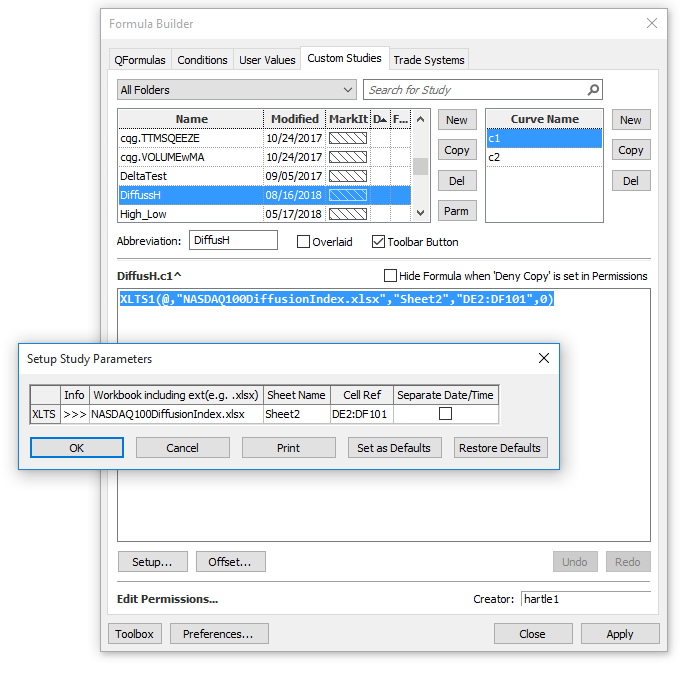
Now let us walk through creating a custom study. Click Formulas/Custom Studies and New. In our example, the Custom Study is named DiffussH.
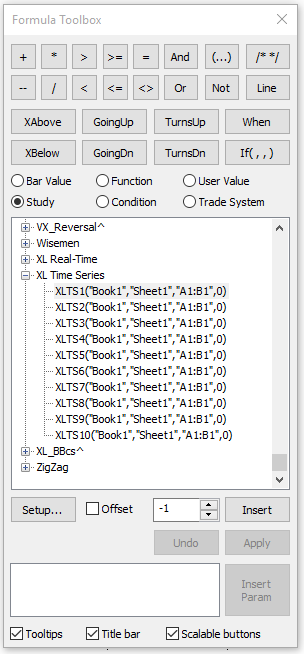
From the Toolbox select XL Time Series and Insert the XLTS1 study.
Click on setup and similar information is entered into the Setup Study Parameters. The Cell reference is using cells DE2:DF101. There is a time column and a single data column.
The custom study uses two curves: the data and a moving average using the two studies (XLTS1and XLTS2). Add another curve (c2) by clicking New next to the Curve Name box and naming it c2. Then, from the Toolbox select XL Time Series and Insert the XLTS2 study, select Setup and enter in the spreadsheet name, Sheet name and for the Cell References, we use DG2:DH101. Column DG is the time column and Column DH is the moving average data. Finally, select the toolbar Button so you can easily add it to a chart.

The CQG XL TS study is a powerful new study because it makes partnering CQG with Excel a seamless integration. Build your models in Excel and import the model output into CQG on a real-time basis.
Requires CQG Integrated Client version 19.6.8034 or higher and enabled for CQG Trading or Spreader and the NASDAQ Exchange. The XLTS study is available to base CQGIC subscriptions at an additional cost.