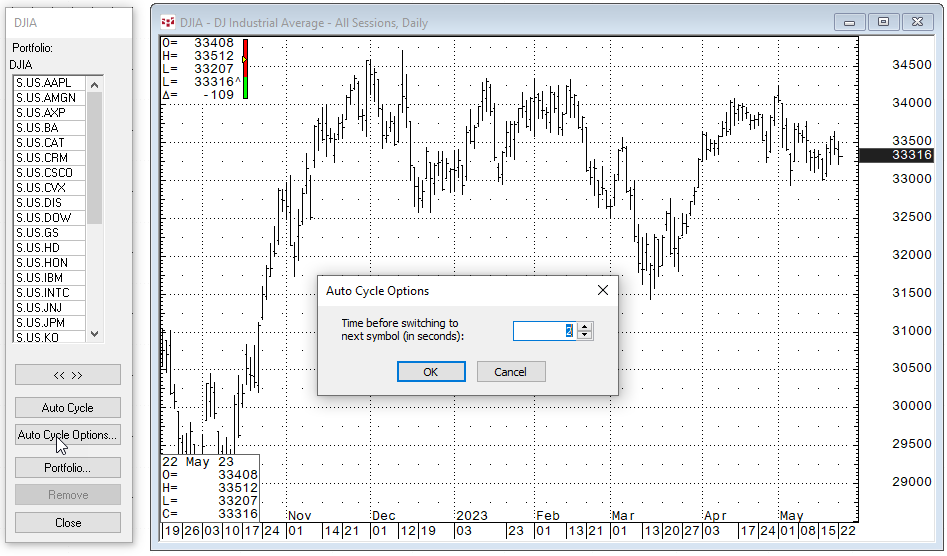
CQG IC and QTrader have a portfolio manager that enables you to create a portfolio of instruments. Once a portfolio is created a common use is for CQG IC users to run a Market Scan testing various… more
Workspaces
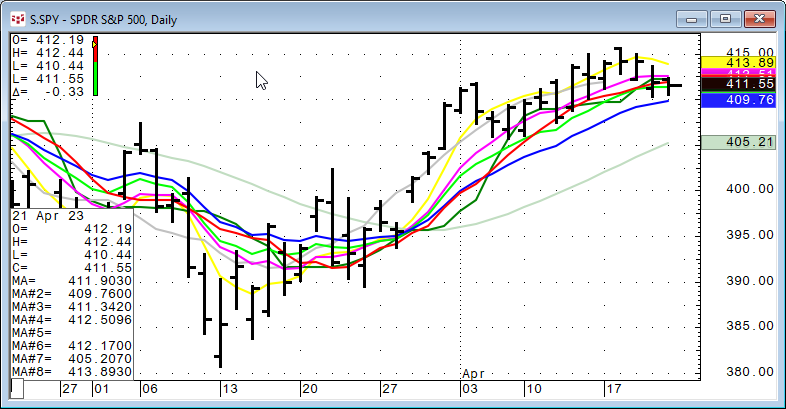
CQG products such as CQG IC, QTrader and CQG One come with a collection of price-based studies which can be applied to charts to facilitate analysis. This post offers insight into the collection… more
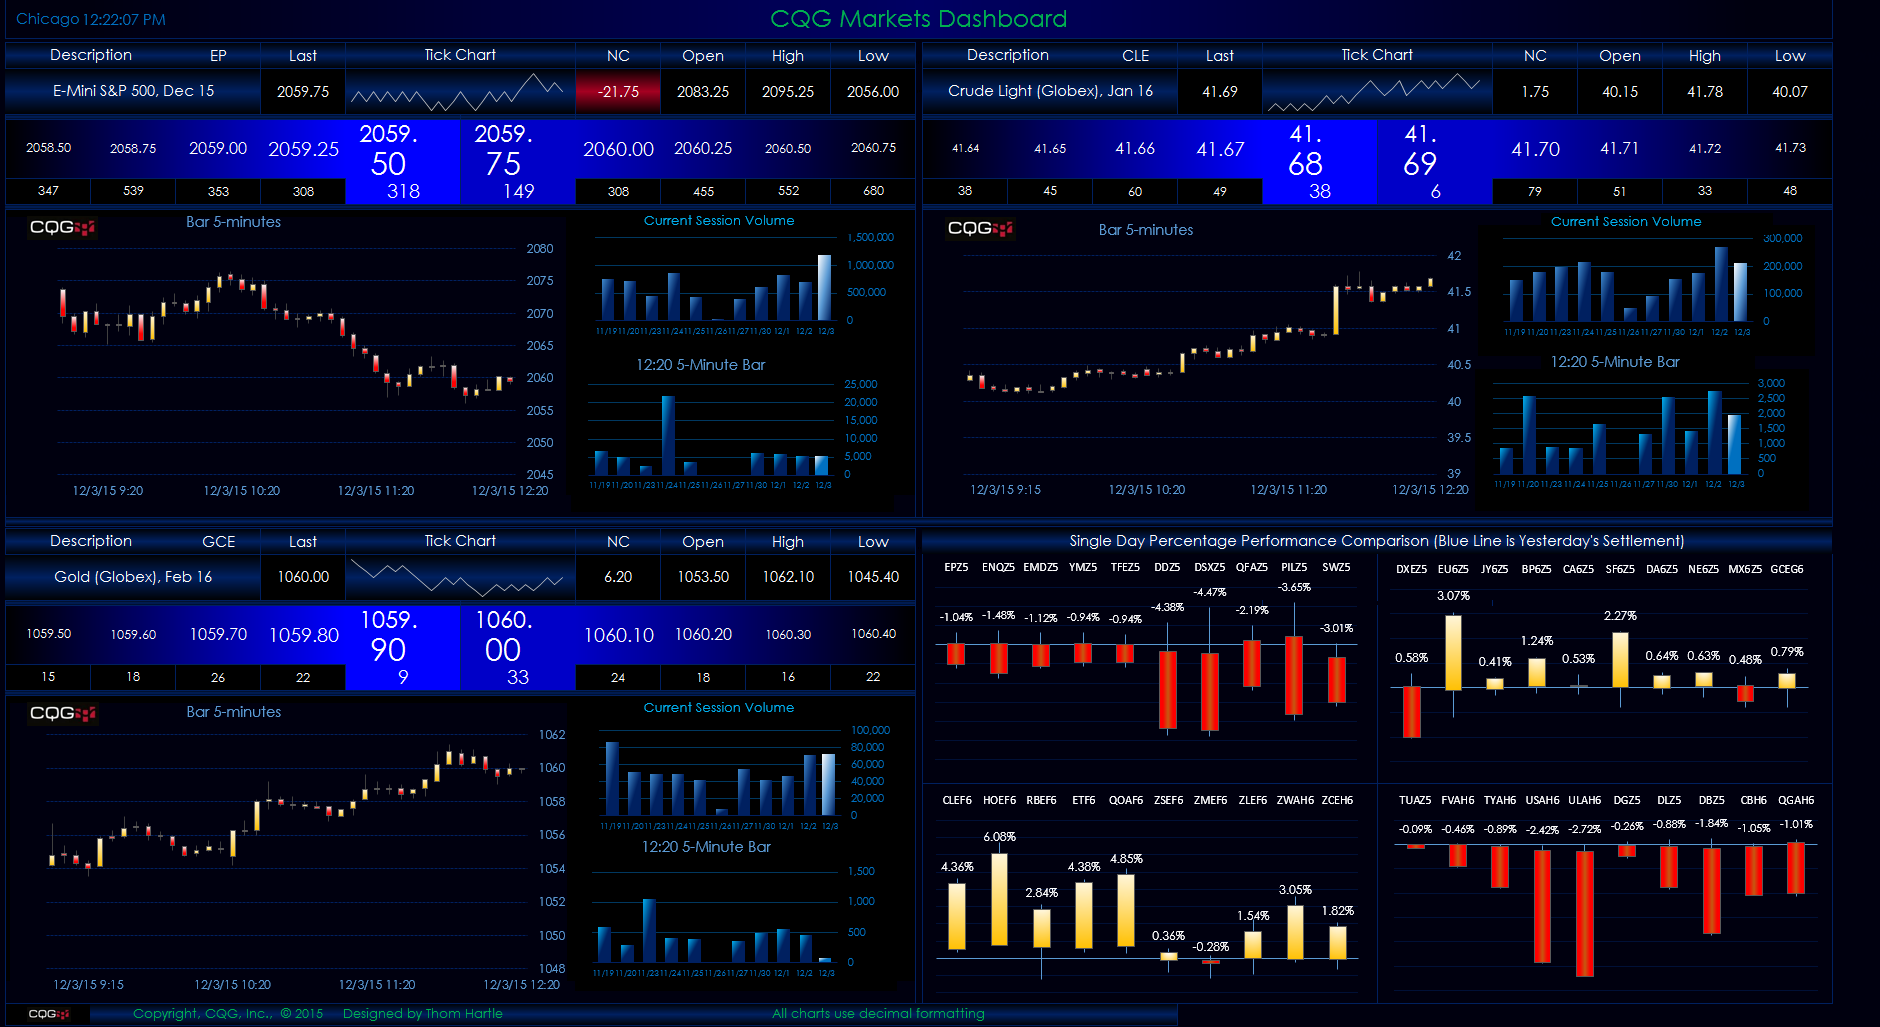
This Microsoft Excel® dashboard presents different styles of viewing market and study information. The left-hand side is today's current market data. You can enter symbols and set the number of… more

This Microsoft Excel® spreadsheet is a combination of market quotes and dynamic ranking. There is a Symbols tab where you can enter the symbols and the parameter for decimal formatting, or you can… more
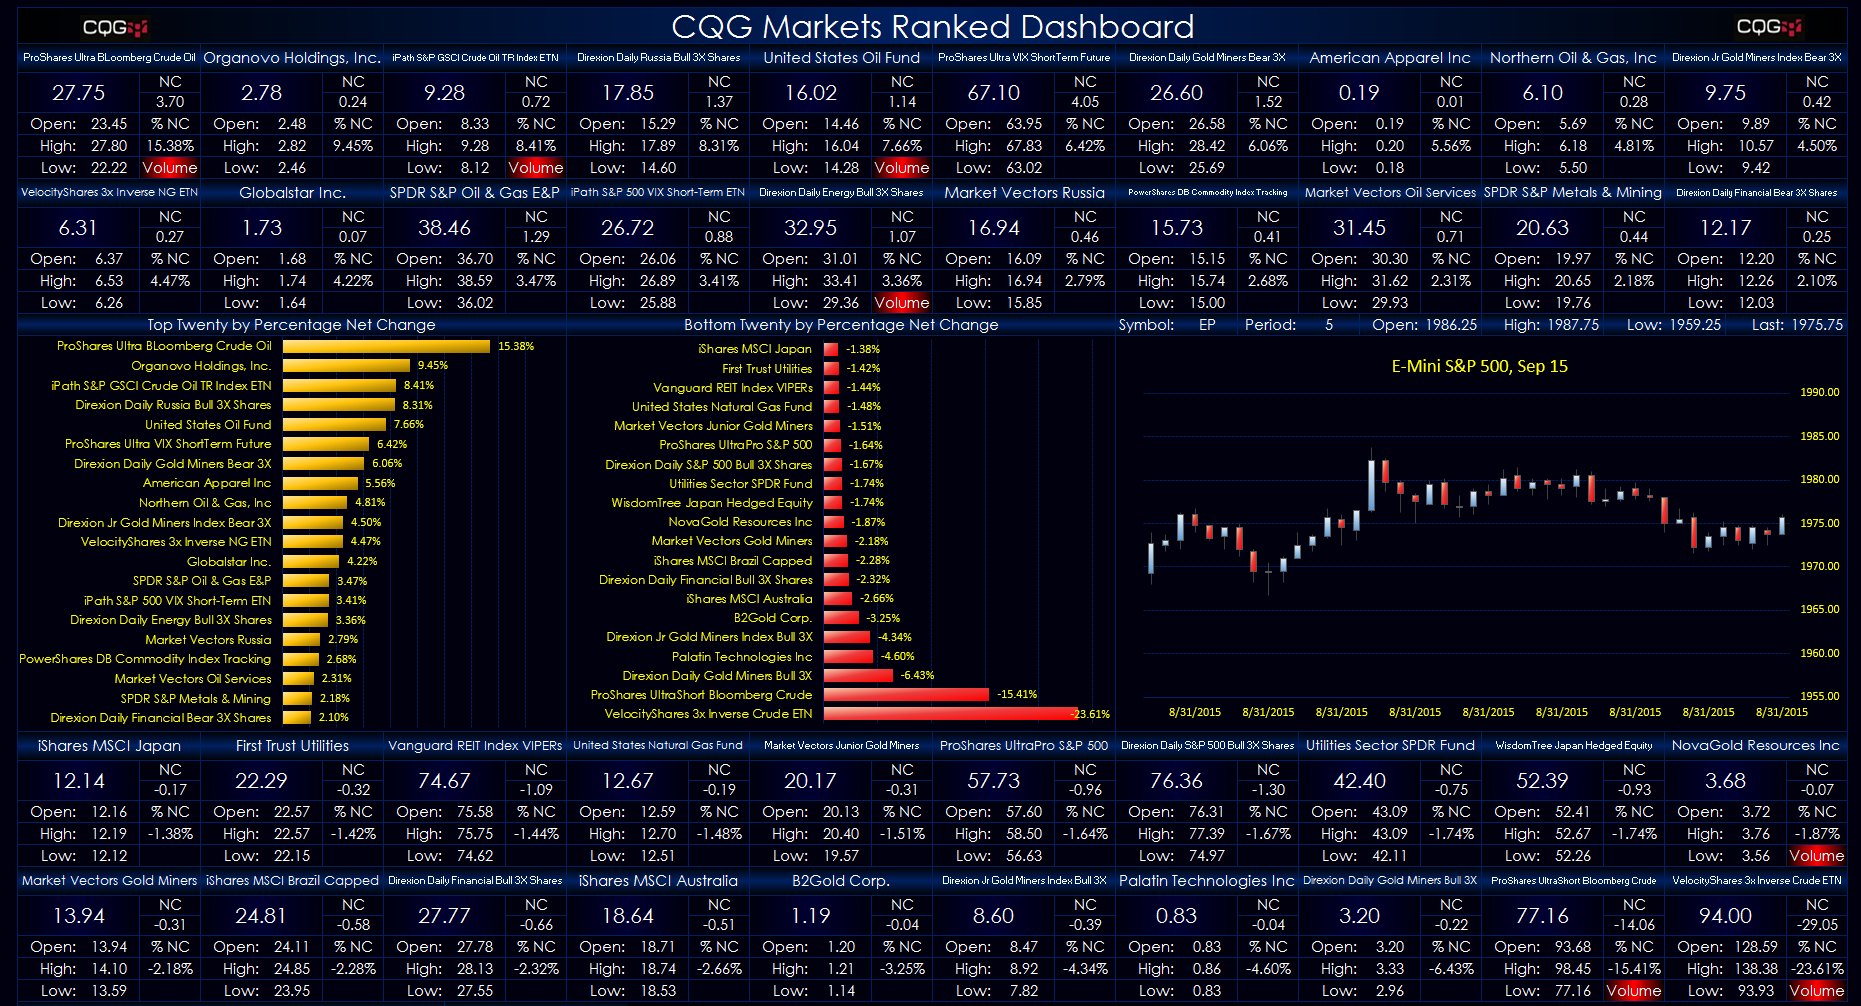
This Microsoft Excel® spreadsheet is a modified version of the Dynamically Ranked SPDR® ETFs Dashboard. This version allows you to enter in the symbols you want using the symbols tab. The top… more
This Microsoft Excel® spreadsheet is an updated version of the CQG-Powered Excel Horizontal DOM Dashboard, which also includes a set of candlestick bars of today's performance for a portfolio of… more

This Microsoft Excel® dashboard offers an automatic performance ranking of exchange-traded funds (ETFs) that is focused on equity performance by country. This dashboard requires the NYSE… more
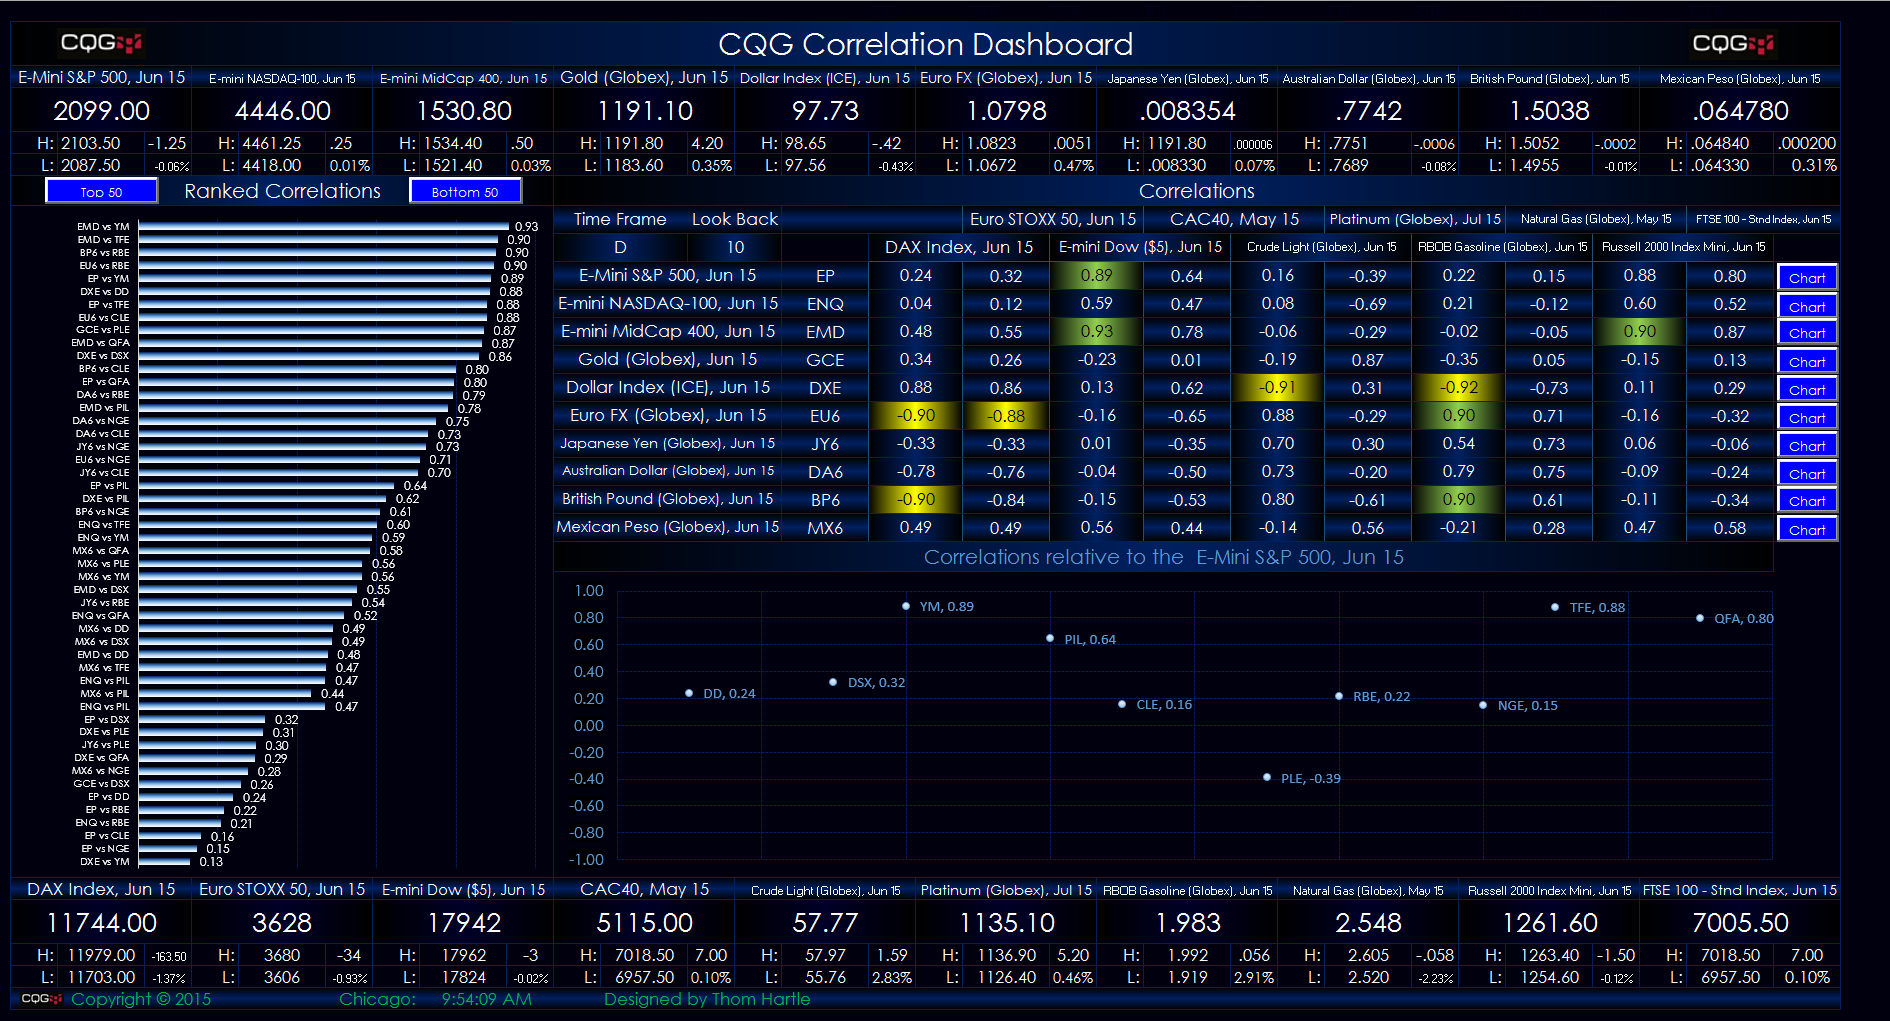
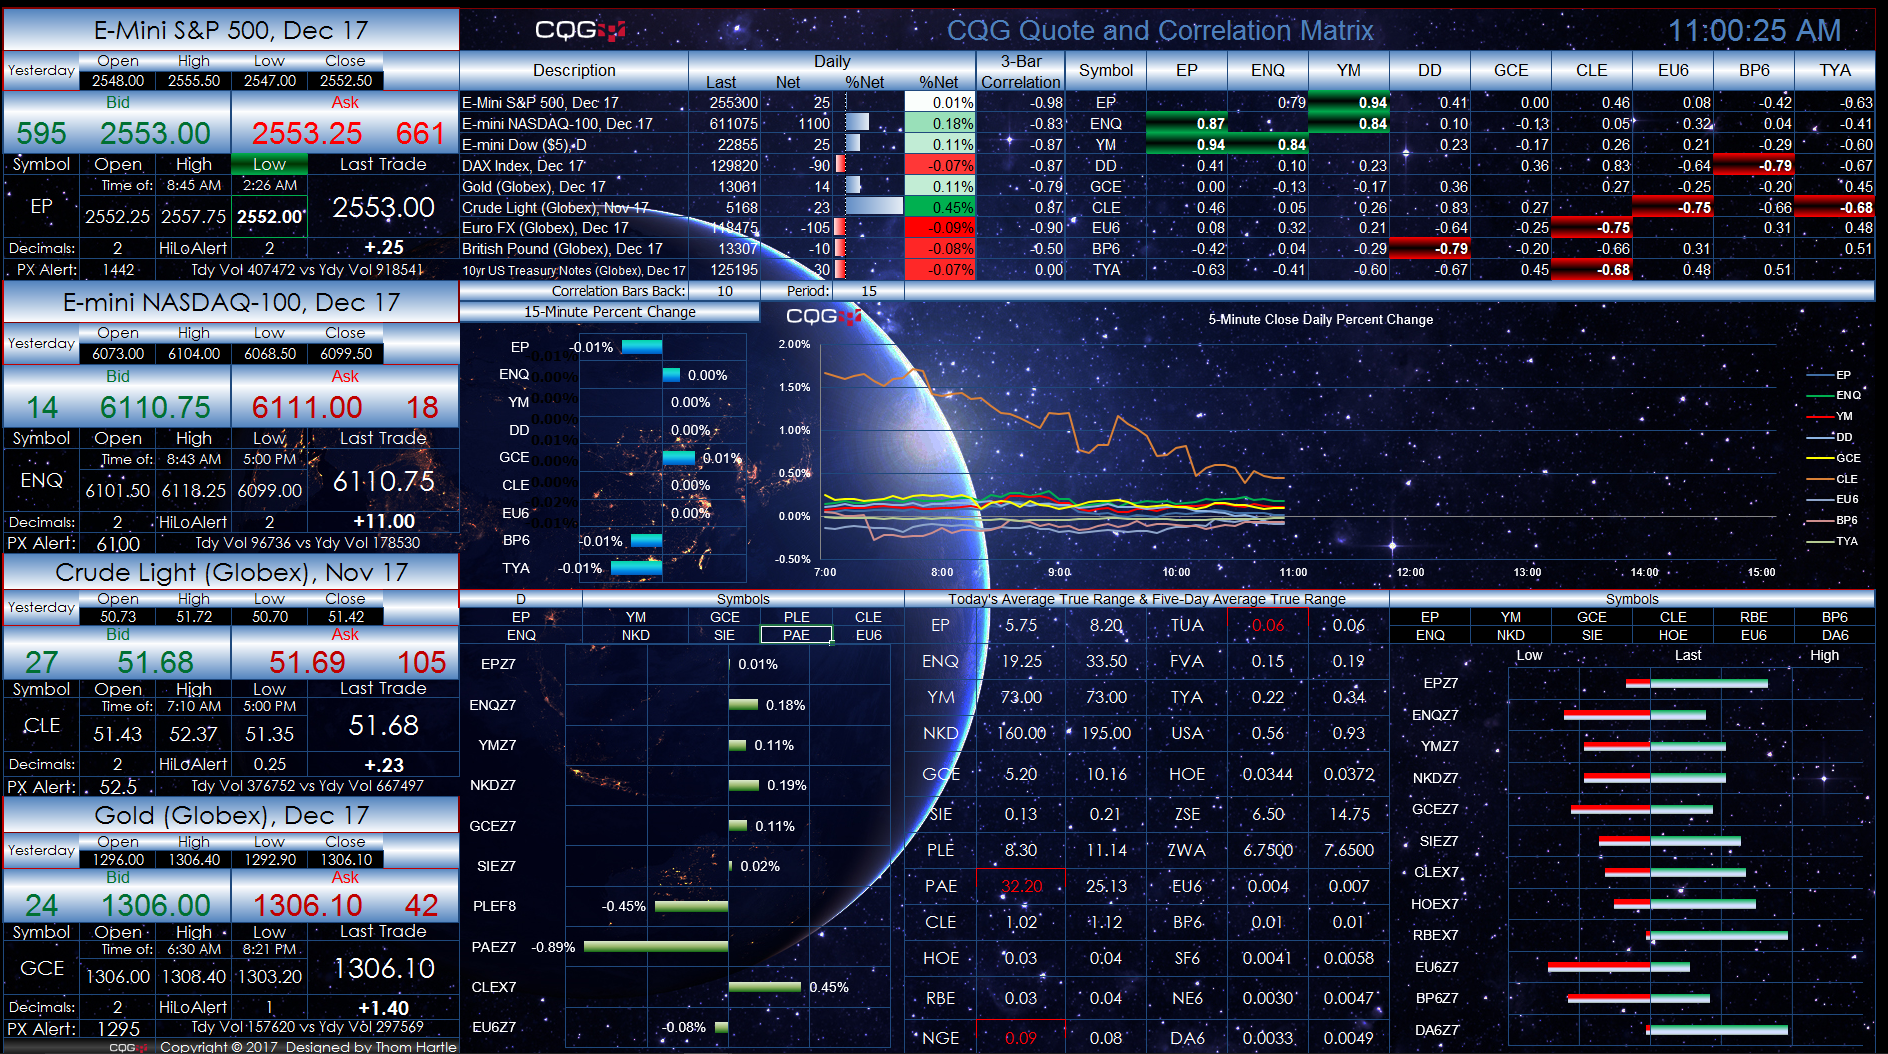
This Microsoft Excel® spreadsheet presents a 10-by-10 correlation matrix. In addition, a dynamically ranked view of the correlations from the 10-by-10 correlation matrix is displayed as histogram… more

This Microsoft Excel® spreadsheet offers a unique format where the current market data is displayed as borders around the chart information. The markets are heat-mapped based on percent net change… more
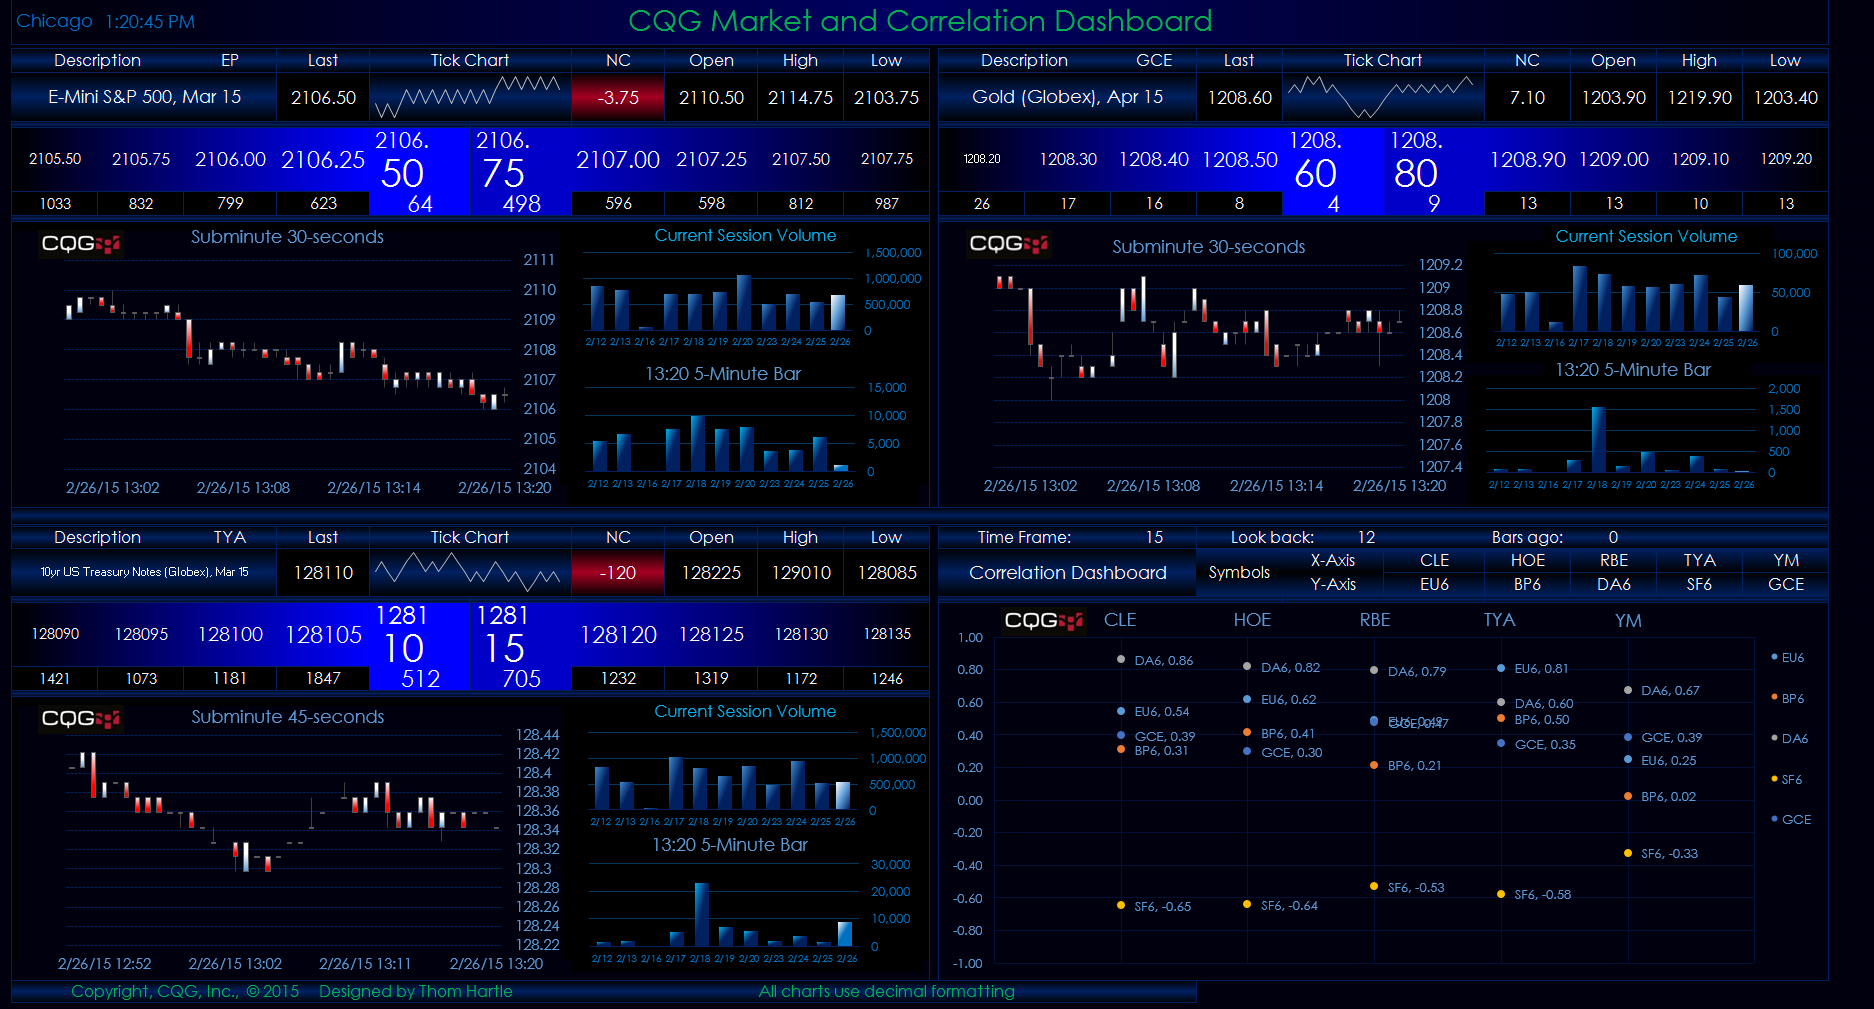
This Microsoft Excel® spreadsheet is an updated version of the CQG-Powered Excel Horizontal DOM Dashboard, which also includes a correlation display. Two histogram charts have been added to each… more