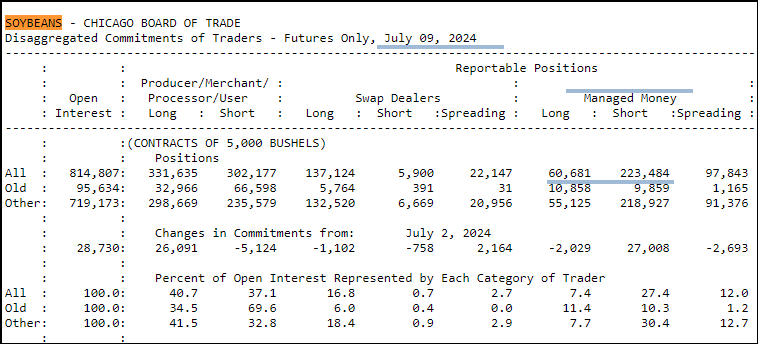
Tracking and analyzing cash market data is more difficult because most cash market data is a single print for the day of the report, that is there is no open, high, low or close, just the close.… more
Workspaces
Introduction
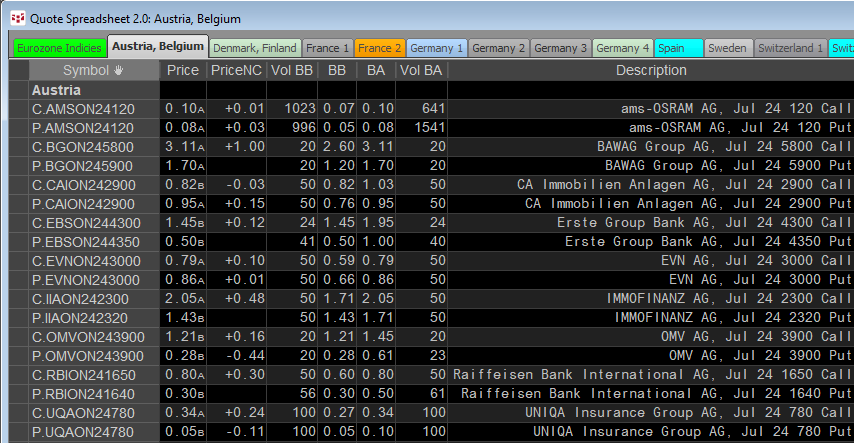
Cboe Europe Derivatives (CEDX) is a European derivatives marketplace which enables participants to access equity derivatives markets for quotes and trade execution.
CEDX offers a… more
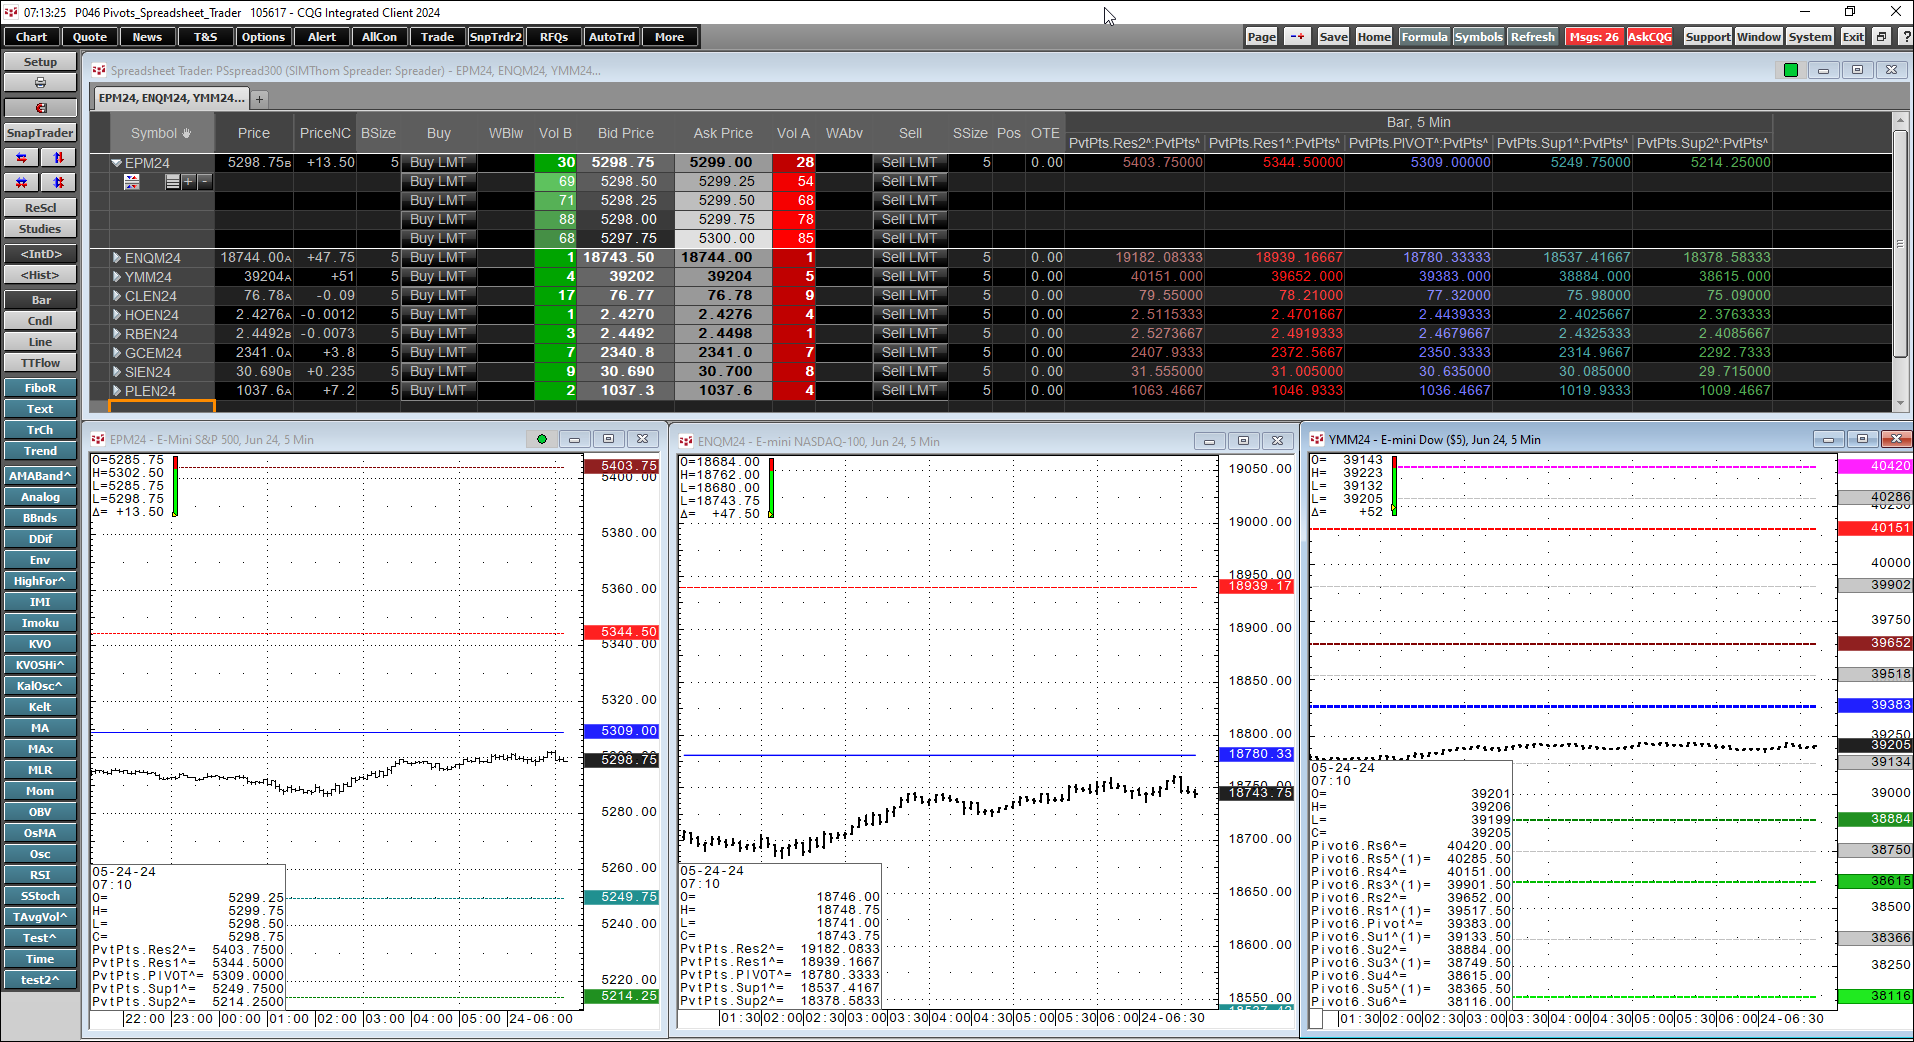
The pivot point is the arithmetic average of the high (H), low (L), and closing (C) prices of the active instrument, Pivot Point = (H+L+C)/3 or Pivot Point = HLC3. The study applied to a chart… more
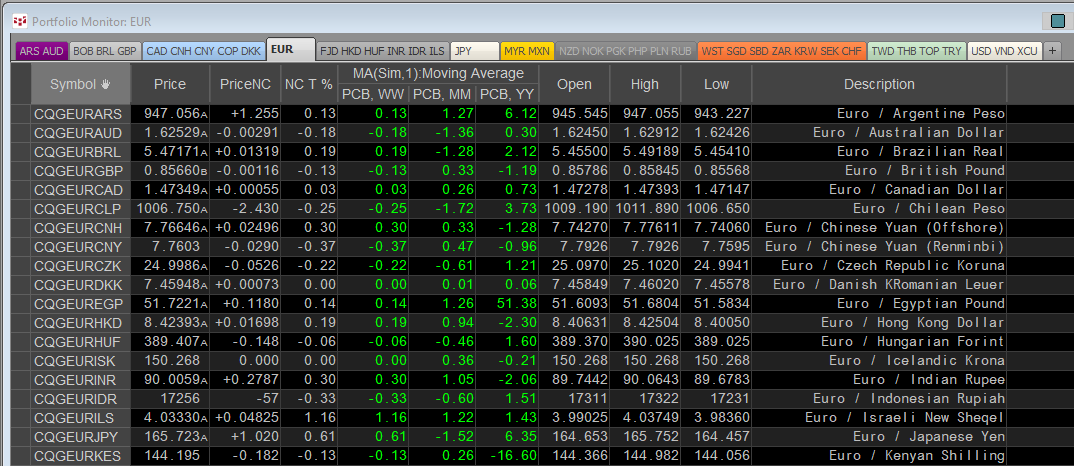
CQG offers institutional pricing data across 430+ currency pairs of market data. Sourced directly from tier-1 banks and non-bank market makers worldwide, the feed provides up to 50 years of… more
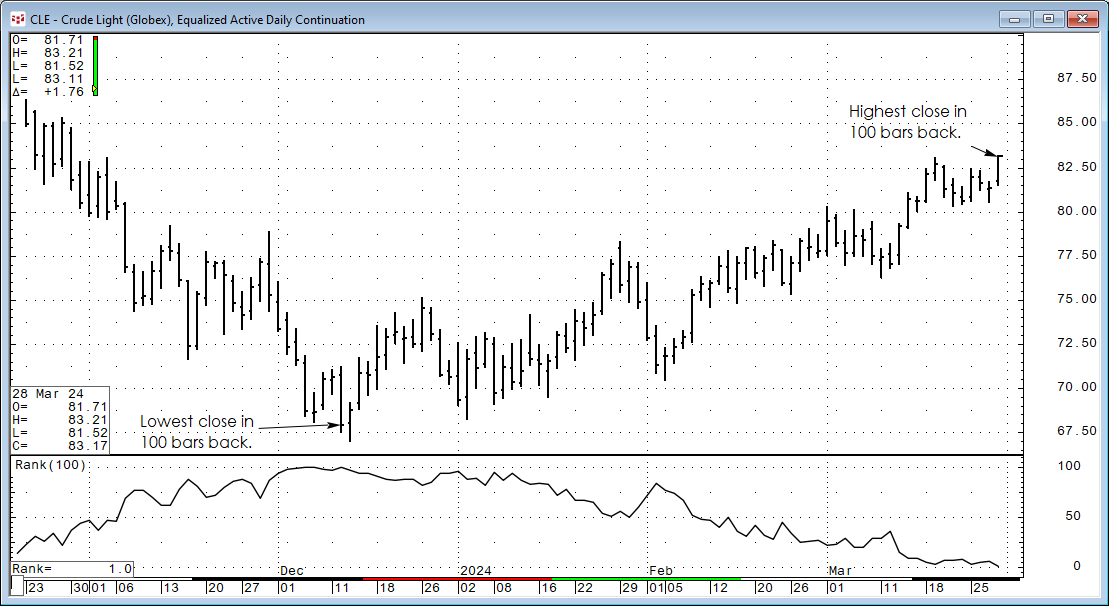
The CQG Rank Study ranks the individual chart points of a market over a specified number of previous trading periods. For example, if the current bar's close had a rank of 3, and the periods were… more
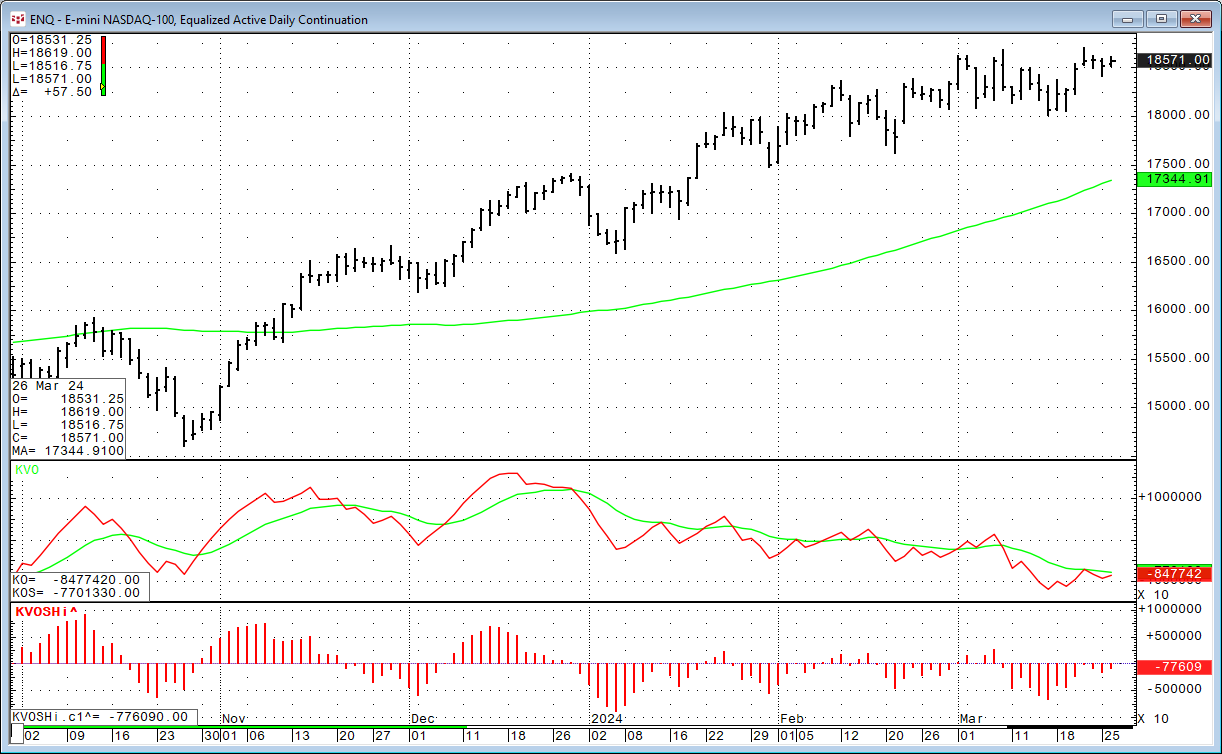
The Klinger Volume Oscillator (KVO) was developed by Stephen Klinger. The study uses the difference between two exponential smoothed moving averages (EMA) of the "Volume Force" and includes a… more
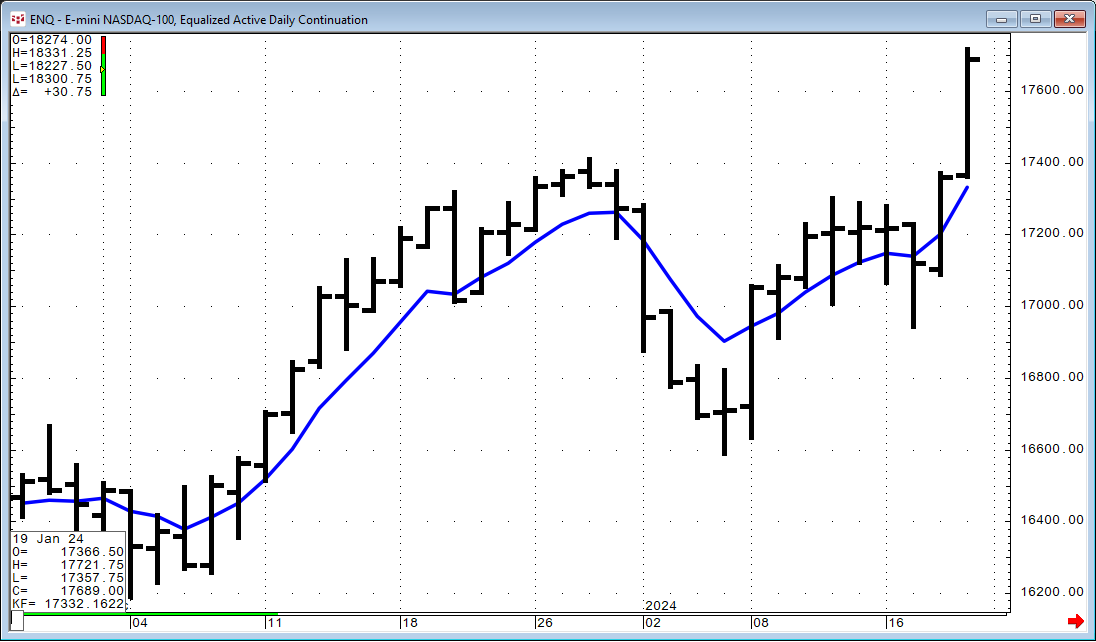
The Kalman Filter is a recursive algorithm invented in the 1960s to track a moving target from noisy measurements of its position and predict its future position. The Kalman filter is an optimal… more
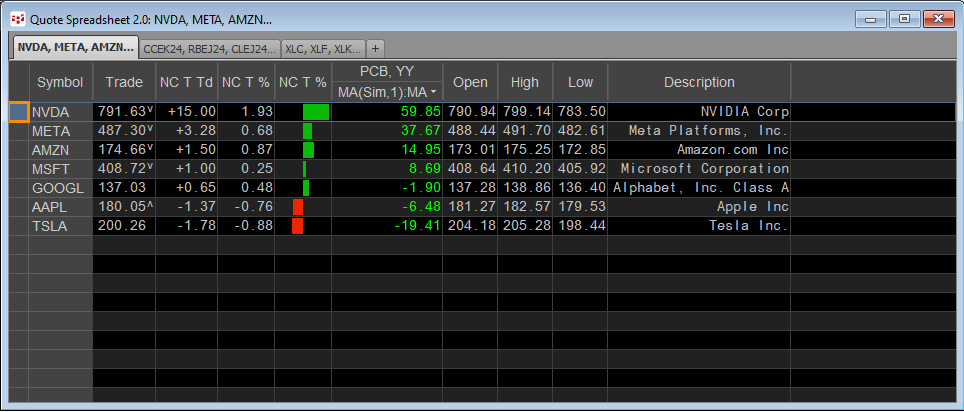
A popular form of market analysis is to maintain a real-time table of market performance based on an annualized basis. For example, the QSS 2.0 displayed below has a sorted column highlighted with… more
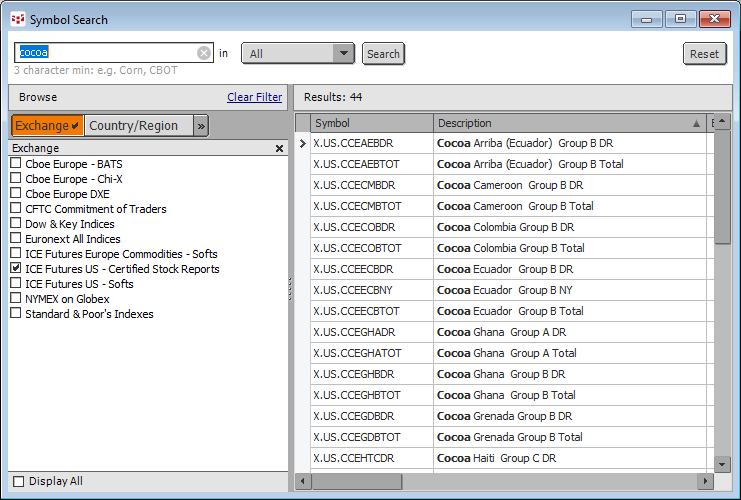
Cocoa certified stocks are bags that have been graded by the ICE exchange by ICE approved graders and are warehoused in exchange approved warehouses around the world. ICE reports the current… more
The Adaptive Moving Average (AMA) was developed by American quantitative financial analyst and author Perry J. Kaufman. The AMA study is like the exponential moving average (EMA), except the AMA… more