The Klinger Volume Oscillator (KVO) was developed by Stephen Klinger. The study uses the difference between two exponential smoothed moving averages (EMA) of the "Volume Force" and includes a signal line.
This post offers a unique look at the KVO in that most published articles detailing the KVO present signals as a crossover of the Klinger Volume Oscillator and the Signal Line. This article offers a different view by creating a custom oscillator that is the difference between the KVO line and the Signal line.
First, a look at the KVO calculations.
The start is a comparison of the Key Price versus the previous Key Price.
Key Pricetoday = (Hightoday + Lowtoday + Closetoday)/3
Key Pricet-1 = (High t-1 + Low t-1 + Close t-1)/3
Then, Volume Force = VF and if the Key Pricetoday >Key Pricet-1 add the bar's volume to the running sum, otherwise subtract the bar's volume from the running sum.
Volume Force = VF = (if Key Pricet > Key Price t-1 , Volume otherwise -Volume)
Then KVO is the difference between the EMAshort-period smoothed (VF) and the EMAlong-period smoothed (VF).
KVO = EMAshort-period (VF)- EMAlong-period (VF)
In this case:
EMAshort-period smoothing constant = 34
EMAlong-period smoothing constant = 55
and
KVO Signal = EMAsignal (KVO)
EMAsignal smoothing constant = 13
Klinger Oscillator Signal line = KOS = 13 Period EMA of KVO
To summarize, the KVO is a running volume line that is adjusted for up bars (volume is added) and down bars (volume is subtracted). That line is smoothed with one EMA and a second EMA, and the difference is plotted.
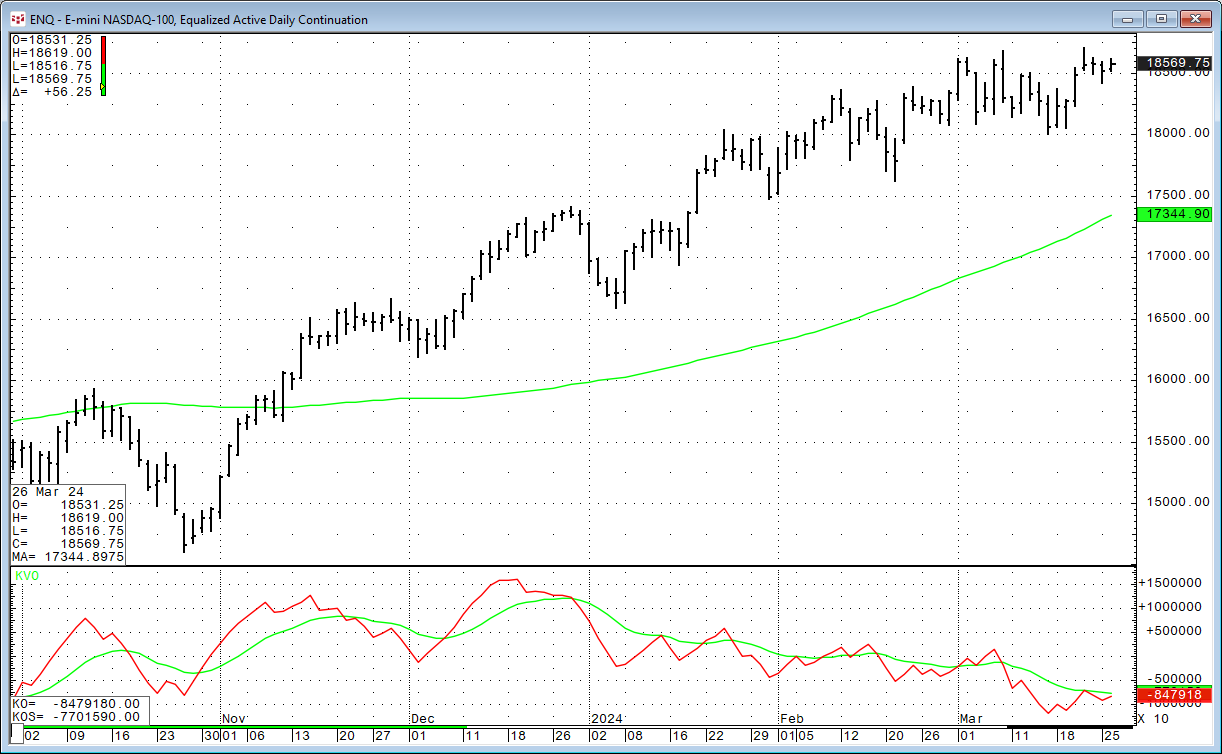
The chart below displays the KVO applied to the E-mini NASDAQ 100 daily bar chart.
The red line is the KVO, and the green line is the signal line. Overlayed on the daily bar chart the green line is a one-hundred day moving average.
The traditional approach using the KVO is if the KVO crosses over the signal line from below, then the trend is now up. And, if the KVO crosses over the signal line from above, then the trend is now down.
Notice the daily bars during this generally rising price trend that the market action will at times lose upward momentum, a correction occurs, but the correction is short-lived and quickly resumes the upward price action.
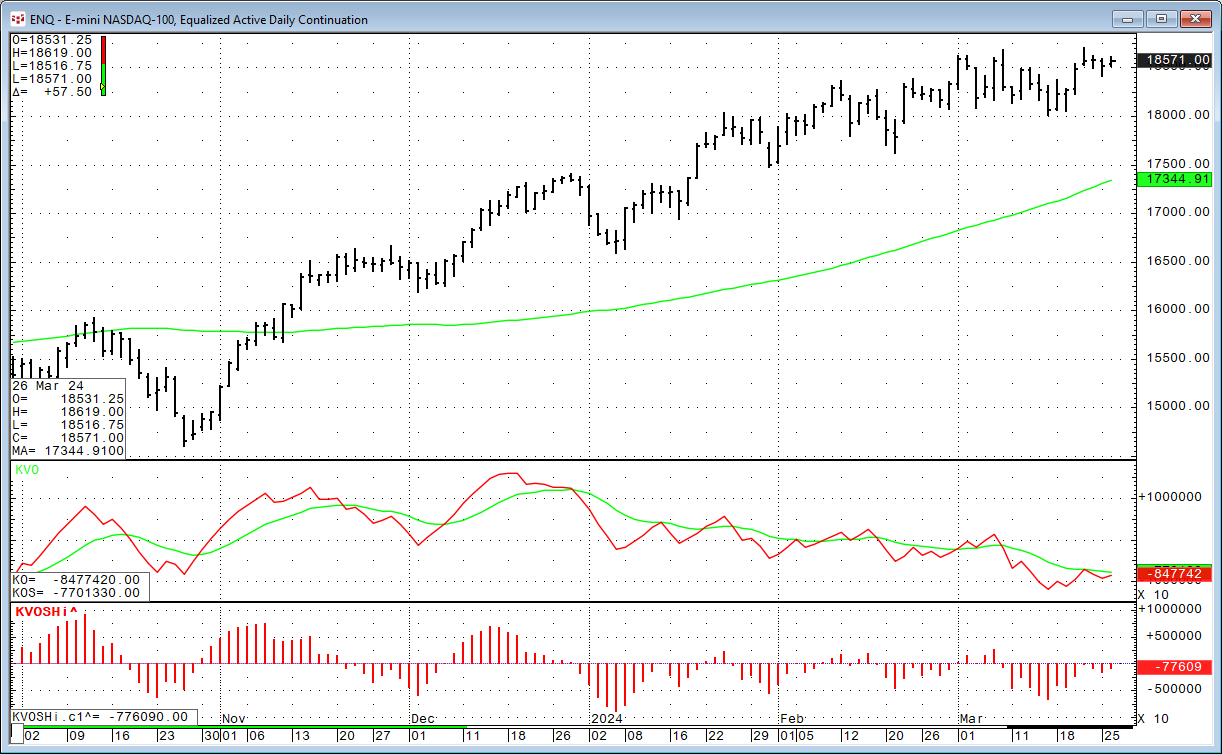
Also, notice that the KVO line, at times, will turn down towards the Signal line, obviously, before it crosses and likewise turn up towards the Signal line before crossing over. Calculating the difference between KVO and the Signal line and displaying that difference as a histogram may be useful. CQG custom formula language would be (a downloadable CQG PAC is available at the bottom of the post):
KO(@)-KOS(@)
The image below shows the custom KVO Histogram study.
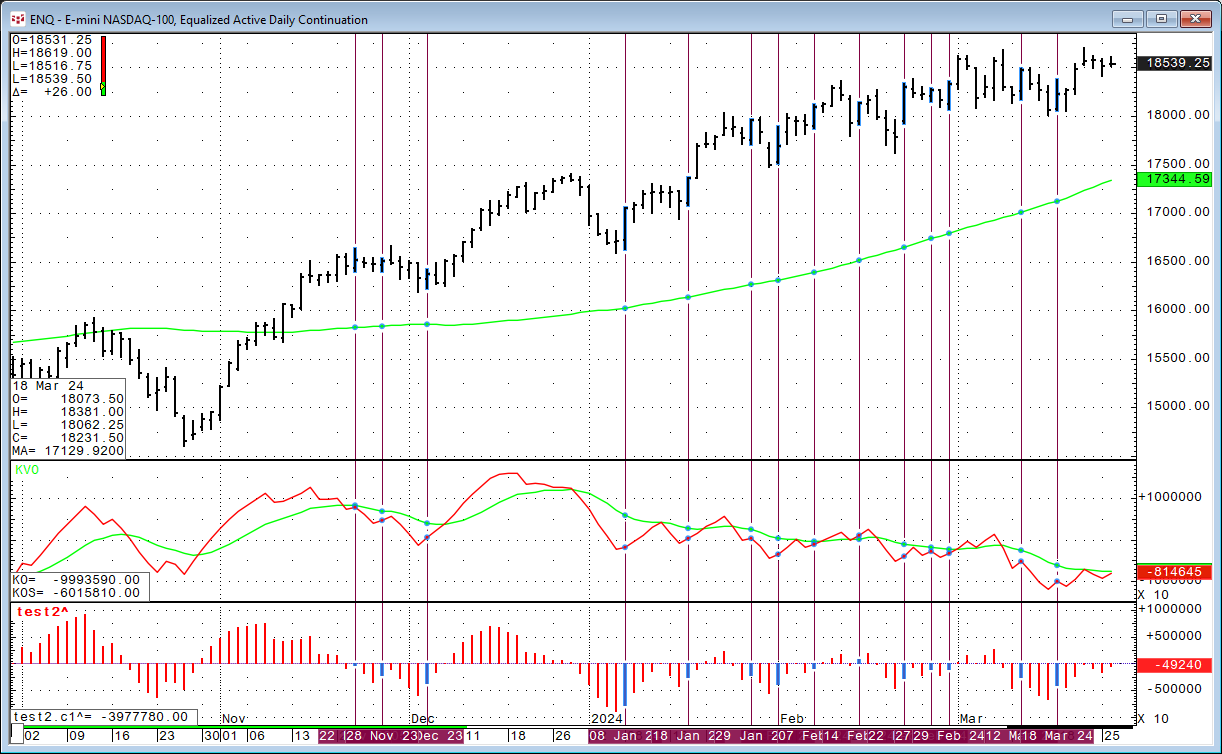
This next image highlights with lines when the histogram bar is less negative compared to the previous histogram bar and the market is above the one-hundred day moving average.
Similar to other oscillators the study coincides with the start of new rising trends but can give signals that are false positives.
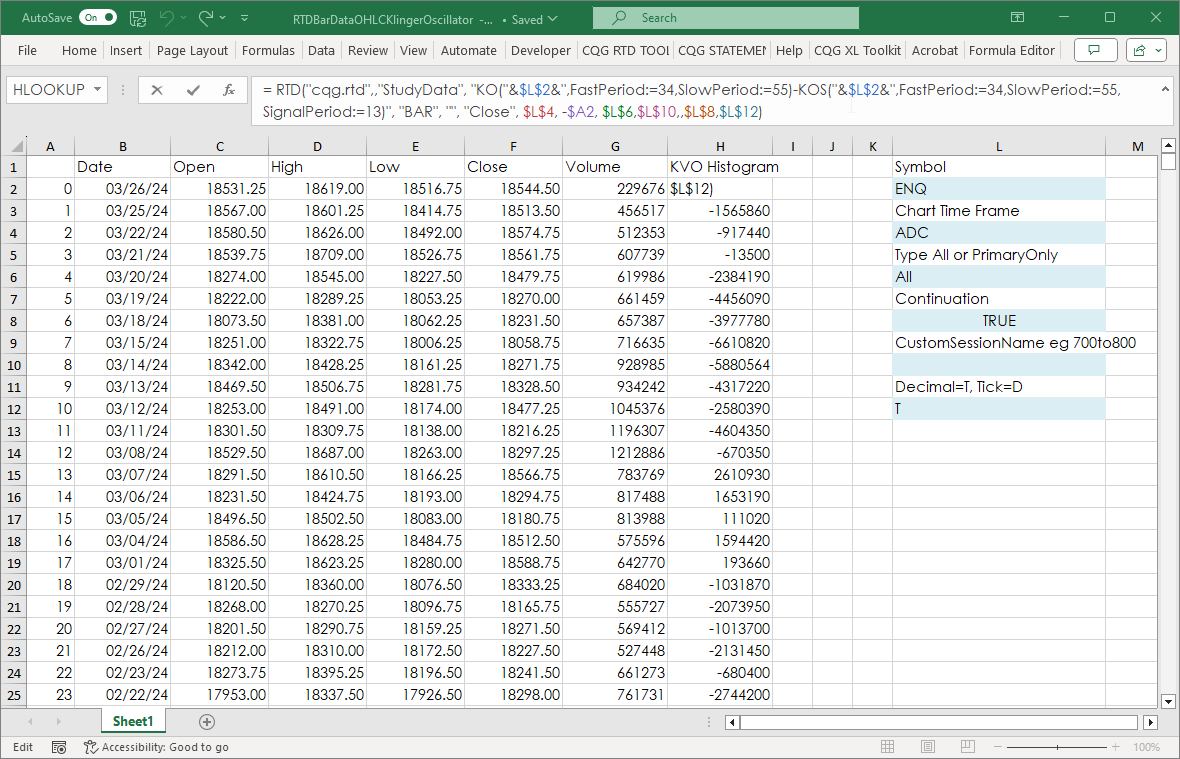
An Excel spreadsheet is available at the bottom of the post that calculates the oscillator using:
= RTD("cqg.rtd",,"StudyData", "KO("&$L$2&",FastPeriod:=34,SlowPeriod:=55)-KOS("&$L$2&",FastPeriod:=34,SlowPeriod:=55,SignalPeriod:=13)", "BAR", "", "Close", $L$4, -$A2, $L$6,$L$10,,$L$8,$L$12)Requires CQG Integrated Client or CQG QTrader, and Excel 2016 or more recent.


