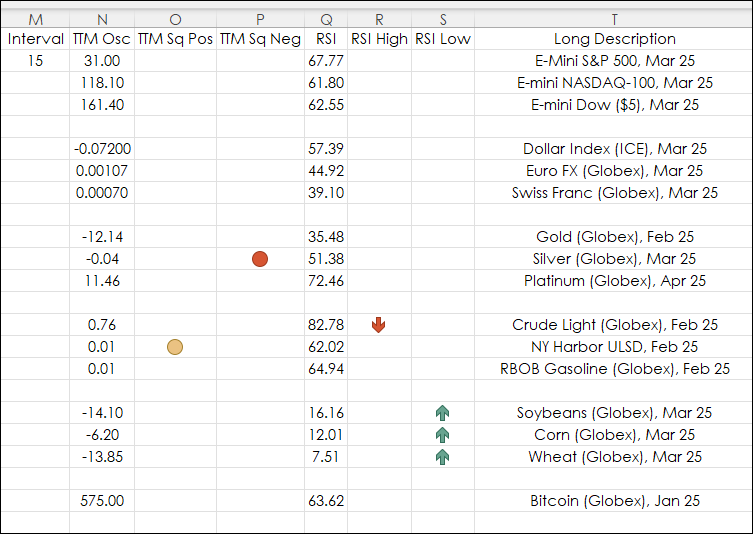
This recent post "Quote Spreadsheet 2.0 TTM Squeeze and More" provided a page installed via a CQG PAC that included a CQG QSS V2 for monitoring the markets. The benefit of the Quote Spreadsheet 2.… more
Workspaces
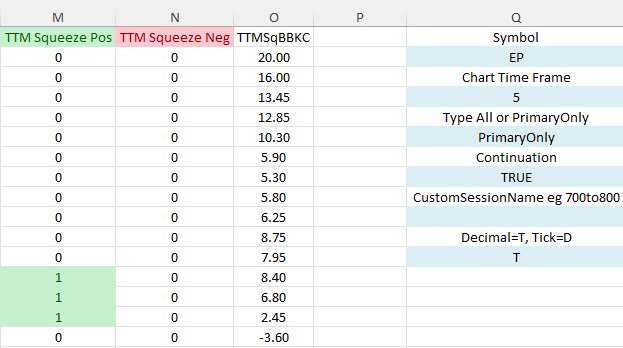
This post "TTM Squeeze Indicator" detailed the TTM indicator, which is a combination of measuring volatility and momentum. The volatility is a condition where the Bollinger Bands contract and move… more
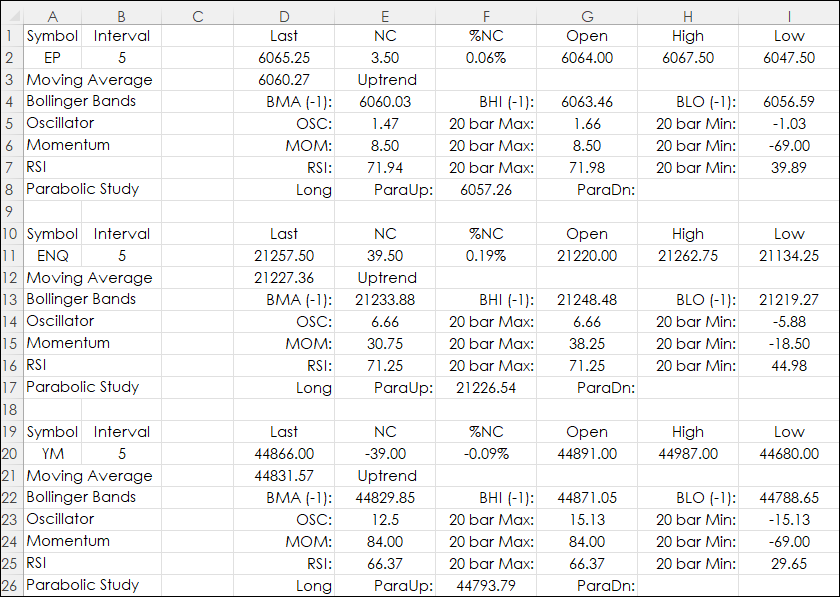
Excel users with RTD links to both market and study data can design a real-time dashboard that can monitor a portfolio of instruments and the status of various studies. This is the topic of this… more
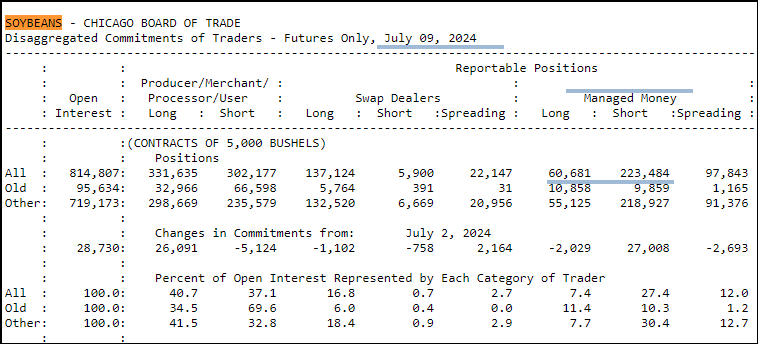
Tracking and analyzing cash market data is more difficult because most cash market data is a single print for the day of the report, that is there is no open, high, low or close, just the close.… more
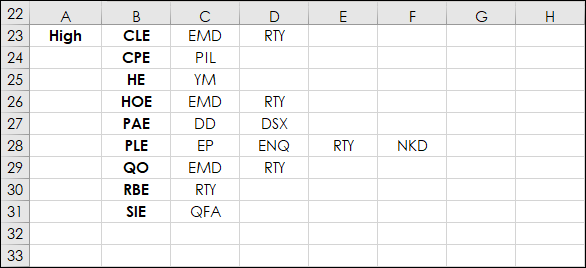
This post details how to extract data from a large array, such as a correlation matrix, to make your workflow more efficient.
First, as the LAMBDA function is used, a brief overview is… more
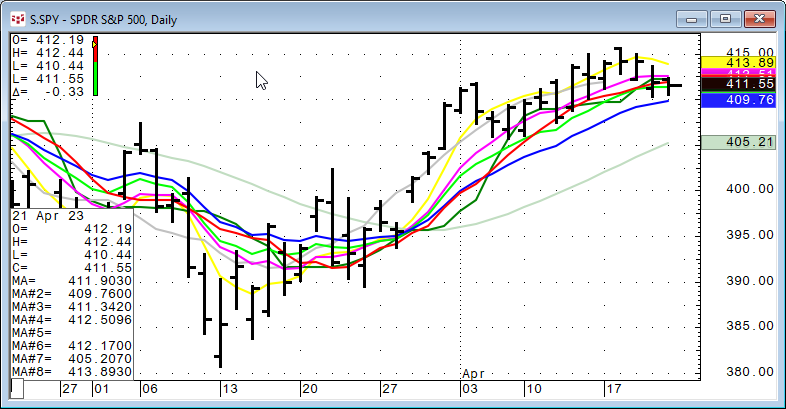
CQG products such as CQG IC, QTrader and CQG One come with a collection of price-based studies which can be applied to charts to facilitate analysis. This post offers insight into the collection… more
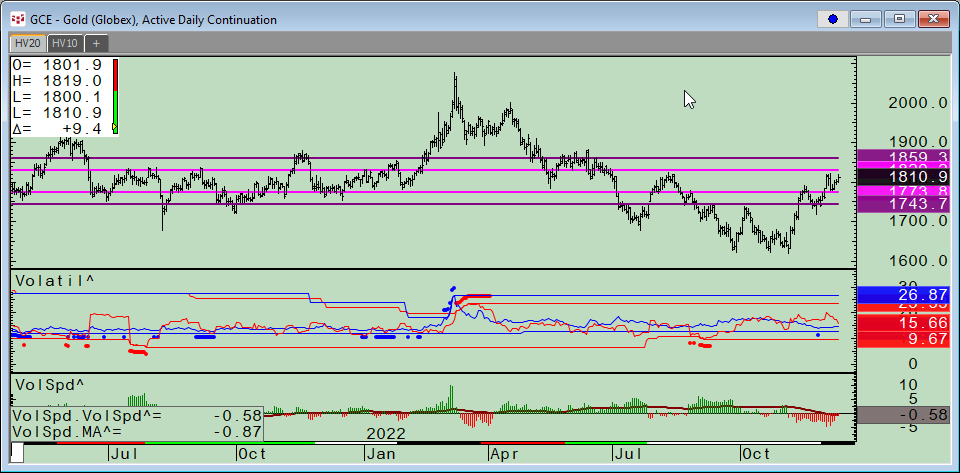
CQG Product Specialist Stan Yabroff designed a CQG page for customers to track and analyze a market’s implied volatility and historical volatility. This post details the features and functionality… more
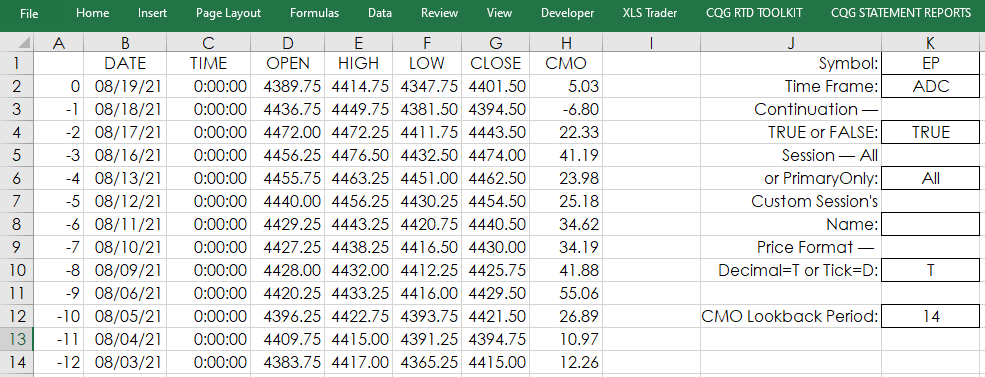
This post builds upon CQG Product Specialist Helmut Mueller's post titled “Most Wanted Seven Studies Plus a Bonus Trading System.” His post provides a PAC with the following studies:
Chande… more
Updated July 24, 2025
Bring Updating Time-Series Data from Microsoft Excel® Into CQGThe XL Real-Time study is included in CQGIC subscriptions enabled for CQG Trading, or Spreader, as well as… more