Excel users with RTD links to both market and study data can design a real-time dashboard that can monitor a portfolio of instruments and the status of various studies. This is the topic of this post.
First, be careful regarding the number of instruments and studies being pulled from CQG to Excel using RTD formulas. Excel can cause a drag on the CPU due to the high volume of requests for updates especially at the time of an important economic release. One suggestion is to turn Excel's Formula Updates to Manual from Automatic to temporarily reduce any negative impacts on the CPU from Excel.
For access to other RTD calls for CQG studies a downloadable sample of most studies and bar types is found here.
For RTD calls for custom studies created in CQG this post details the steps to determining the RTD formula.
For RTD calls for market label data, such as seen in a CQG Quote Spreadsheet please review this post.
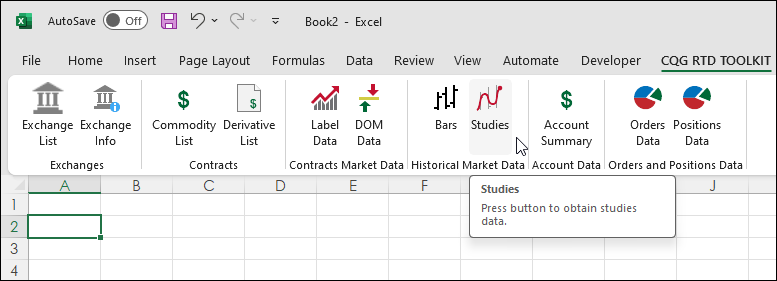
To use the CQG RTD Add-in, first select the Add-in on the Excel ribbon and then click Studies. The studies are Moving Average, Bollinger Bands, Oscillator, Momentum, RSI, and the Parabolic Study.
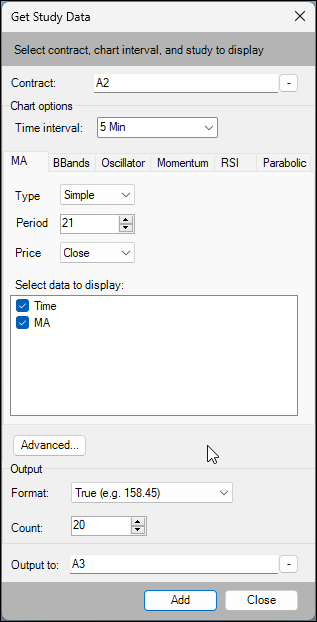
The default dialog is the Moving Average study, which is the first tab. The other studies are the next five tabs. In the downloadable sample spreadsheet, the symbol is in cell A2, and the time interval is 5-minutes.
The choice for moving average types includes:
- Simple
- Smoothed
- Exponential
- Weighted
- Centered
- Median
- Trix
- Exponential Hull
The Format offers two formats, decimal (True) or non-decimal (Display).
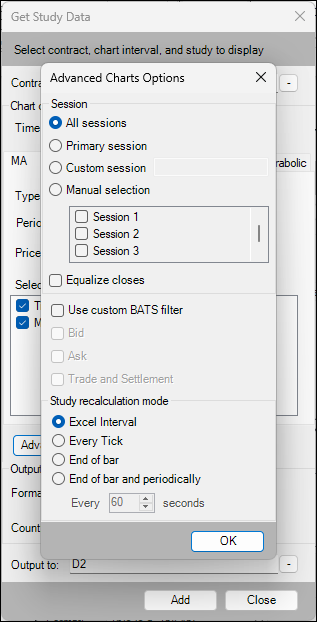
Clicking "Advanced..." opens an additional dialog where you can choose the sessions. To Equalize closes, use the custom BATS filter, and select the recalculation mode. For more information detailing the recalculation mode please view the Help file.
For more information on the moving average study please review the Help file.
The RTD formula for the Moving Average Study:
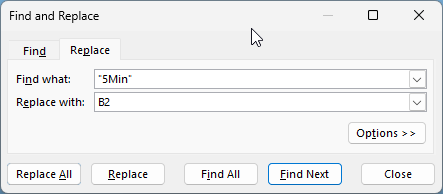
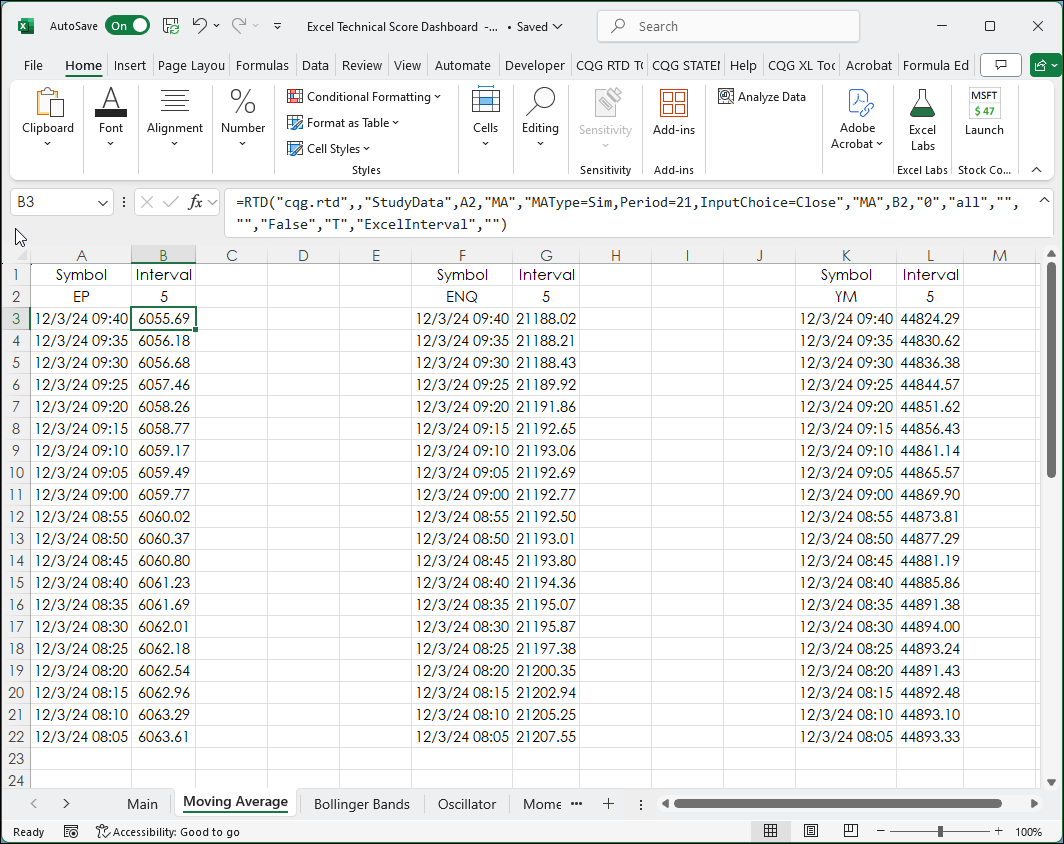
=RTD("cqg.rtd",,"StudyData",A2,"MA","MAType=Sim,Period=21,InputChoice=Close","MA","5Min","0","all","","","False","T","ExcelInterval","")The downloadable sample spreadsheet replaced "5Min" with cell reference B2 so the time interval for all of the RTD formulas can be changed on the fly from the Main tab. Select the spreadsheet and perform a "Find & Replace."
=RTD("cqg.rtd",,"StudyData",A2,"MA","MAType=Sim,Period=21,InputChoice=Close","MA",B2,"0","all","","","False","T","ExcelInterval","")An individual tab is used for each study. This is the Moving Average Tab:
The three symbols and the Time Interval are inputs on the Main tab.
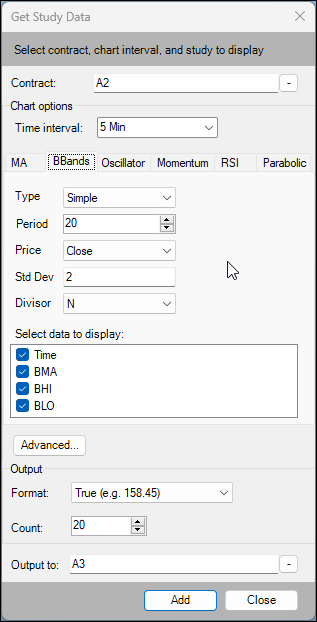
Here is the dialog for the Bollinger Bands study.
For more information on the Bollinger Bands study please review the Help file.
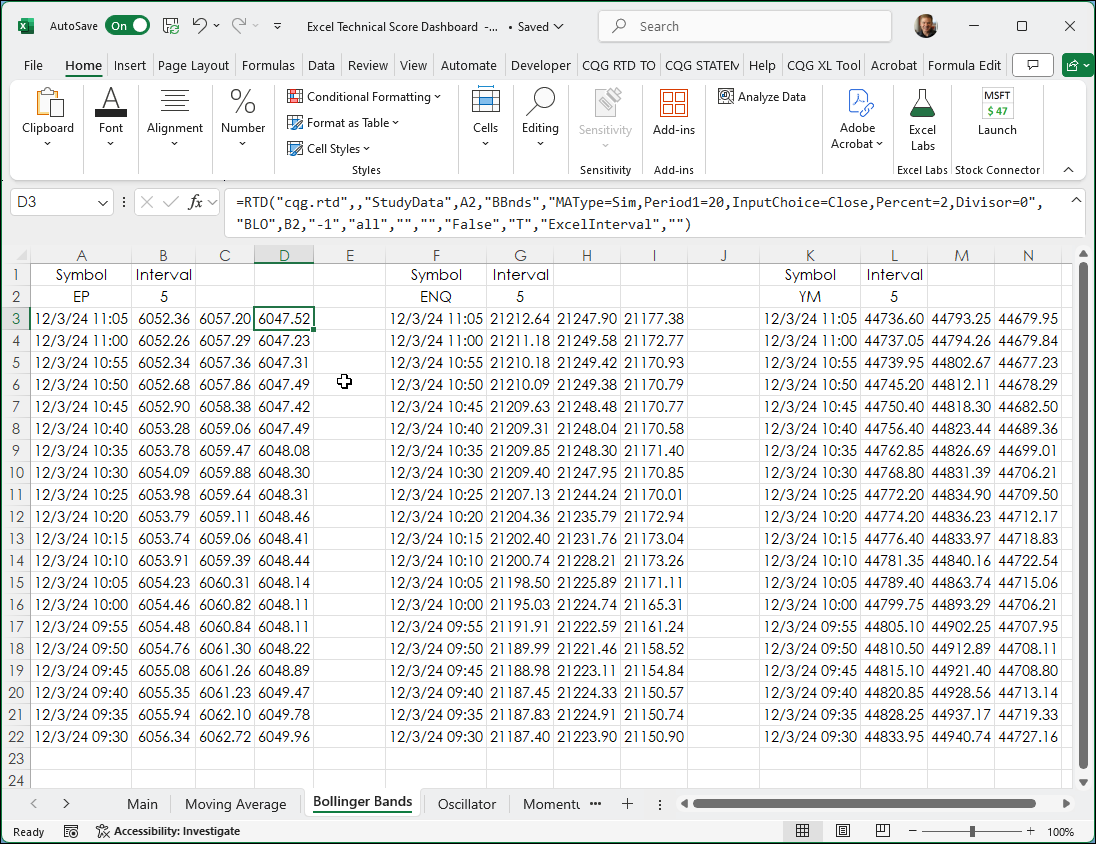
This next image is the Bollinger Bands tab.
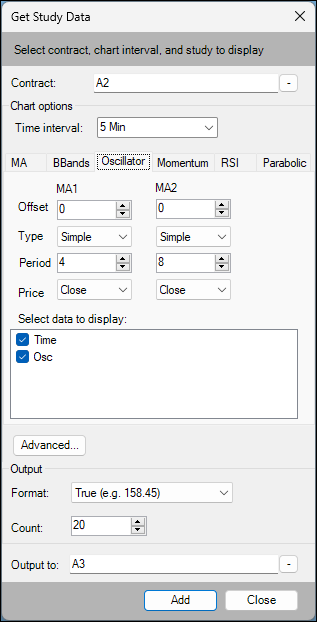
Here is the dialog for the Oscillator study.
For more information on the Oscillator study please review the Help file.
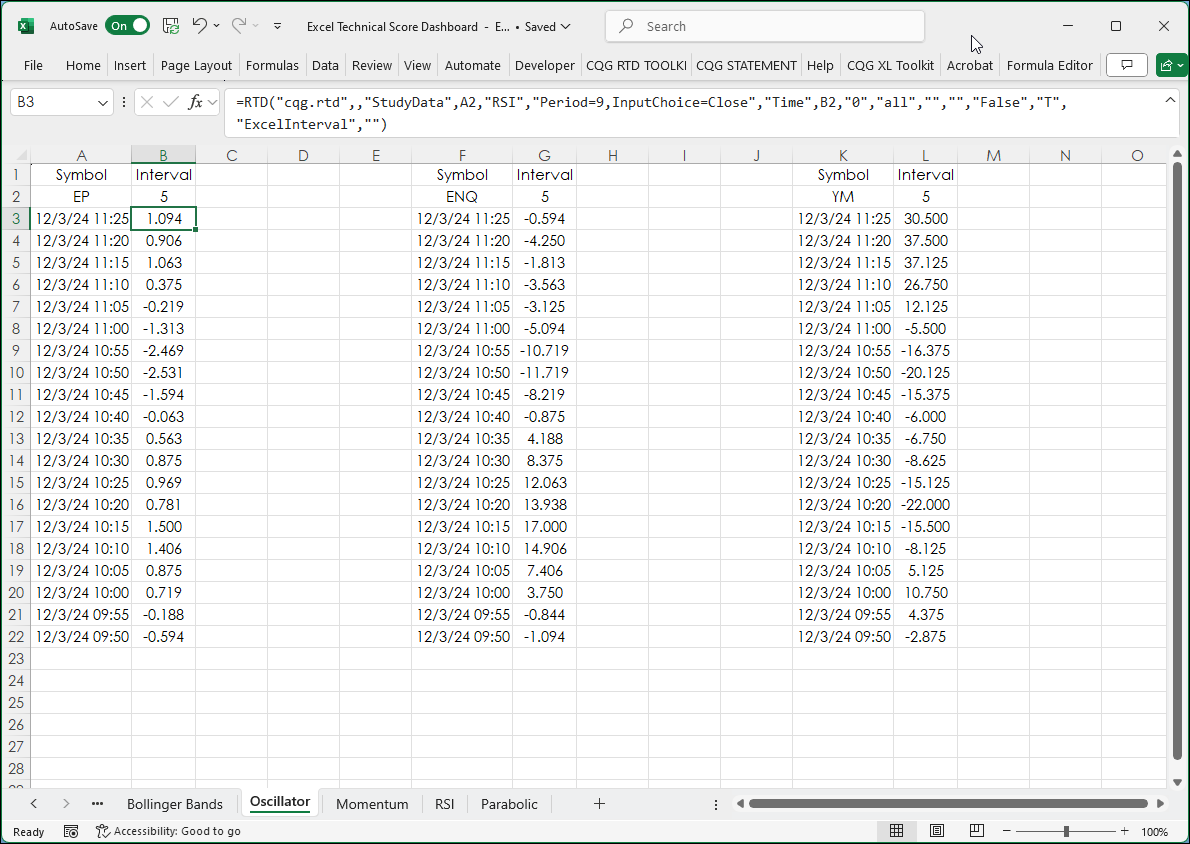
This next image is the Oscillator tab.
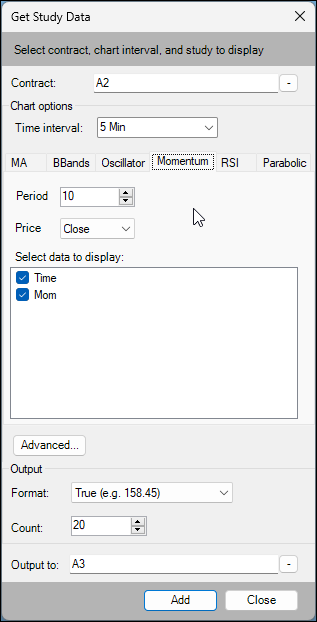
Here is the dialog for the Momentum study.
For more information on the Momentum study please review the Help file.
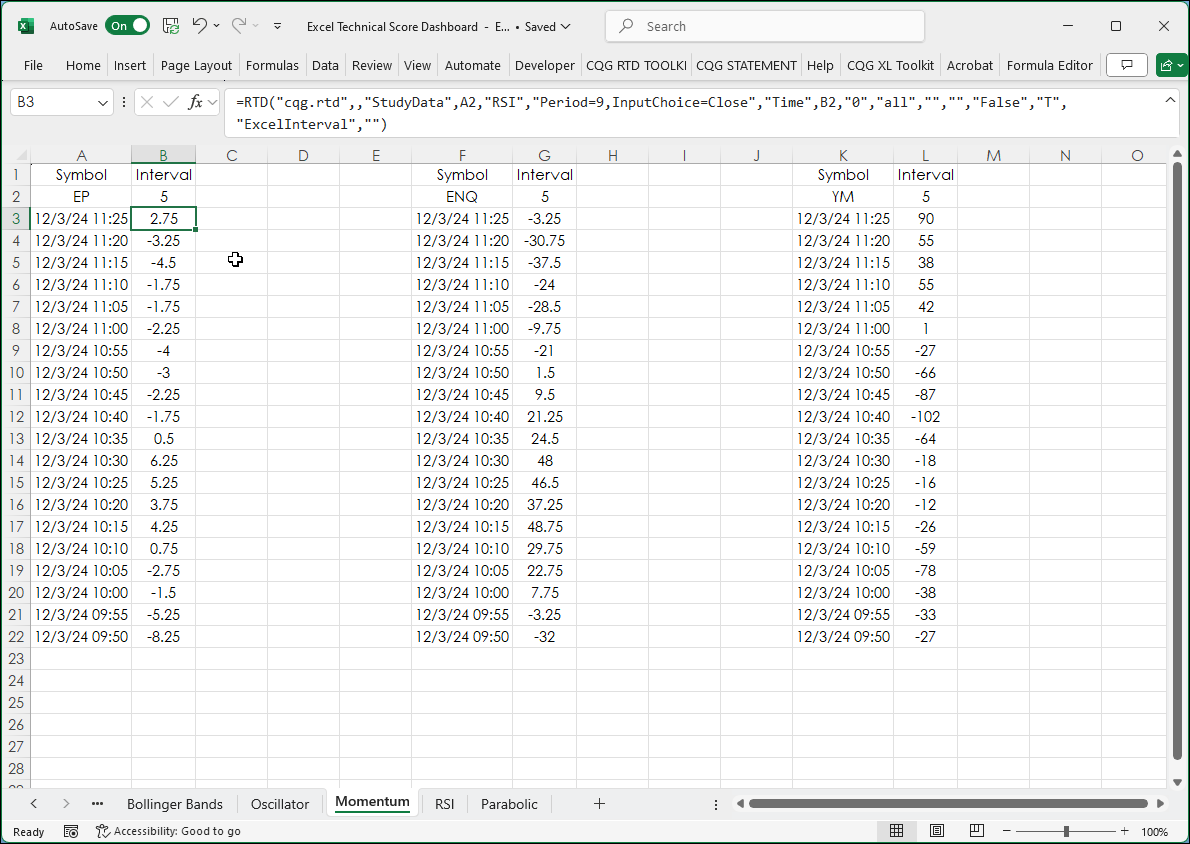
This next image is the Momentum tab.
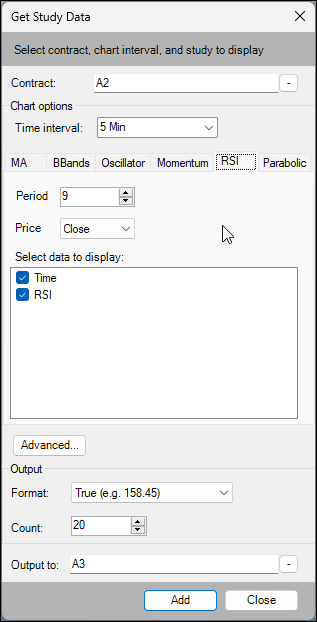
Here is the dialog for the RSI study.
For more information on the RSI study please review the Help file.
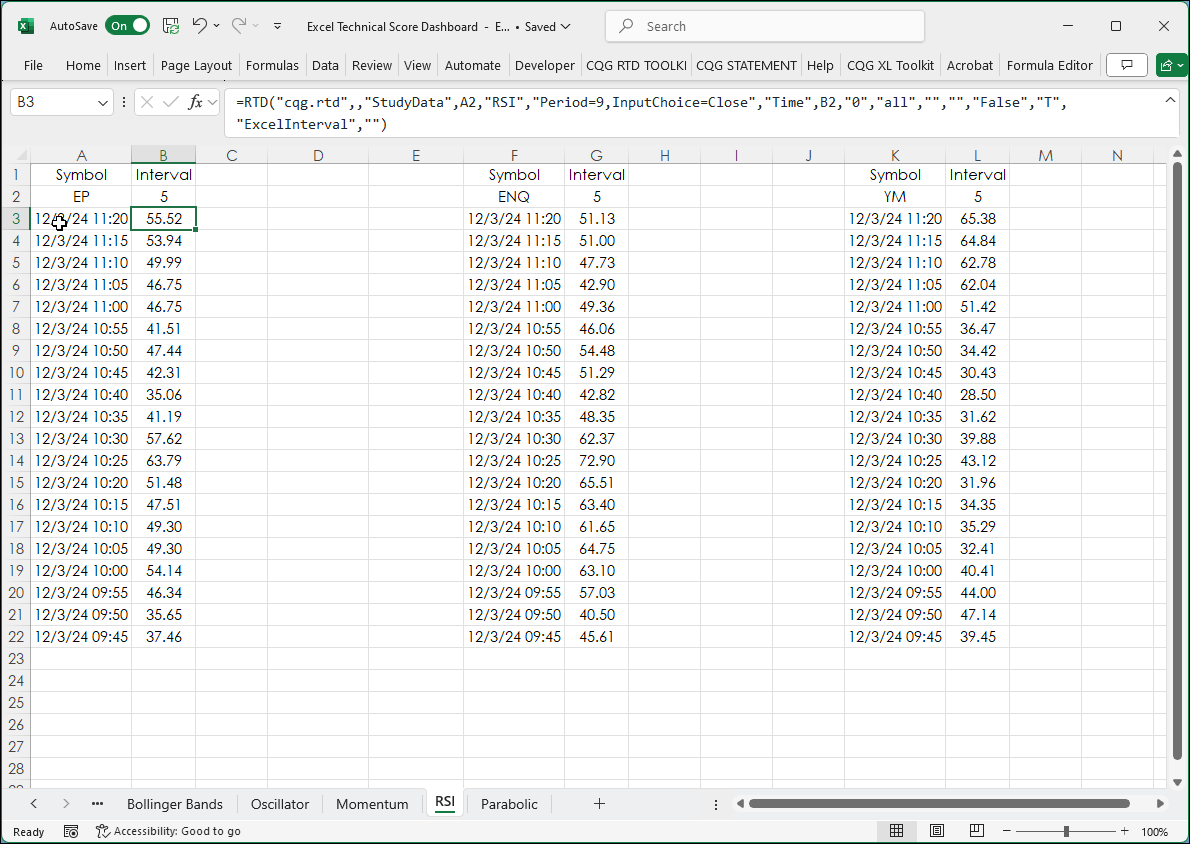
This next image is the RSI tab.
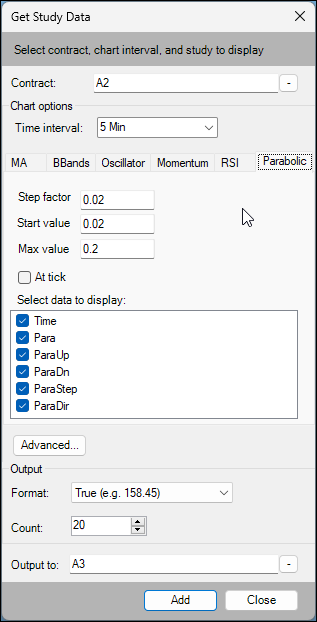
Here is the dialog for the Parabolic study.
For more information on the Parabolic study please review the Help file.
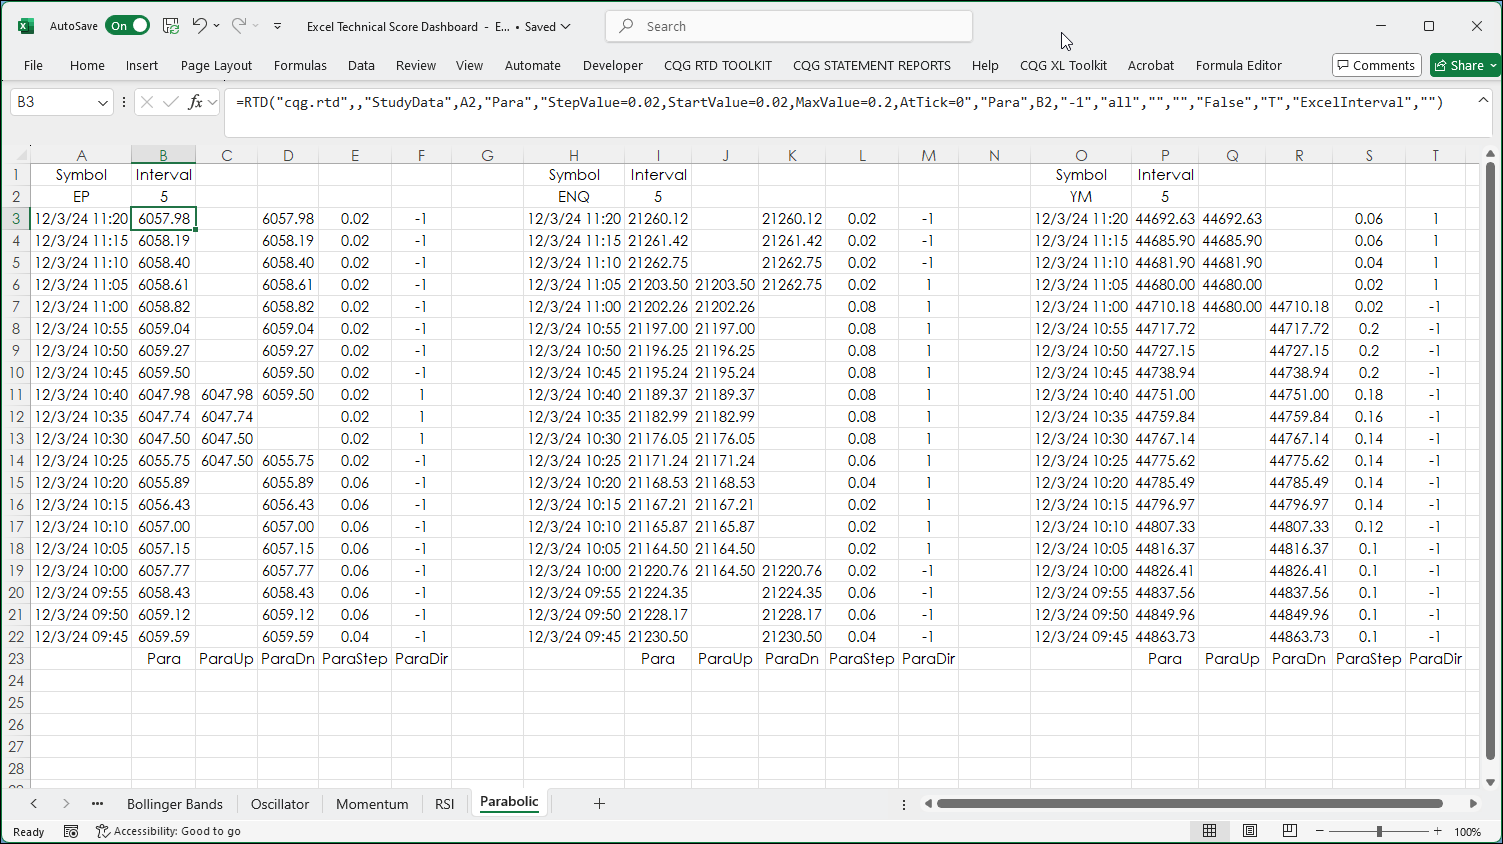
This next image is the Parabolic tab.
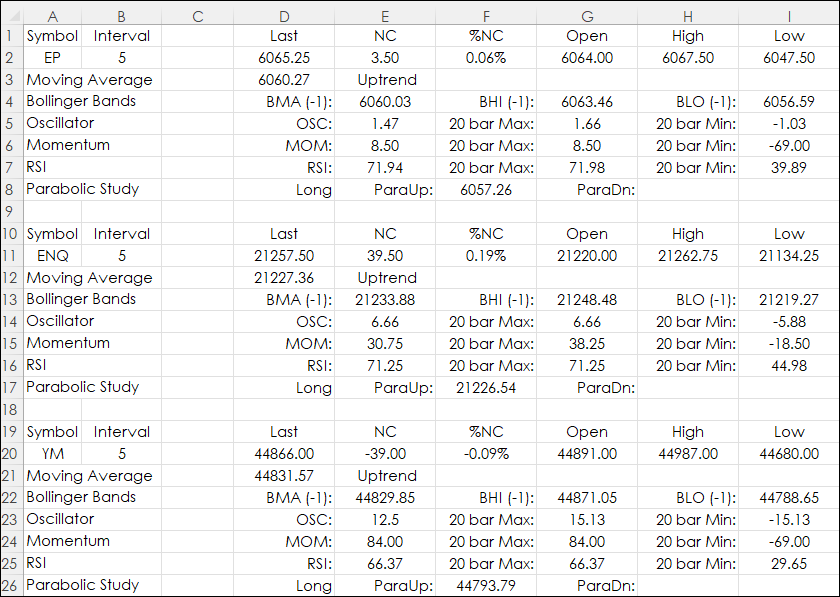
The Main Tab is pulling study values from the other tabs.
You can change the symbol and the time interval. You may have to format prices to the appropriate number of decimals.
If the last trade is above the moving average then "Uptrend" appears next to the MA value, otherwise "Downtrend" appears.
The Bollinger Band values are the values from the previous bar. This will be fixed values until the current bar closes.
The Oscillator, Momentum, and RSI values are the current values and the maximum and minimum values for the past 20 values.
Finally, the Parabolic study indicates the current position is Long or Short and the trailing stop values.
Excel connecting to CQG using RTD formulas can provide a platform for customized dashboards suited to your requirements.
Requirements: CQG Integrated Client or QTrader, and Excel 2016 (locally installed, not in the Cloud) or more recent.

