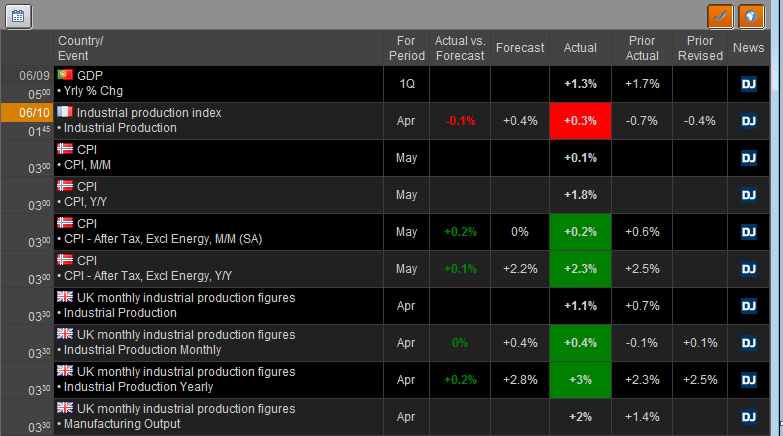
Have you used CQG's new Calendar of Events? The Calendar of Events allows you to track economic releases with a concise calendar. It provides details for key global macroeconomic indicators,… more
Thom Hartle
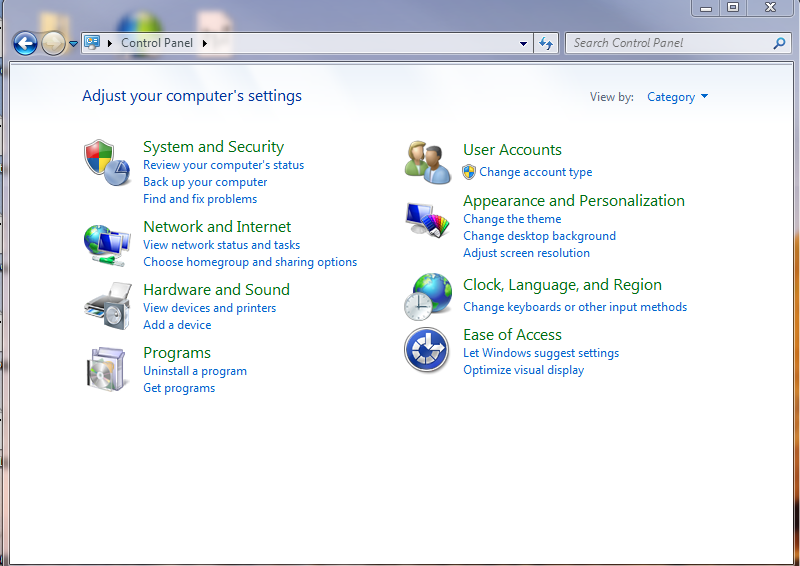
If you use Windows® 7 and have upgraded to Office 2013, you may have noticed that price updates in your CQG-powered Excel dashboards now look like little slot machine quotes with prices rolling… more
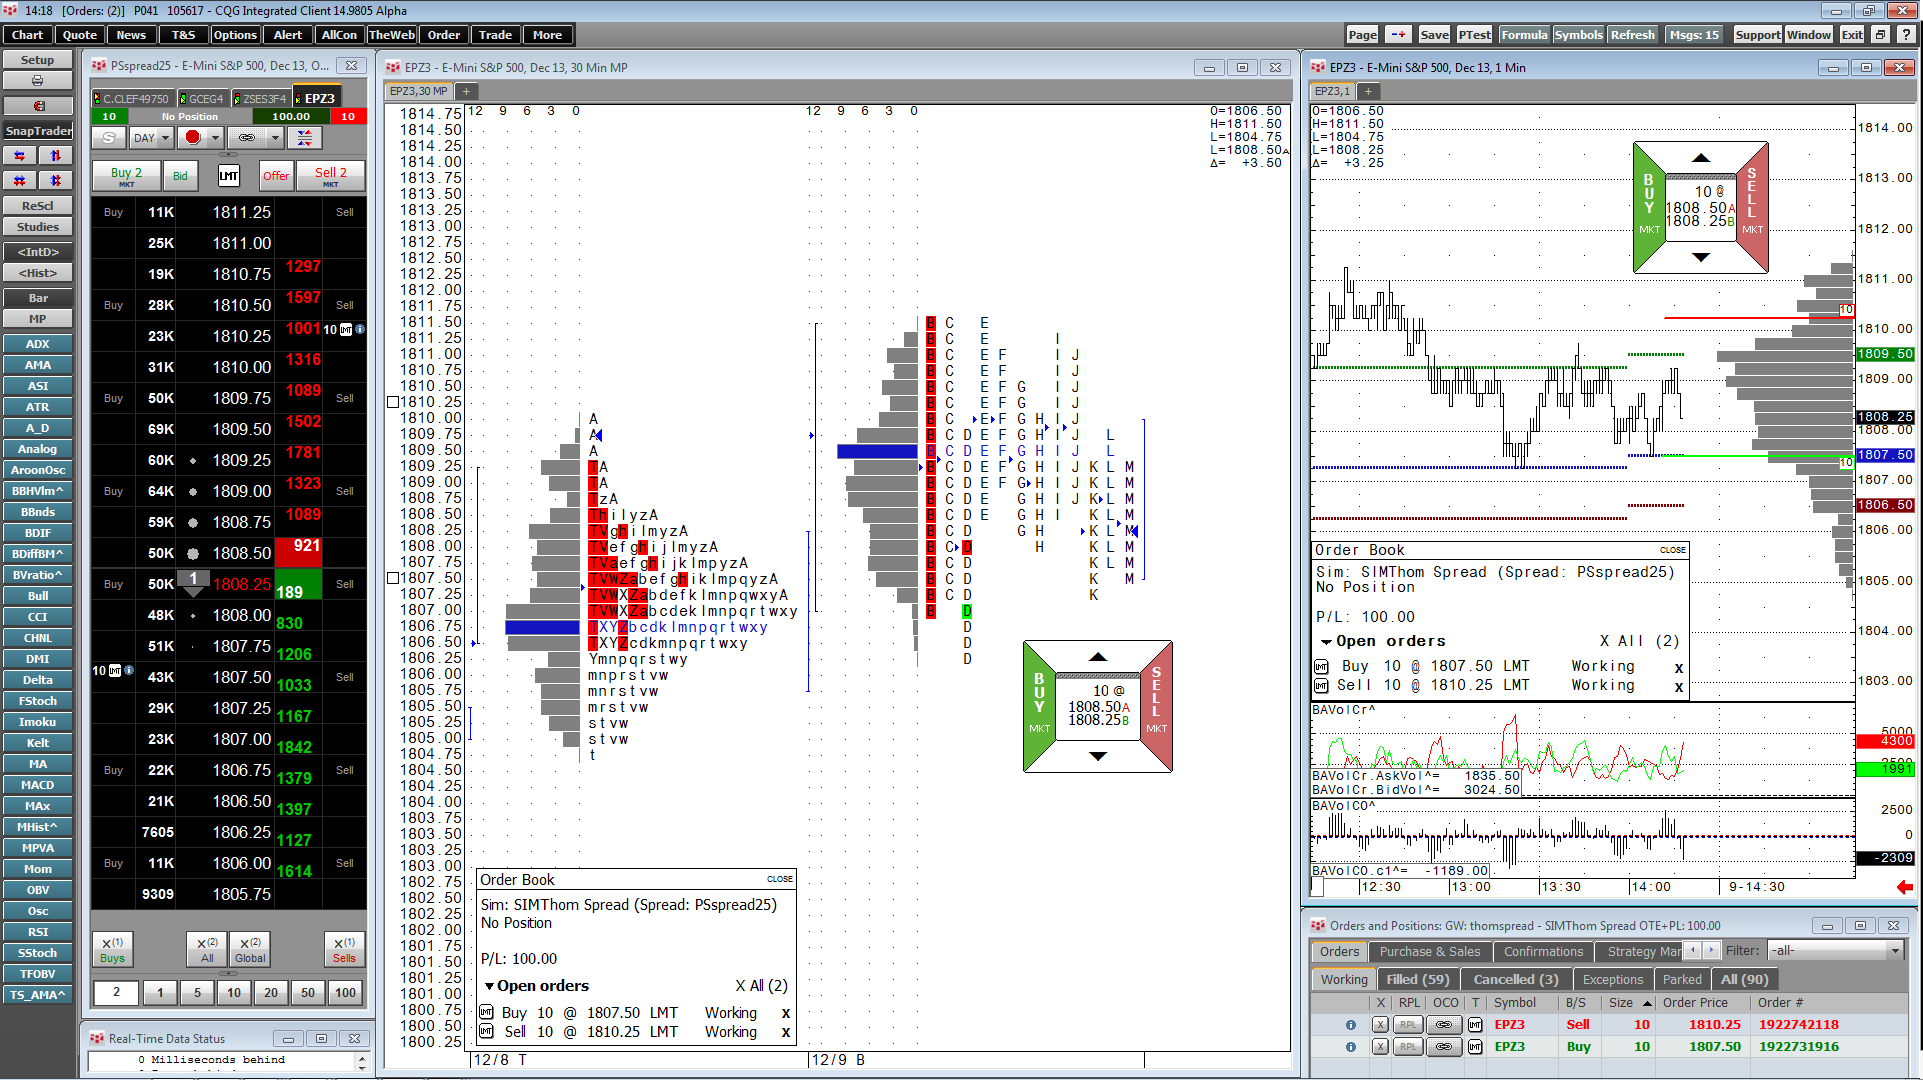
CQG's roots are in the world of market action data. The premise was that traders needed clear and informative market charts on various time frames and would use studies in conjunction with the… more
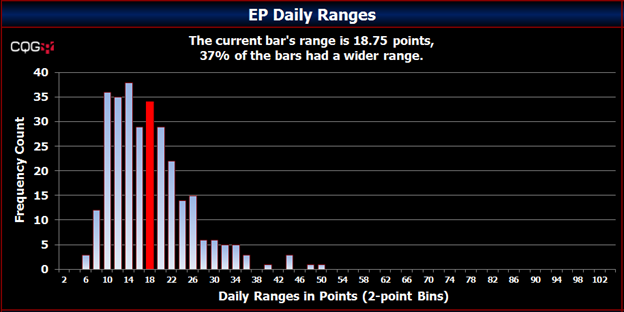
Frequency distribution is simply how often a value appears within a group of values. For example, a group of values is a range from 1 to 5. The collection of numbers is 1, 3, 1, 2, 3, 4, 1, and 4… more
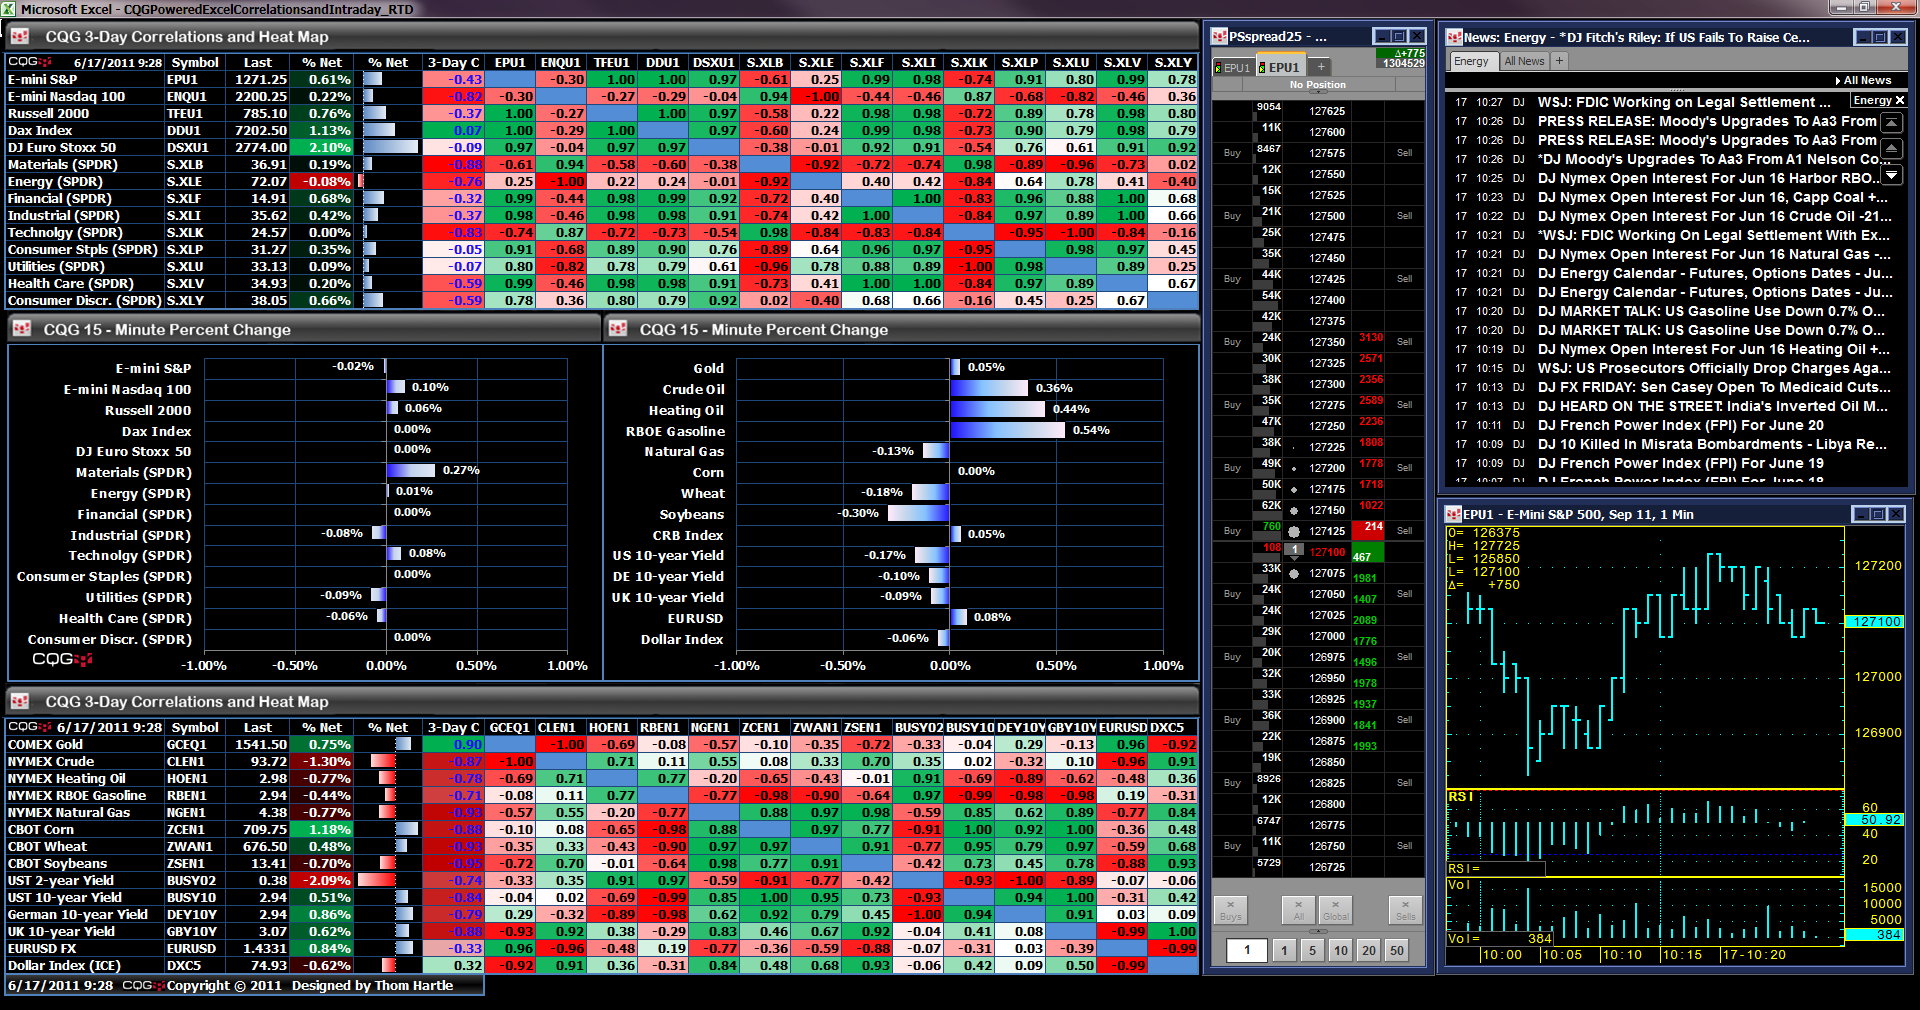
CQG supports the Microsoft Excel RealTimeData (RTD) function in CQG Integrated Client version 8.4 and greater for delivering market data and other information to Excel. Through the combination of… more
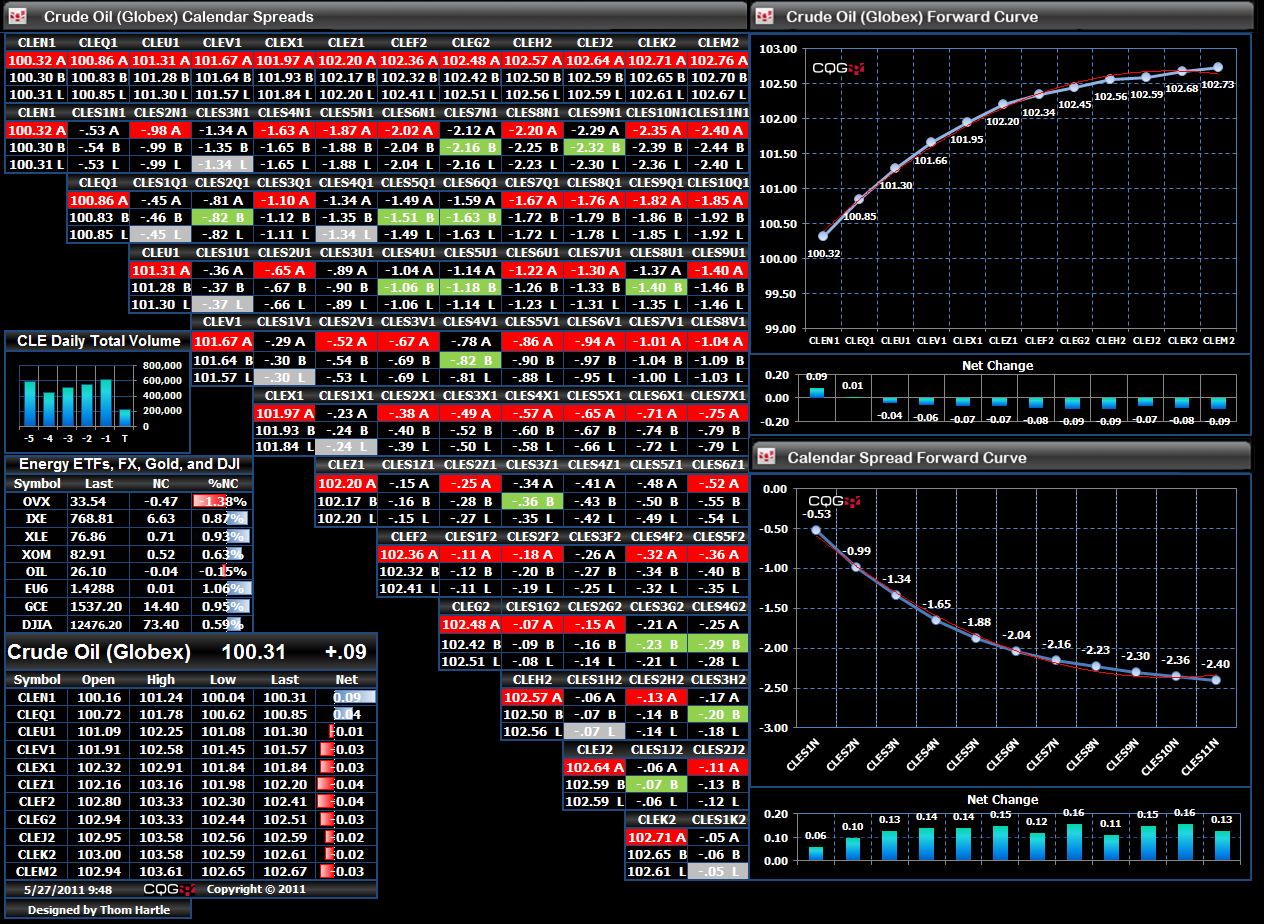
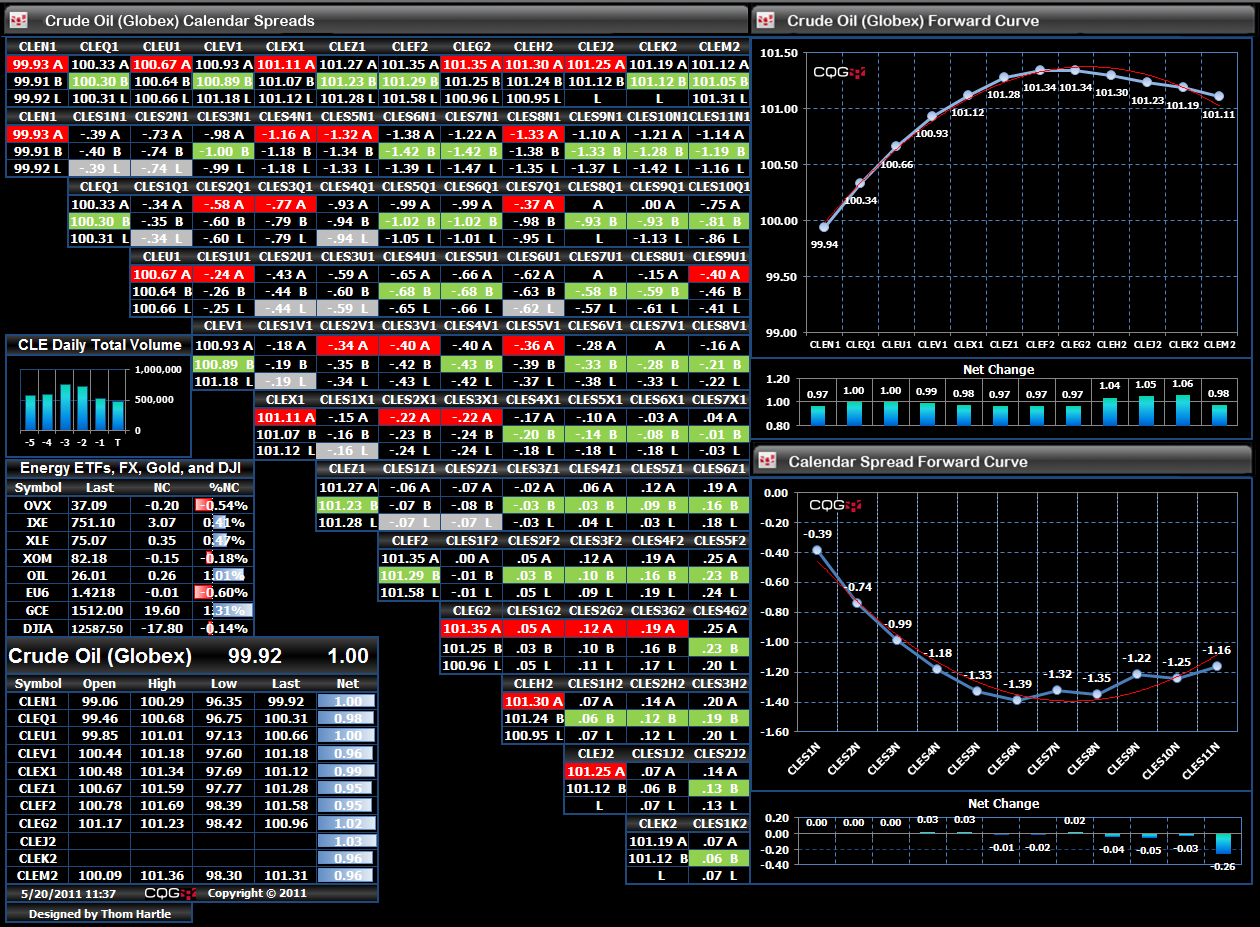
Today, designing Microsoft Excel® spreadsheets can be more than just creating tables with a lot of numbers. As shown here in my columns, you can use conditional formatting such as heat… more
When designing Excel® spreadsheets like the example below, there are a few shortcuts you can use to make the process easier. Here, we will use the CQG Symbol Search and Quote SpreadSheet to add… more
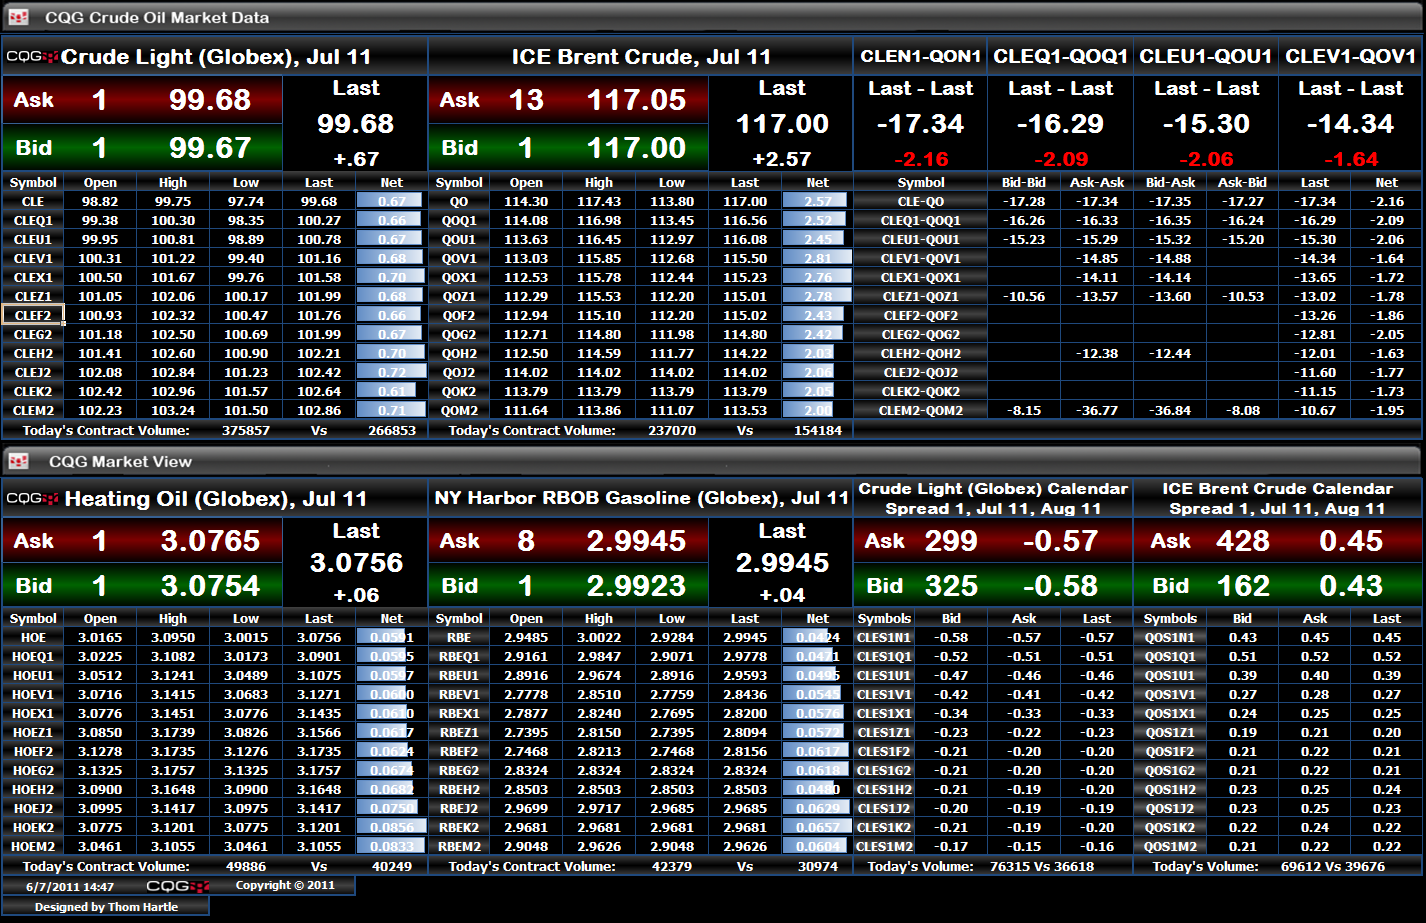
RTD allows you to build elaborate quote displays that go beyond straight market quotes such as spread quotes between two markets. However, with more distant delivery months, there may be instances… more
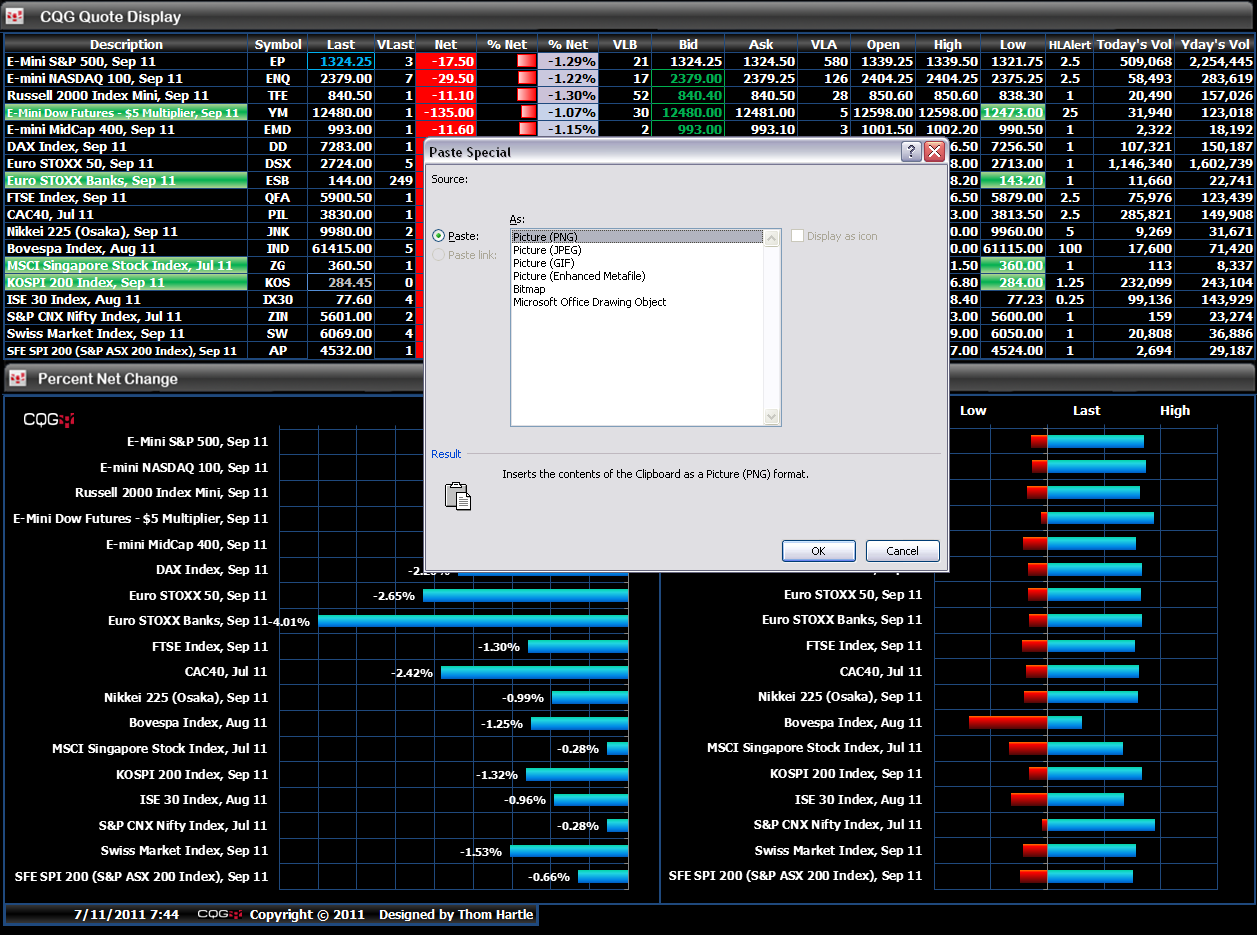
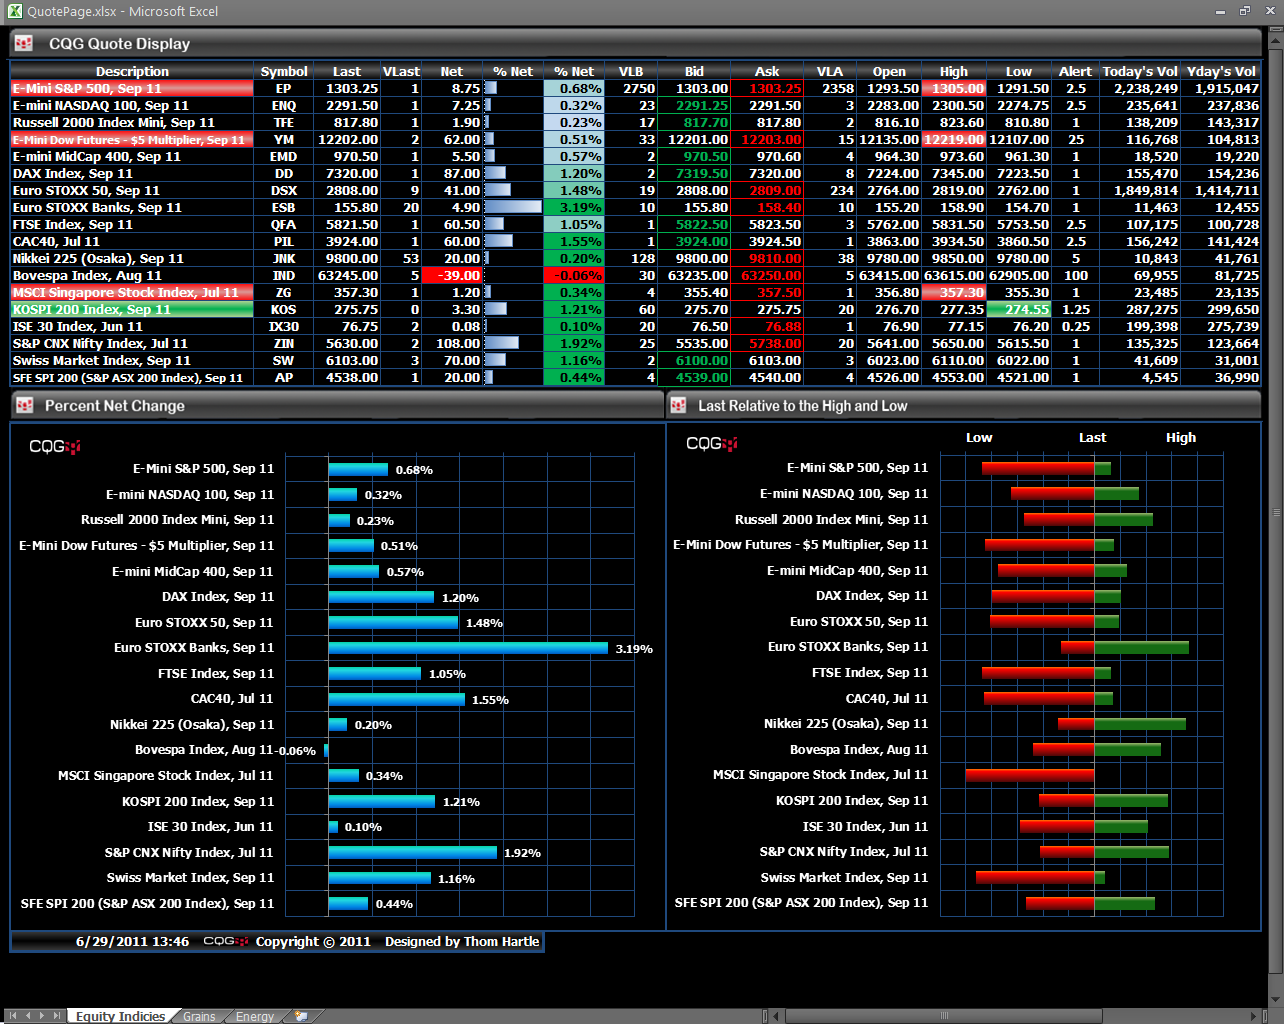
When designing spreadsheets to visualize the markets, it is tempting to title rows and columns, but then you have to scan top to bottom and left to right to identify exactly what you are viewing.… more
One valuable feature in Excel® is conditional formatting. There is a wide array of rules available in the Conditional Formatting group after you select the Home tab in Excel. Here, we will use a… more