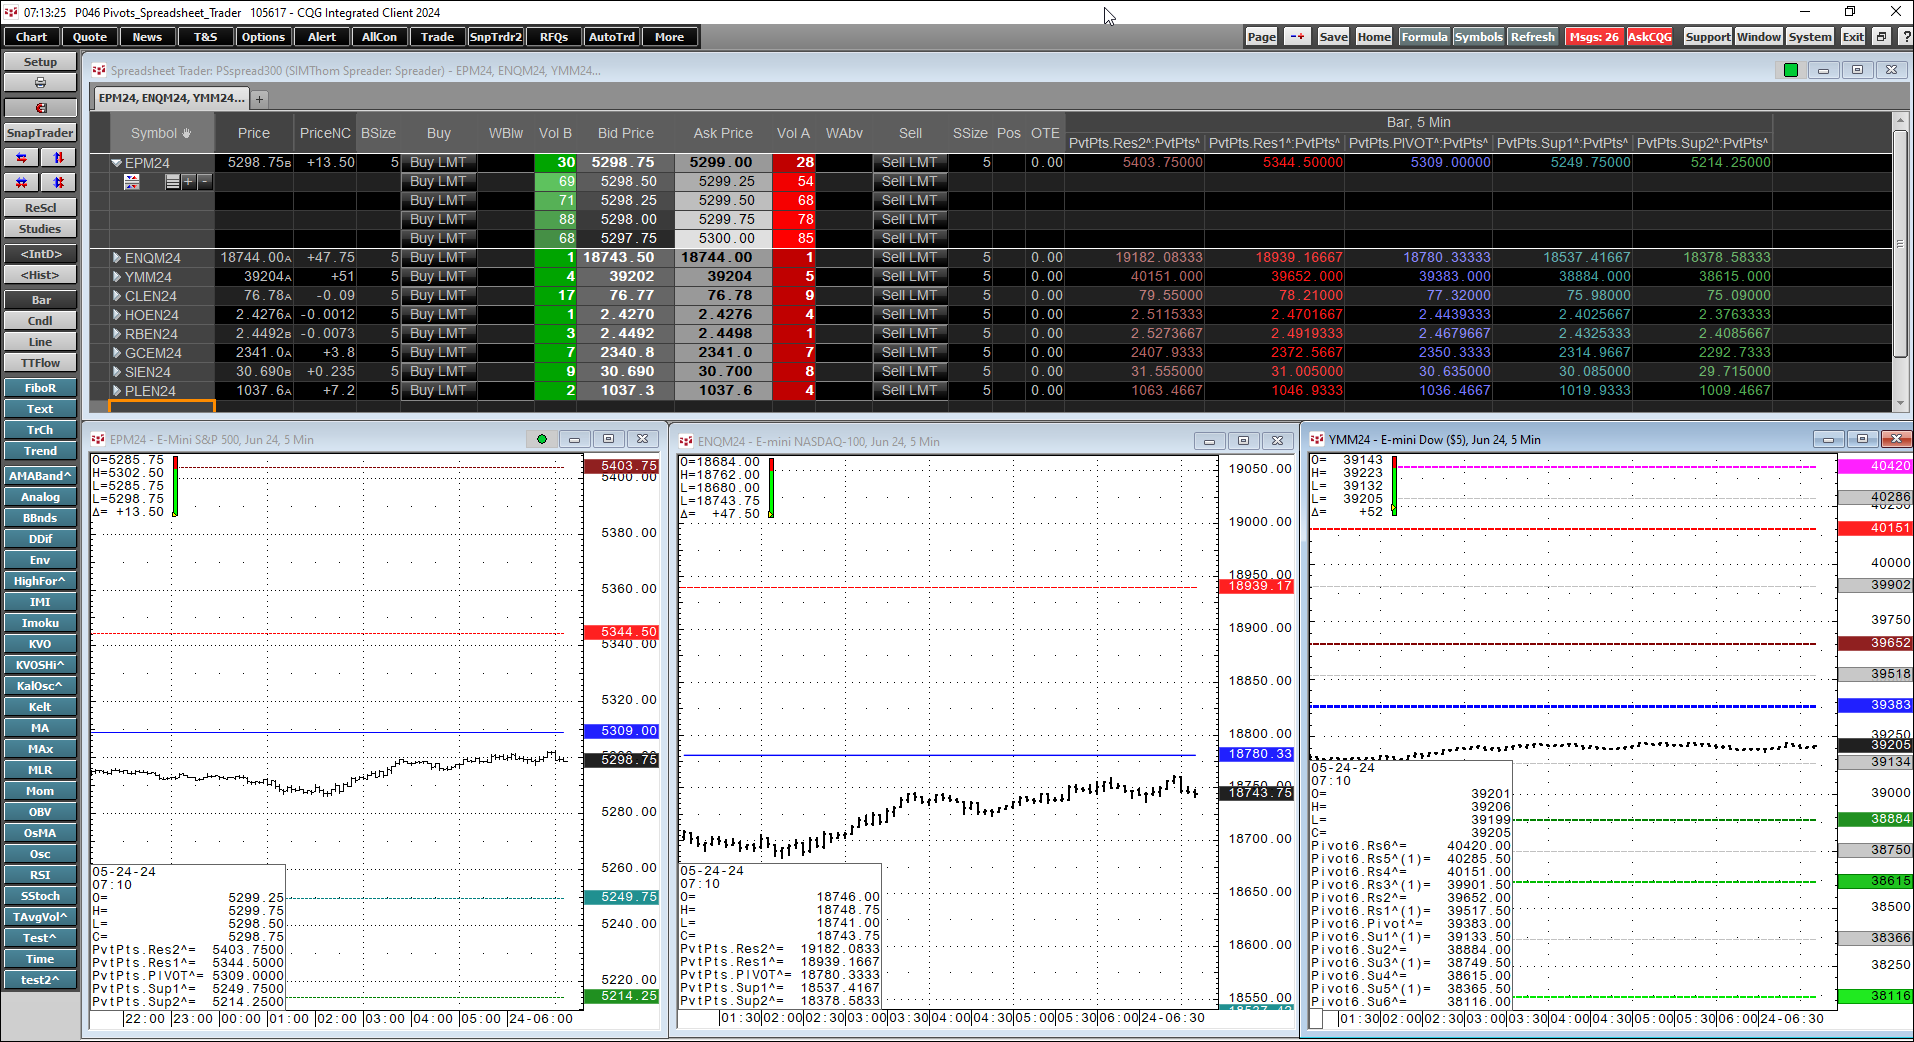
The pivot point is the arithmetic average of the high (H), low (L), and closing (C) prices of the active instrument, Pivot Point = (H+L+C)/3 or Pivot Point = HLC3. The study applied to a chart… more
Workspaces
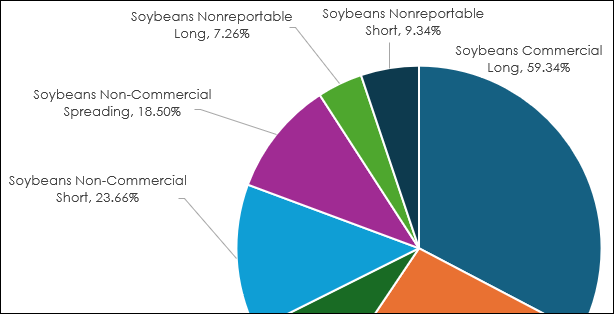
Pie charts are a popular visual presentation used by analysts for detailing a percentage of a whole, with a circle representing the whole and slices representing the categories that make up the… more
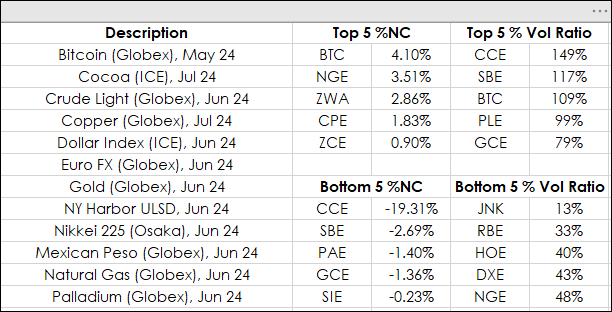
This post presents "how to" rank and sort market data using Excel's SORTBY, CHOOSECOLS, and TAKE functions. This method is a replacement for applying RANK and VLOOKUP functions for ranking and… more
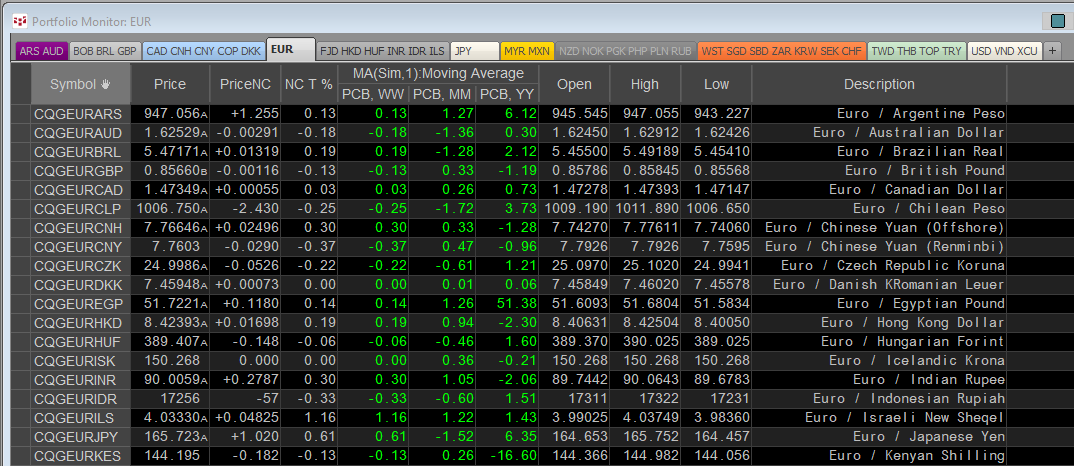
CQG offers institutional pricing data across 430+ currency pairs of market data. Sourced directly from tier-1 banks and non-bank market makers worldwide, the feed provides up to 50 years of… more
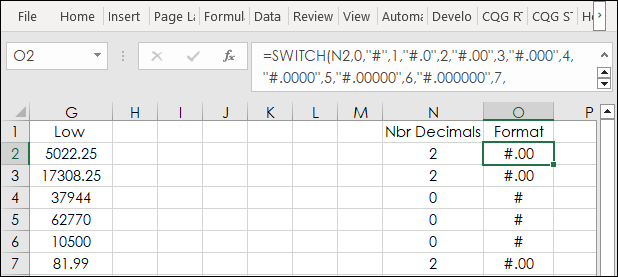
Excel's SWITCH function is similar to Excel's IF and IFS functions and is the topic of this post. First, a review of the IF and IFS functions.
Users of Microsoft Excel may utilize the IF… more
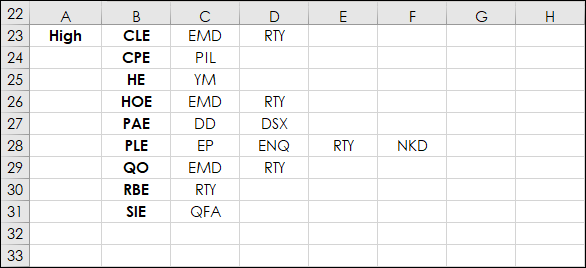
This post details how to extract data from a large array, such as a correlation matrix, to make your workflow more efficient.
First, as the LAMBDA function is used, a brief overview is… more
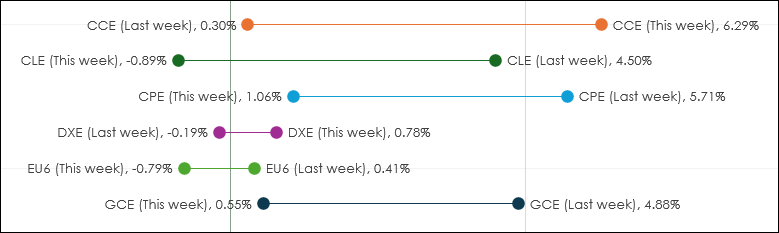
Dumbbell charts have the name due to the look of the data displayed having the appearance of a dumbbell.
In other words, a circle at each end connected by a line. In the image above… more
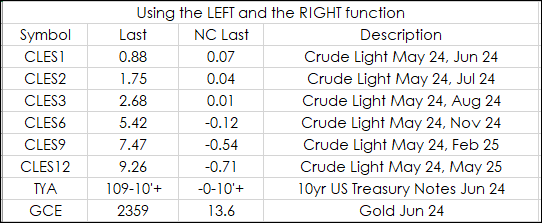
This post offers solutions to parsing data in Excel using string functions. As an example, this RTD formula returns the long description of a Crude Oil calendar spread:
=RTD("cqg.rtd", ,"… more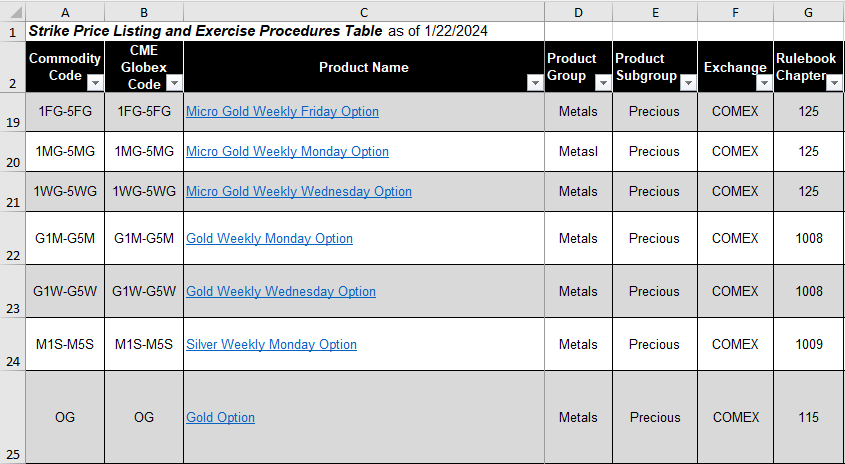
The CME Website has information resources for options traders in the form of downloadable Excel tables with important needed details such as:
Commodity CodeCME Globex CodeProduct NameProduct… more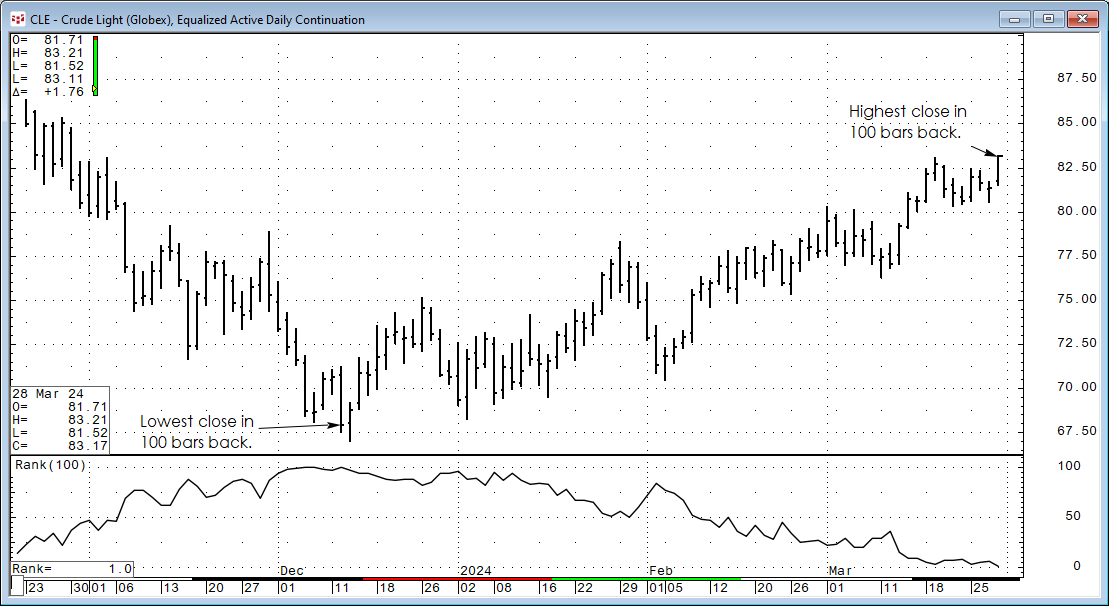
The CQG Rank Study ranks the individual chart points of a market over a specified number of previous trading periods. For example, if the current bar's close had a rank of 3, and the periods were… more