
The CQG Data Quality Team has added over 1,000 USDA Cattle Market reports. The symbols are found under the USDA-WASDE group in the CQG Symbol Finder when searching for Cattle.
Read more
The CQG Data Quality Team has added over 1,000 USDA Cattle Market reports. The symbols are found under the USDA-WASDE group in the CQG Symbol Finder when searching for Cattle.
Read more
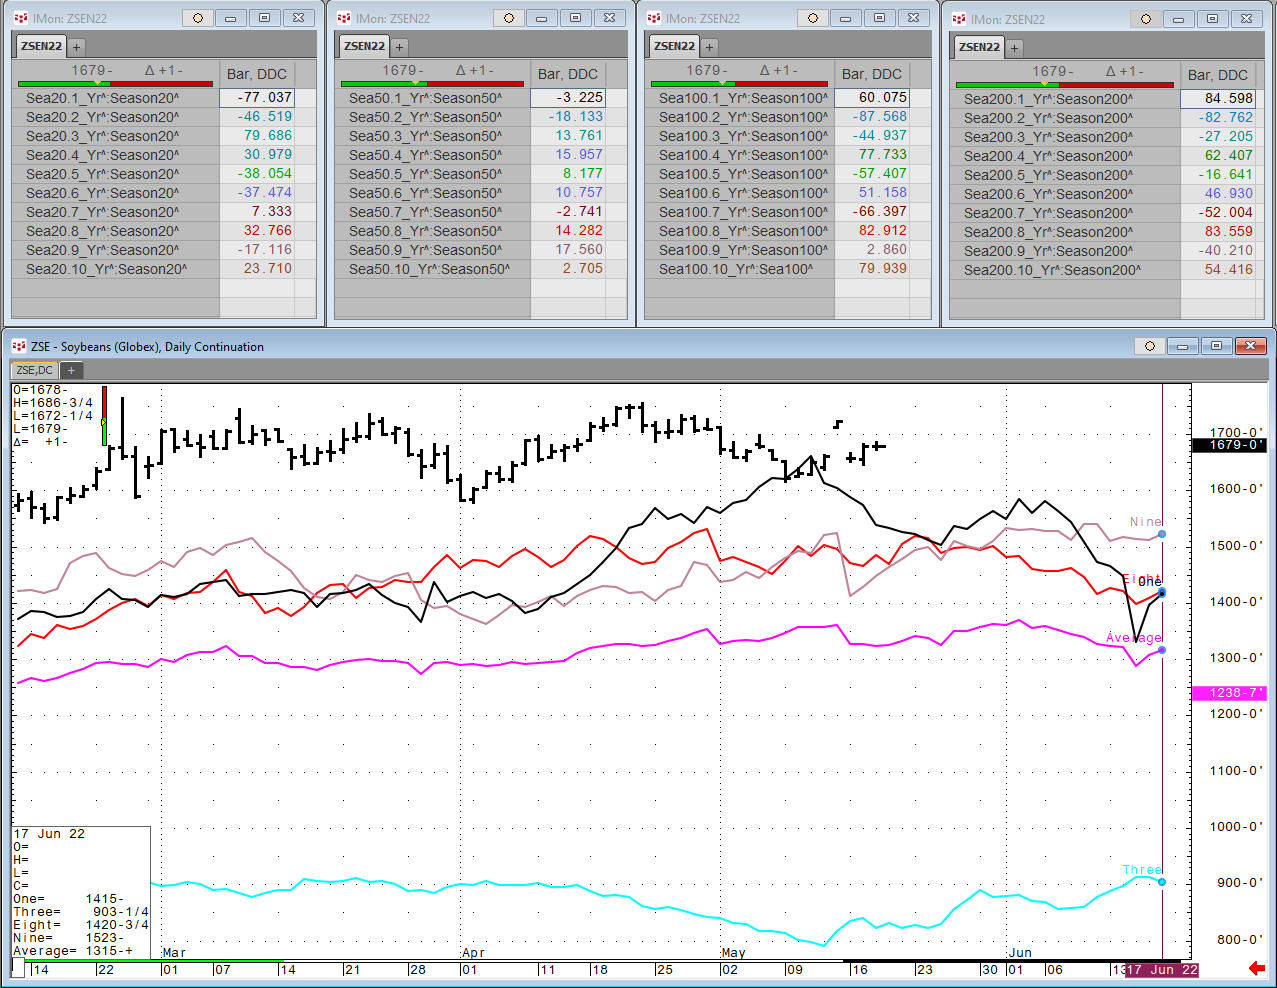
Each Wednesday this article will be updated with the current seasonal study using CQG’s Seasonal analysis applied to the Soybean, Wheat and Corn markets. You can download the CQG pac providing the… more
The CQG Data Quality Team has added over 1,000 USDA Cattle Market reports. The symbols are found under the USDA-WASDE group in the CQG Symbol Finder when searching for Cattle.
In… more
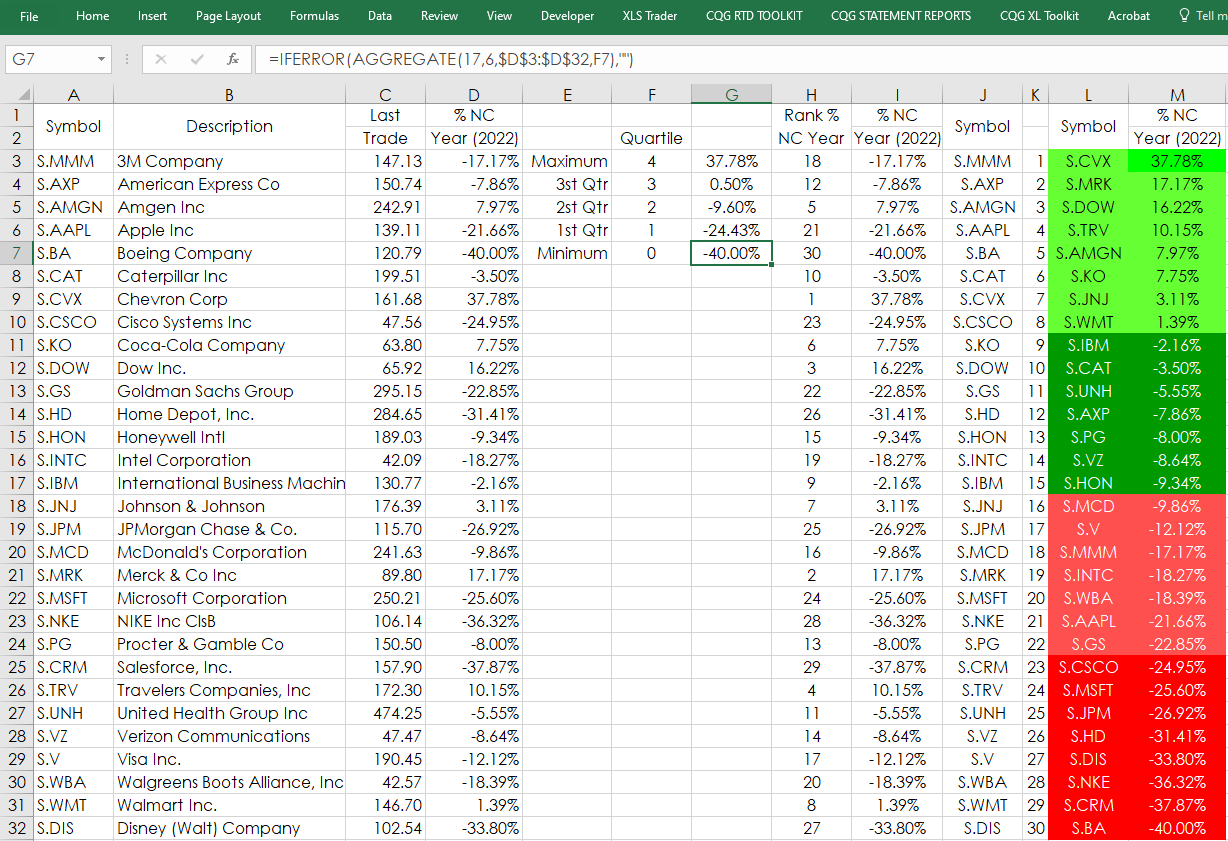
The Excel AGGREGATE function returns an aggregate calculation such as AVERAGE, COUNT, COUNTA, MAX, MIN, PRODUCT, etc., applied to a list of data while optionally ignoring hidden rows and errors.… more
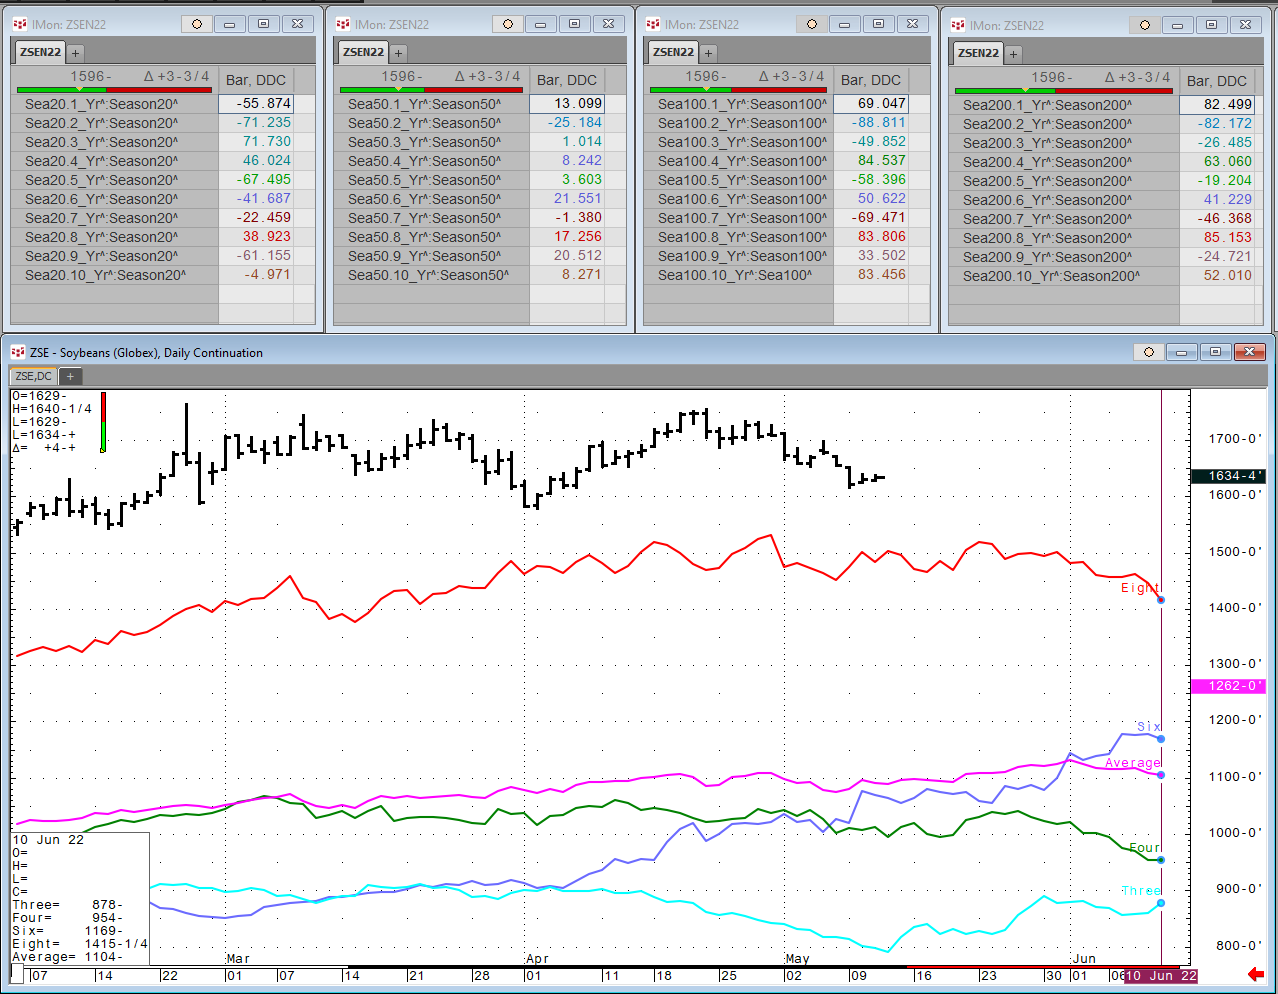
Each Wednesday this article will be updated with the current seasonal study using CQG’s Seasonal analysis applied to the Soybean, Wheat and Corn markets. You can download the CQG pac providing the… more

Dr. Barbara Kolm is the Vice President of the Austrian Central Bank, since 2018. She is also the Director of the Austrian Economics Center (AEC) and President of the Friedrich August von Hayek… more

Petroleum prices continued to rise this week, increasing for the fourth week in six and fifth in nine. US Gasoline
prices set historic highs, closing on Friday at 3.759 per gallon. US… more
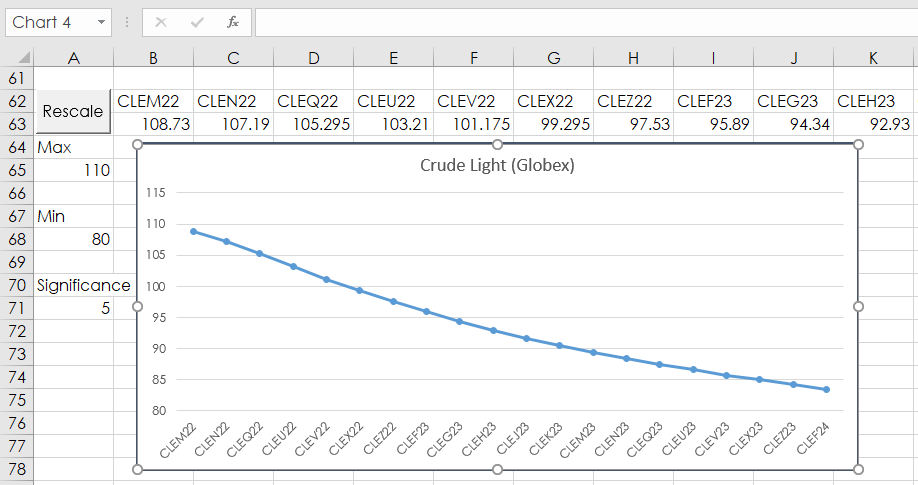
Monitoring market data in Excel may be enhanced by including Forward Curve charts. However, there are issues with Excel charting and the purpose of this post is to offer solutions using Excel… more

Thorsten Polleit is Chief Economist of Degussa and Honorary Professor at the University of Bayreuth. He also acts as an investment advisor.
Yra Harris is a highly respected… more