The CME Group Commentary and Research widgets in CQG Desktop offer articles, videos, podcasts, and daily trends. Stay ahead of the markets and check out what opportunities the CME Group… more
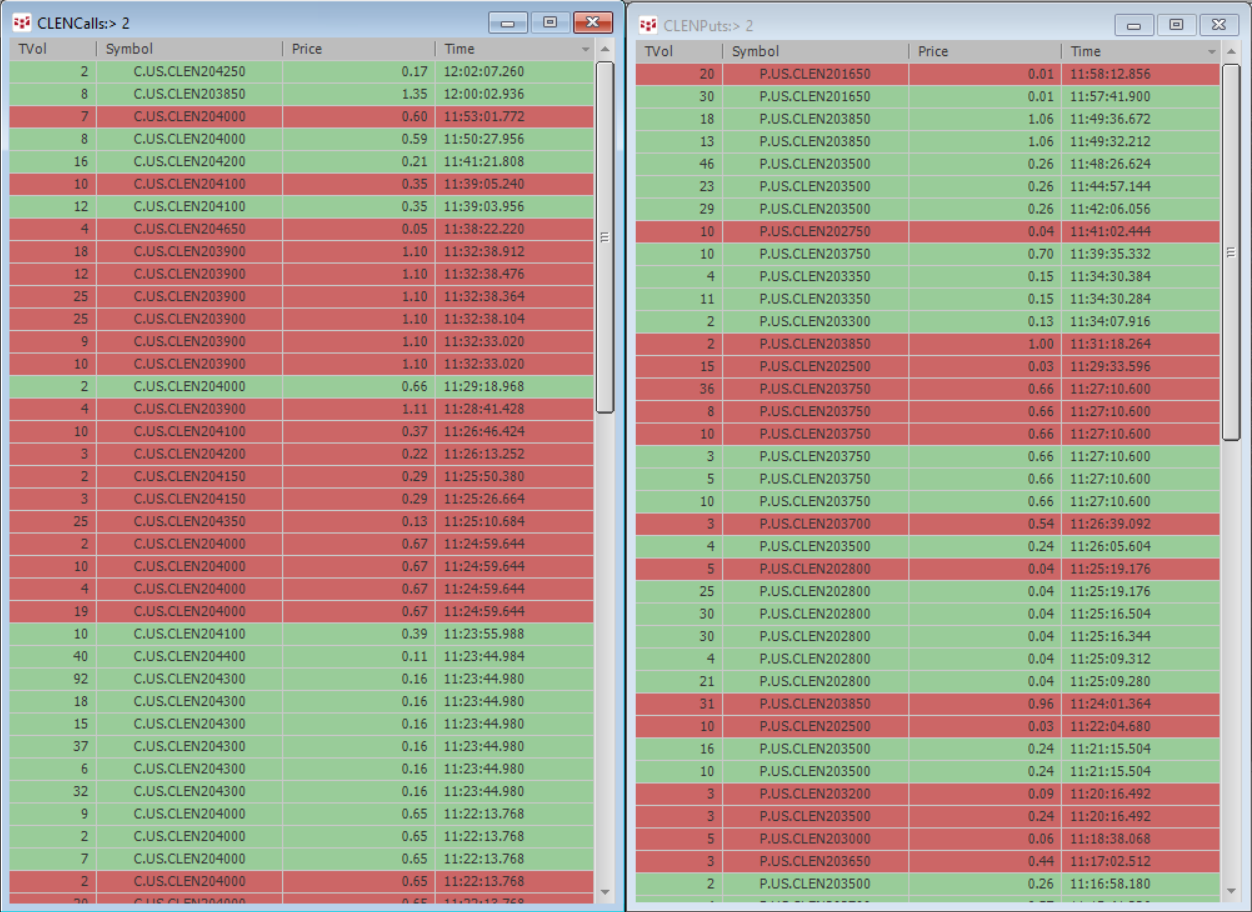
CQG’s Portfolio T&S Monitor displays trades using a time & sales format for a portfolio of instruments. The standard T&S display shows you trading activity for just one instrument.… more
Kevin Darby, BTS Co-Founder and Managing Partner, to Lead Integration, Implementation as CQG Product Manager
CHICAGO / DENVER, June 11, 2020 – CQG, a leading global provider of high-… more
The updated dashboard uses active monthly contracts for the futures rollover. This Excel® dashboard pulls monthly data and provides analysis of user selected markets from 2002 to 2022. The… more
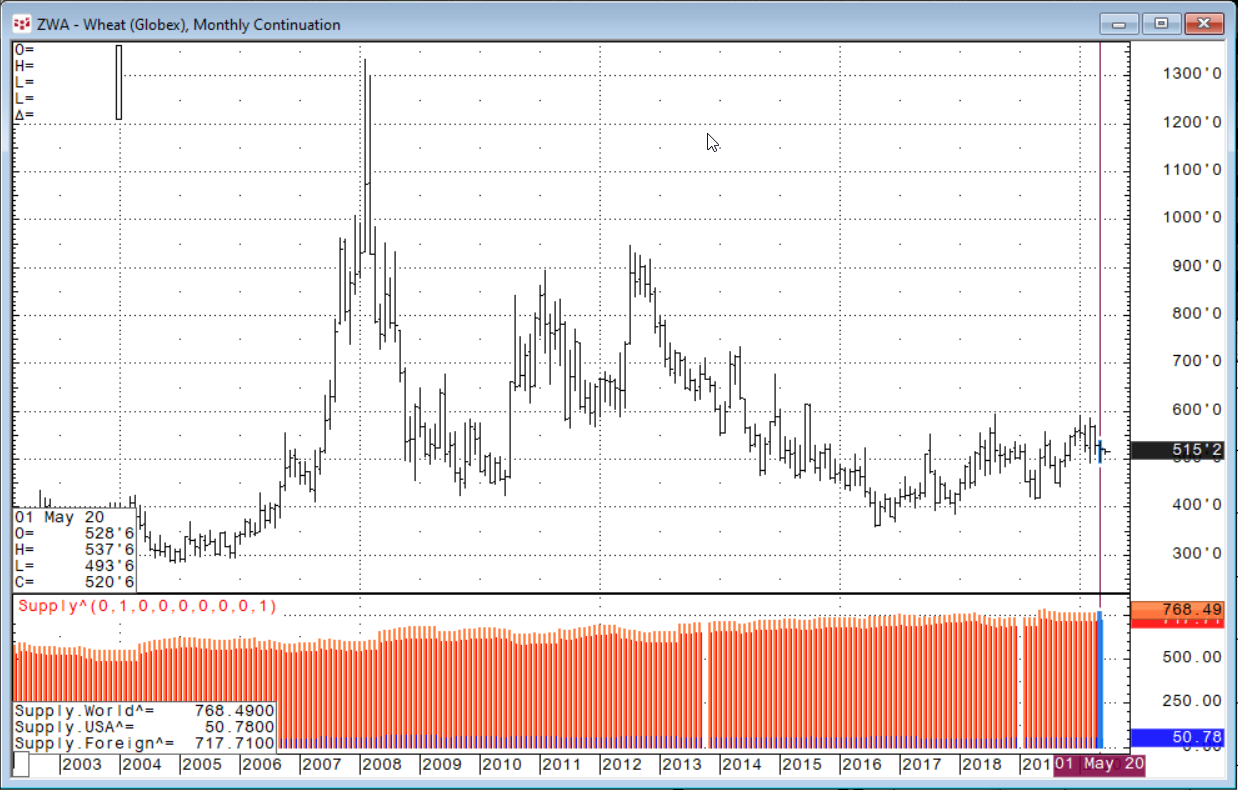
United States Department of Agriculture-World Agriculture Supply and Demand Estimates reports are a critical component to gaining insight into both the international and domestic demand and supply… more
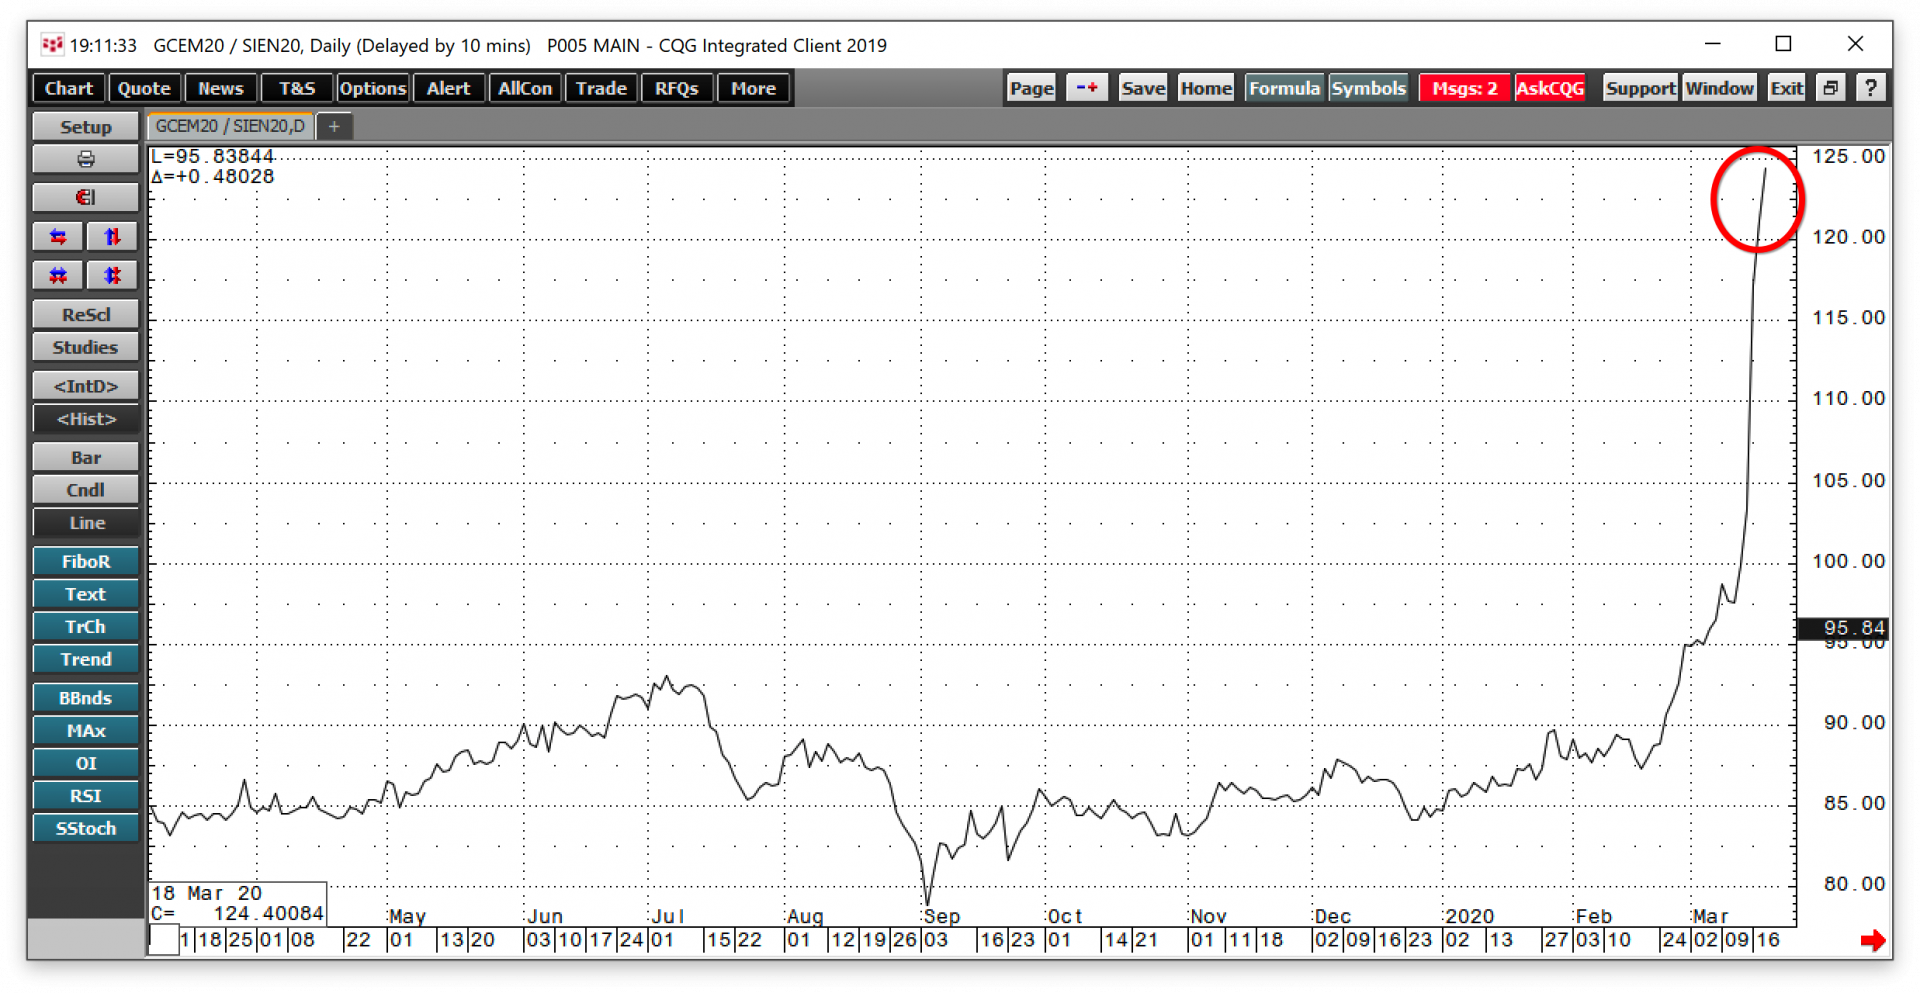
The silver-gold ratio measures the price relationship between the two precious metals. Silver and gold are hybrid commodities as both have long histories as both metals with a myriad of… more
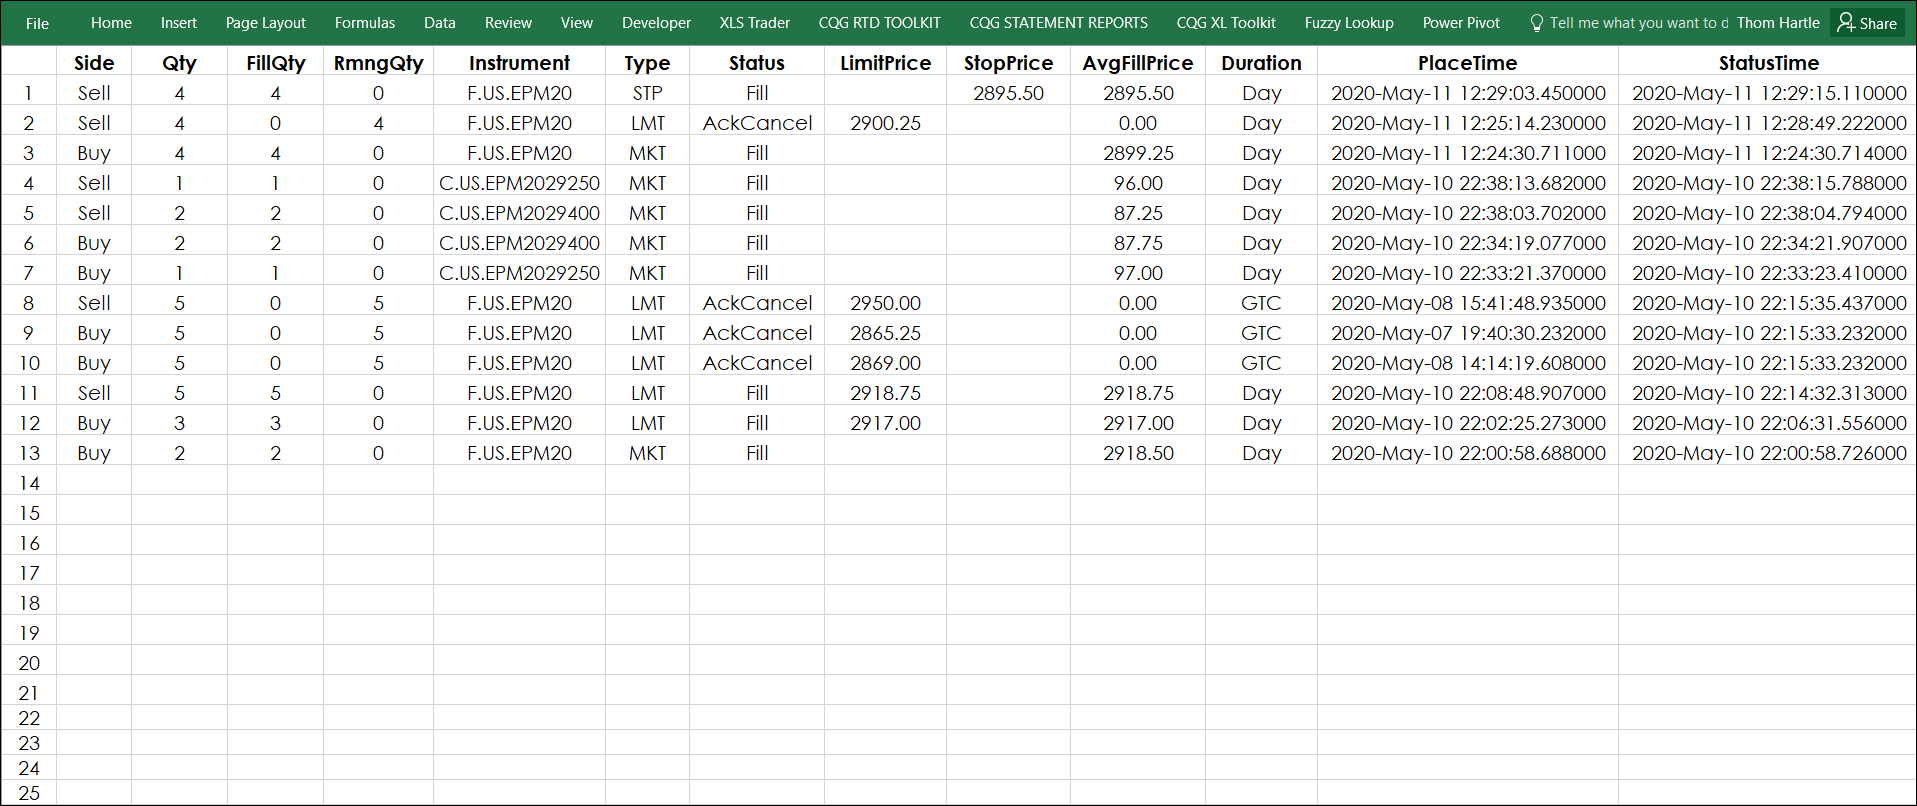
The CQG XL Toolkit Add-In for Microsoft Excel® pulls today's market data, orders data and open positions data into Excel via the Internet. Historical data is not available. CQG products do not… more
