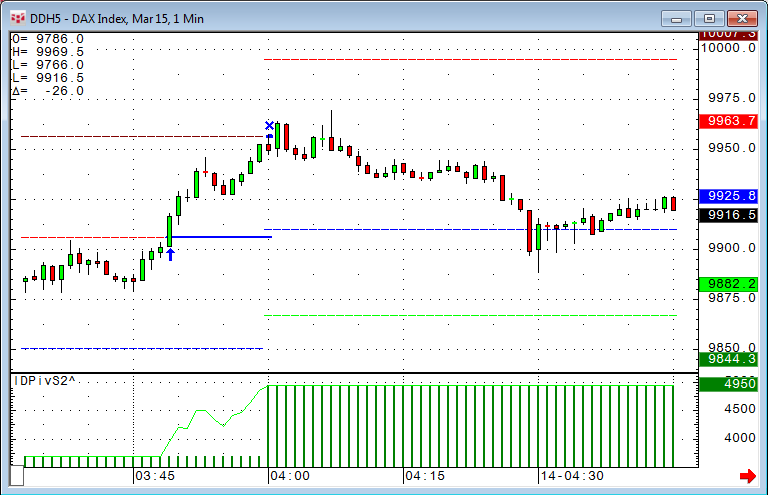
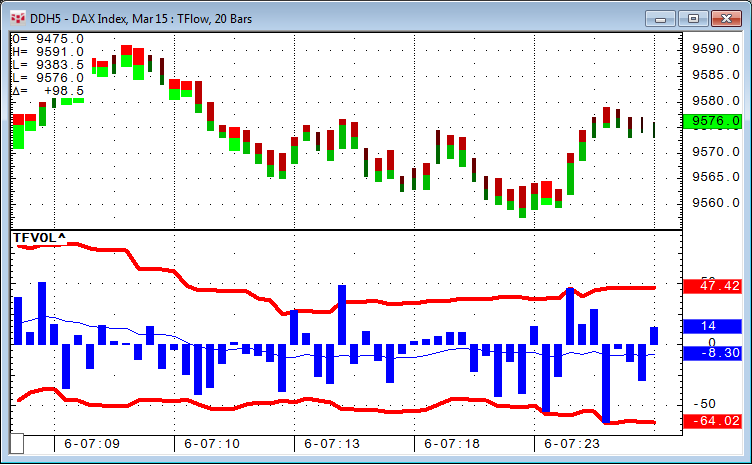
In this article we take a look at two examples where trades are placed on or around significant lines. The first idea is to change the classic daily pivot lines into intraday pivot lines and trade… more
Today's Lows are Tomorrow's Highs
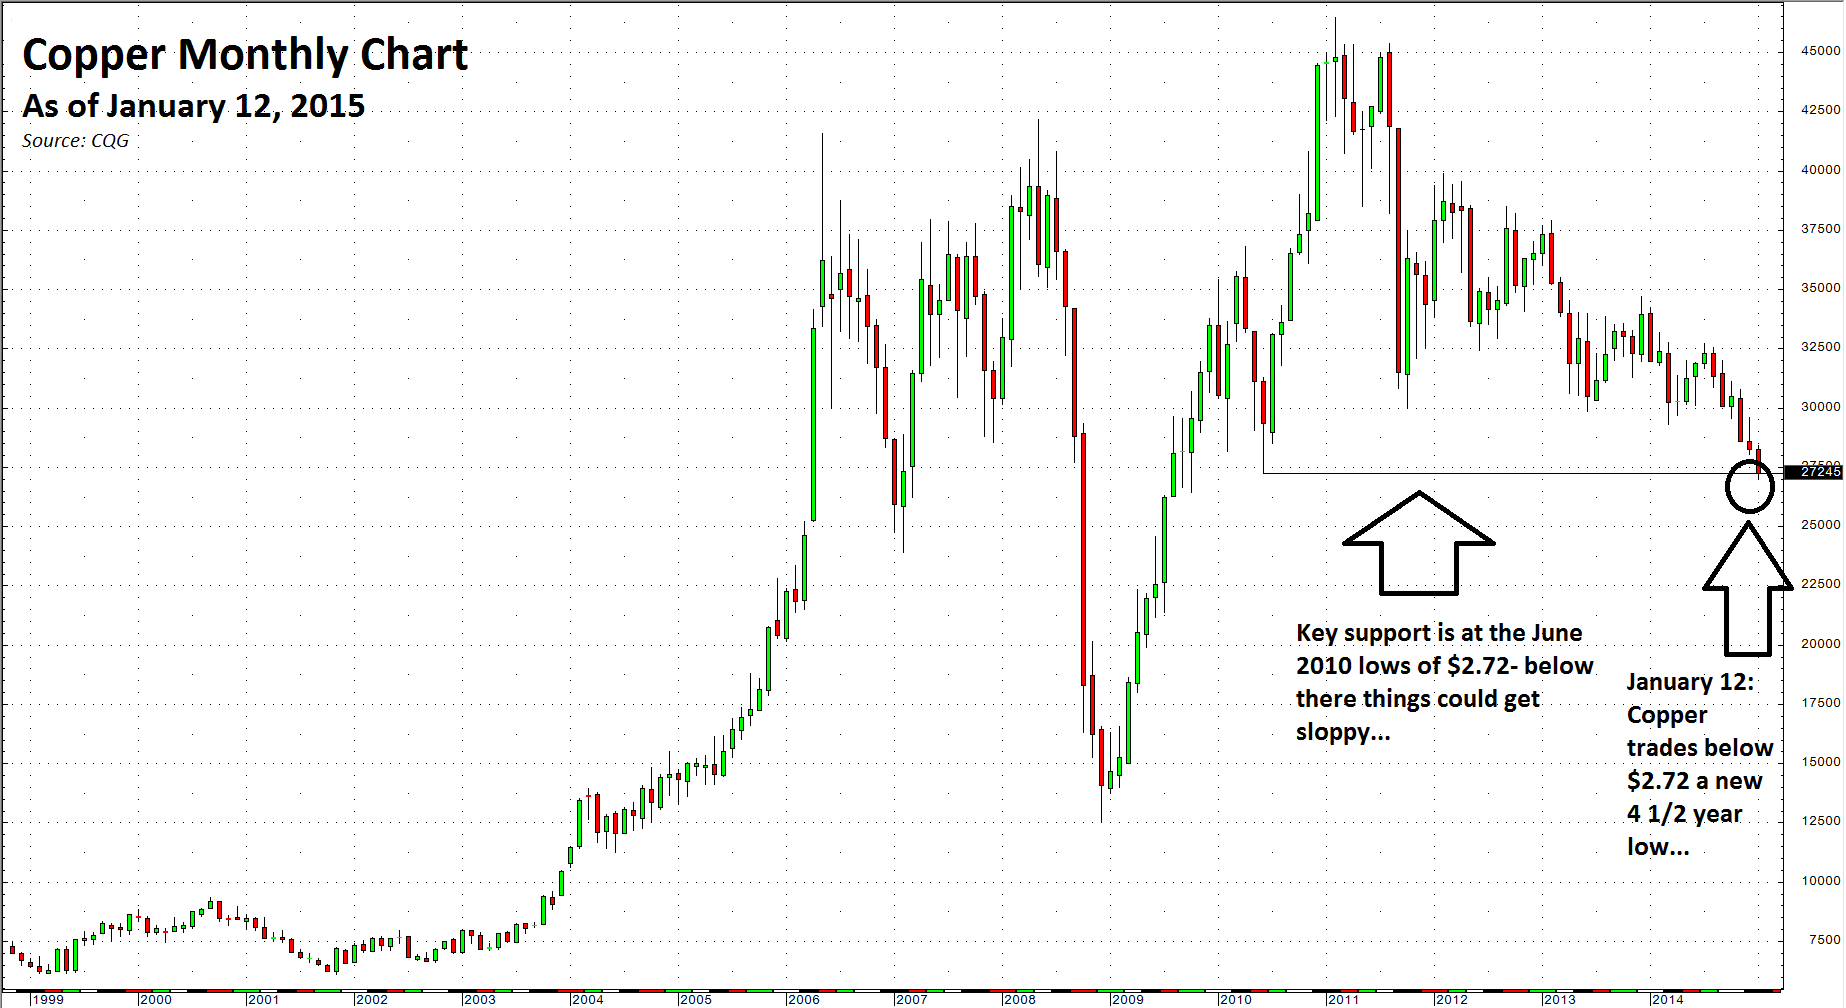
Copper fell 15.78% on COMEX and 14.59% on the London Metal Exchange in 2014. Copper has been making lower highs and lower lows since July 2014. The copper… more
This Microsoft Excel® spreadsheet uses a horizontal DOM display with FX-style formatting of the best bid and best ask for three markets along with bar or sub-minute charts. The fourth display is a… more
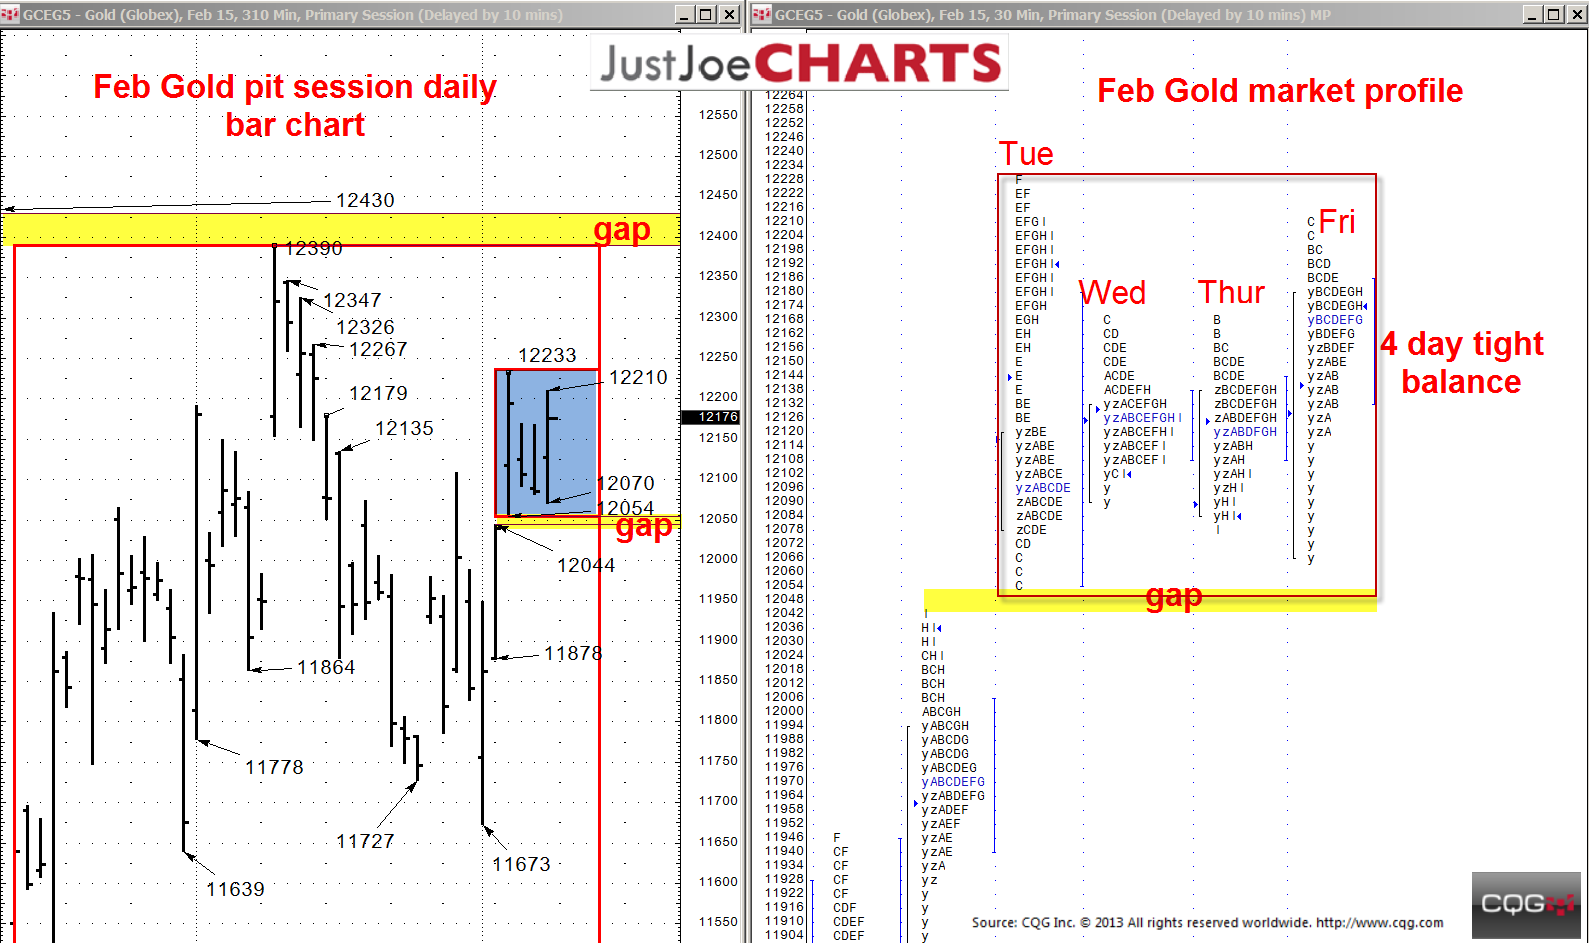
Over the past two months, February gold has been rotating within a 11469-to-12390 balance range. However, over the past four trading days, gold was confined to a relatively tight 12054-to-12233… more
Gift will support Department of Finance students studying derivative markets
Montreal, January 12, 2015 -- A major gift from data analytics and trading technology provider CQG will further… more
As of January 1, Russell Cash Indexes became a separately billed enablement. ICE Futures US no longer includes these cash indexes, although it will continue to include Russell Index futures.
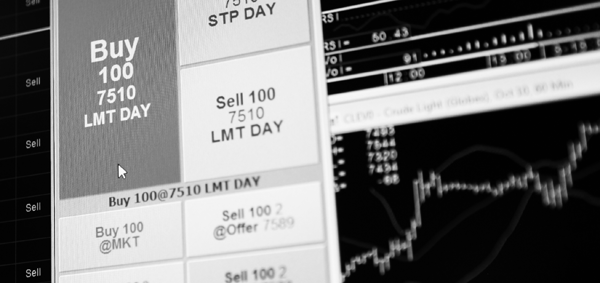
… moreRecently, we had a request to show, in real time, how many contracts are available on the buy and sell side in the order book. This can be accomplished with a very simple study: DOM Ask Volume (… more
This Microsoft Excel® spreadsheet uses a quadrant format to display correlations. For each quadrant, you can enter five symbols for the horizontal axis and five symbols for the vertical axis. You… more
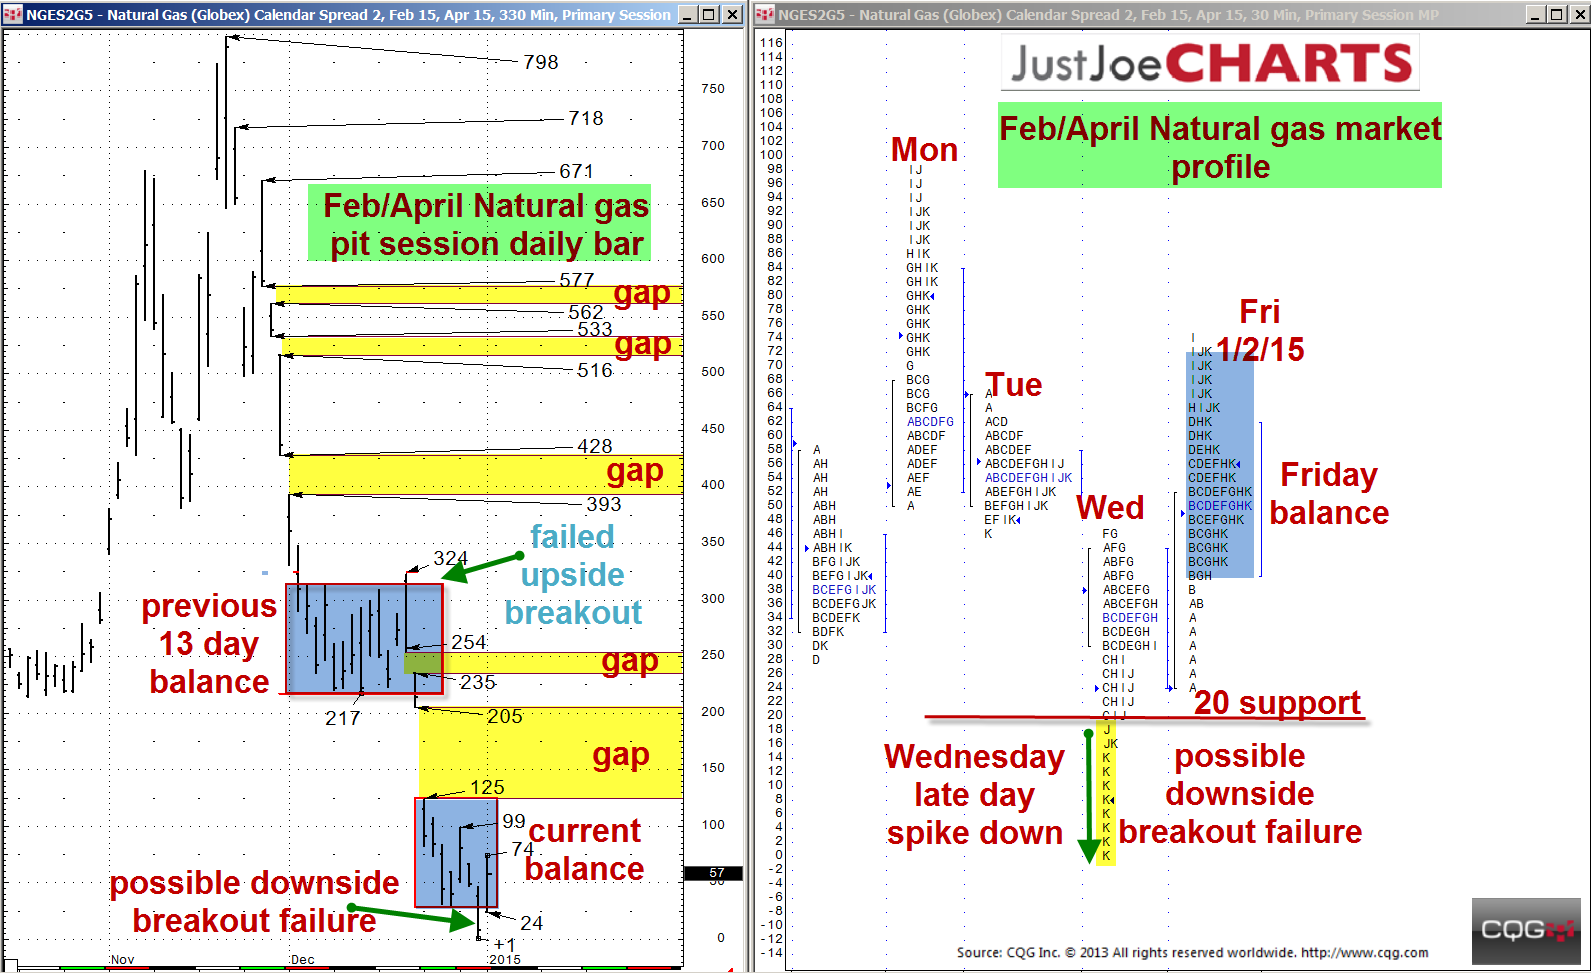
Over the last thirty trading days, the February/April natural gas spread has come off sharply about 800 points, leaving several gaps along the way. A few weeks ago, after the spread fell about 500… more
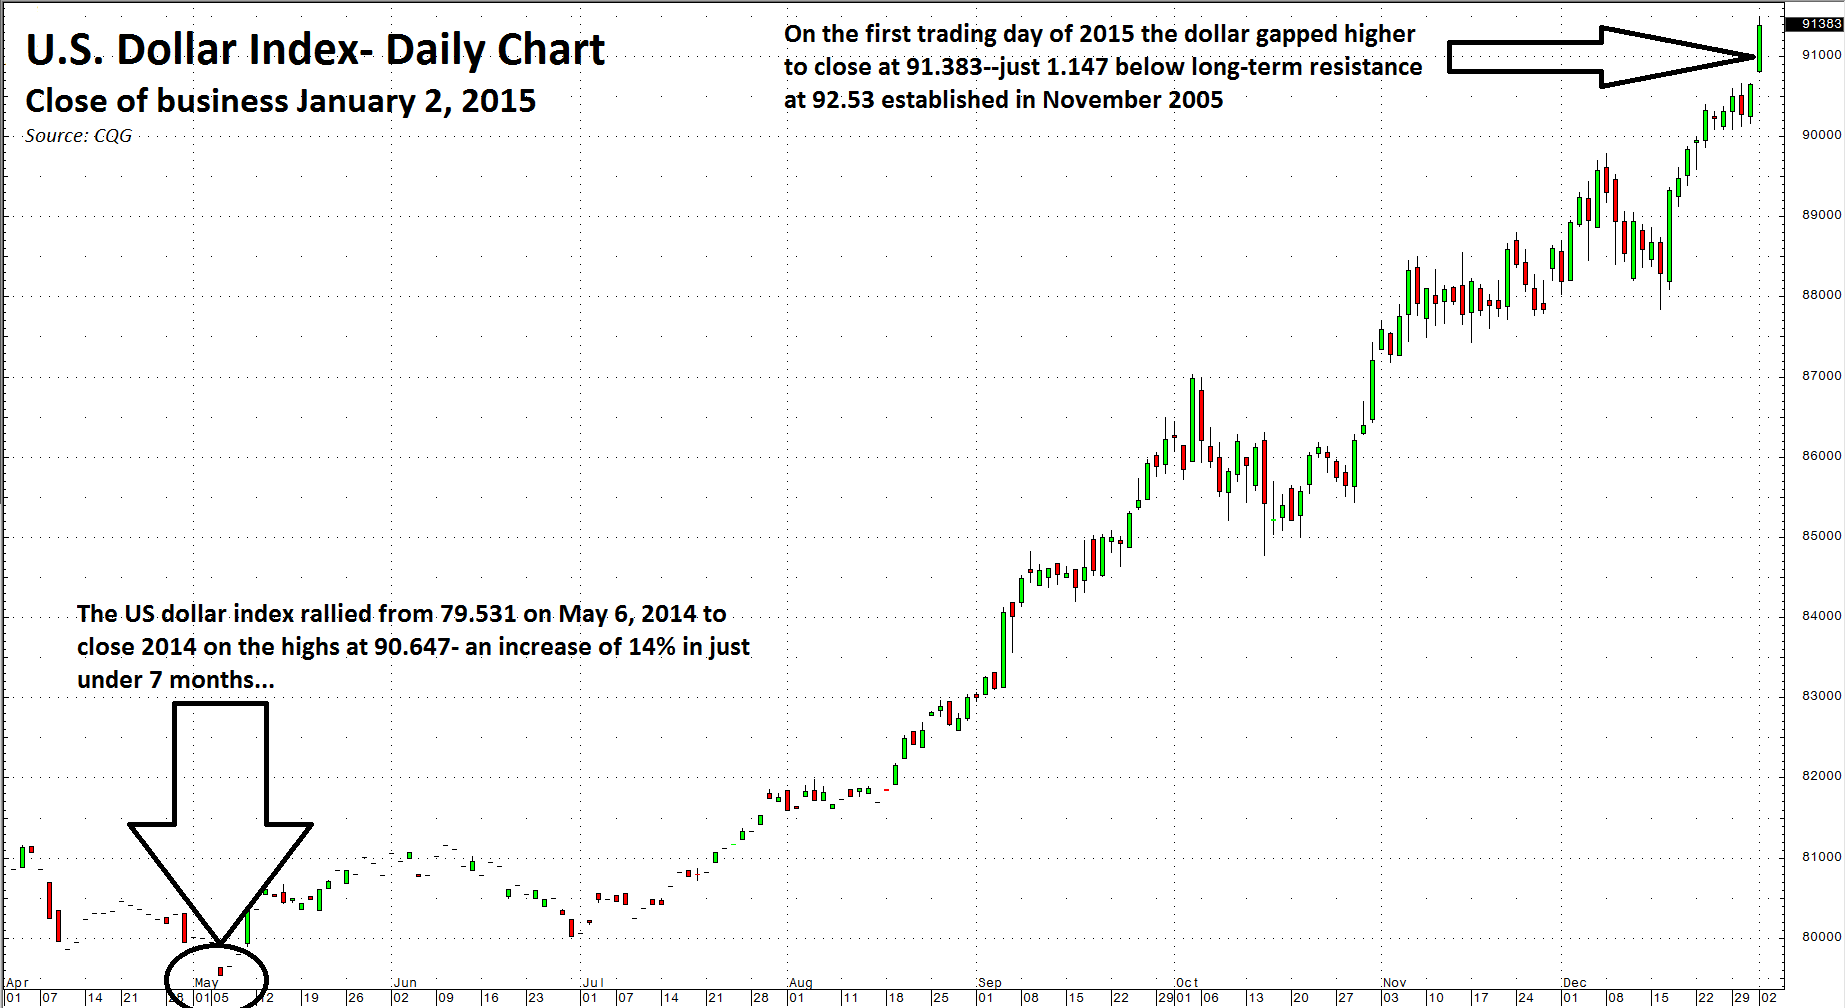
The dollar is still the world's reserve currency and there is an inverse relationship between the greenback and commodity prices.
The Dollar and Commodities
In 2014, the dollar was a… more
