In this article we take a look at two examples where trades are placed on or around significant lines. The first idea is to change the classic daily pivot lines into intraday pivot lines and trade on them.
This is the classic pivot study that is found under the Formula Builder window on the Custom Studies tab in CQG Integrated Client:
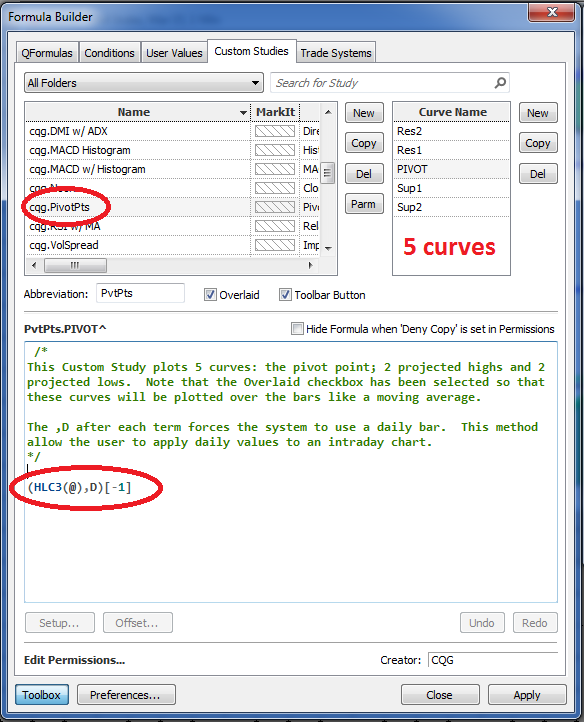
The curves are:
- Pivot: (HLC3(@),D)[-1]
- R1: (2 * (HLC3(@),D)[-1]) - (Low(@),D)[-1]
- R2: (HLC3(@),D)[-1] + (Range(@),D)[-1]
- S1: (2 * (HLC3(@),D)[-1]) - (High(@),D)[-1]
- S2: (HLC3(@),D)[-1] - (Range(@),D)[-1]
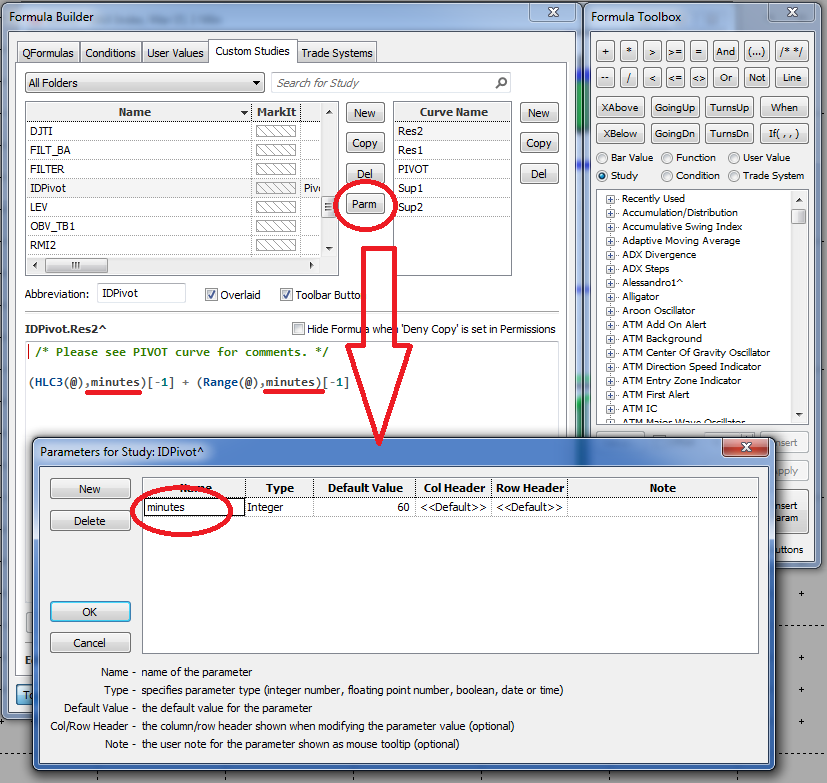
In order to change them into the intraday version of the pivot lines, we create a copy of the CQG Pivot Study and call it IDPivot, for example. In order to have the choice of different time periods, we need to create the parameter "minutes" and substitute all ",D" values in all the curves into ",minutes."
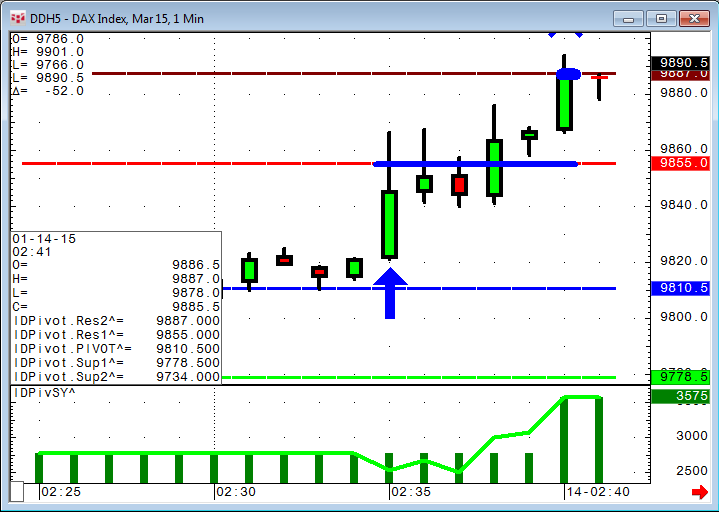
With the parameter minutes for example at 60, it takes the (High + Low + Close)/3 range from the last 60-minute bar and plots the lines into the next smaller time frame.
Curves:
- Pivot: (HLC3(@),minutes)[-1]
- R1: (2 * (HLC3(@),minutes)[-1]) - (Low(@),minutes)[-1]
- R2: (HLC3(@),minutes)[-1] + (Range(@),minutes)[-1]
- S1: (2 * (HLC3(@),minutes)[-1]) - (High(@),minutes)[-1]
- S2: (HLC3(@),minutes)[-1] - (Range(@),minutes)[-1]
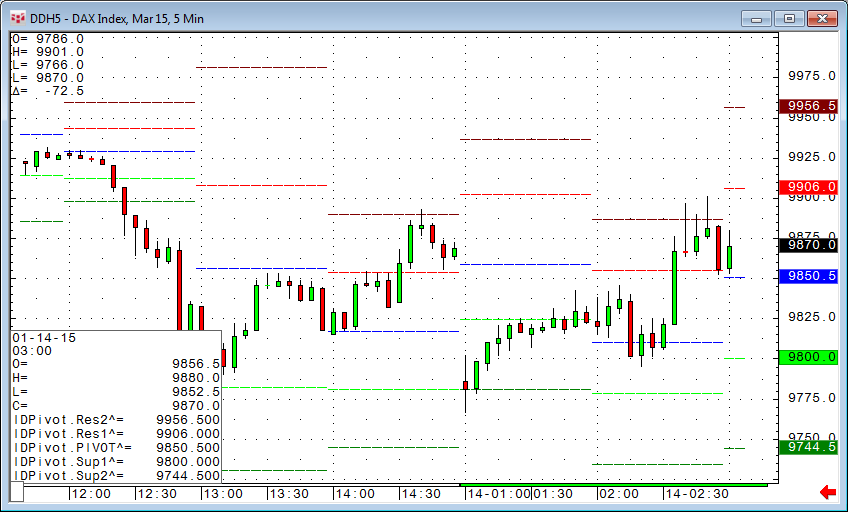
IDPivot Study on 5-minute chart.
The trading idea on these lines would be to trade long when resistance 1 is broken with a target of resistance 2 and a stop loss on the HLC/3 line. The short would be vice versa.
For the trading system, we can copy and paste the lines from the study into the price field of the trading system using stop and limit orders. Don't forget to create the parameter "minutes."
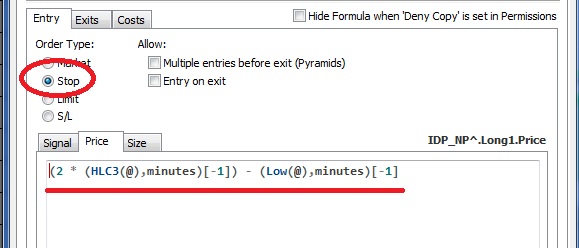
We create one long and one short trade with two exits each.
The trade system must always run on a chart time frame that is smaller than the time frame chosen to create the pivot lines.
This is a really simple trading system, but there is one little problem with this code.
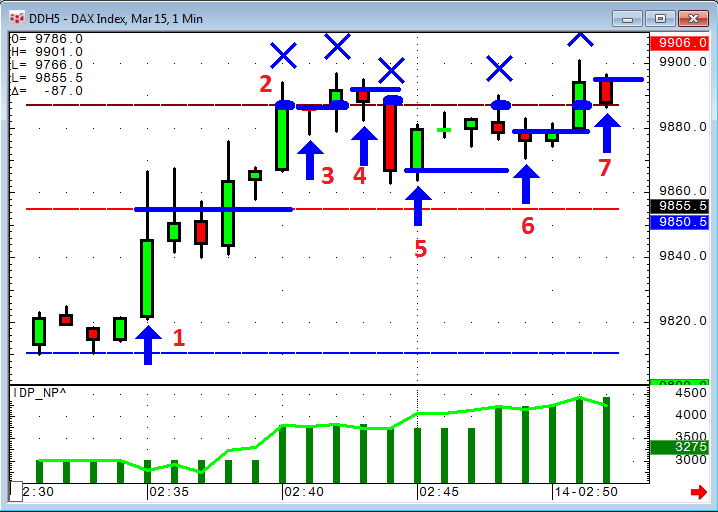
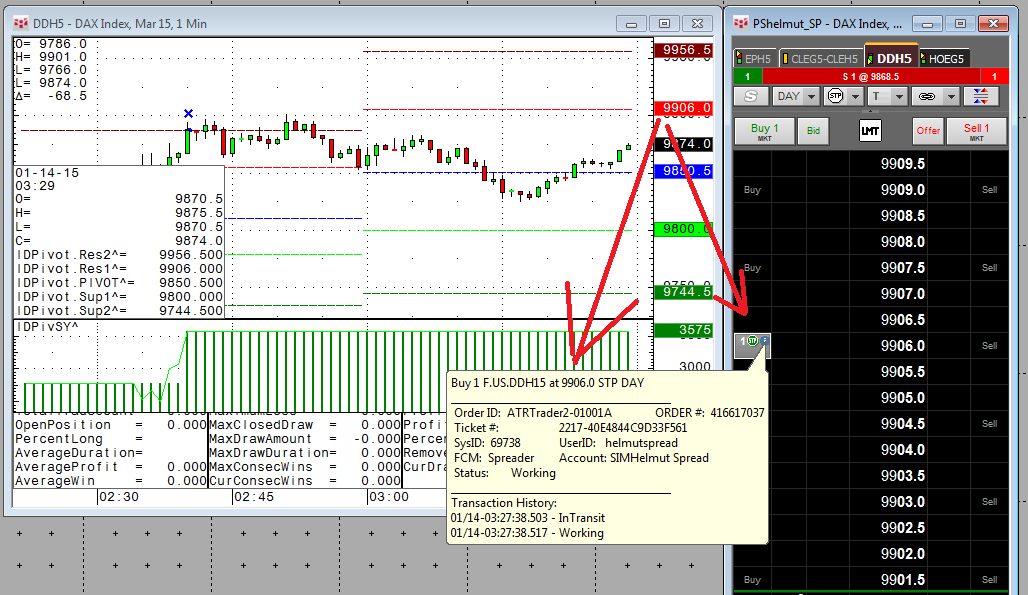
The first entry (1) and its exit (2) are correctly on the lines as expected, but because just after the exit the market is still above the resistance 1 line, it will trigger a new trade again (3,4,5,6, and 7)! That is not what we want.
One very simple way to get rid of the additional trades is to define a rule where a trade is allowed only when the high crosses above the line.
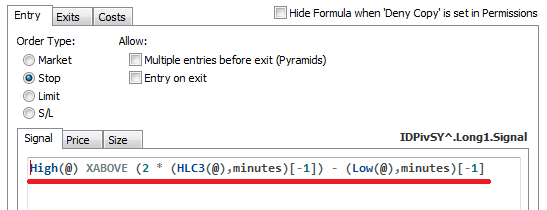
That helps in backtesting, but it will delay the actual trade using auto trading util the moment the high is actually above the line. In real trading this will add some significant slippage.
The better solution is to check that the high one bar before was actually underneath the line.
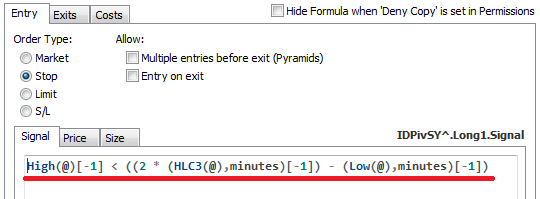
This sounds almost like the same situation, but in auto trading this check can be done before the actual bar develops. Therefore the auto trader would actually already place the stop order in the market and reduce the potential slippage.
Another problem that can occur is that every x minutes (60 minutes in our example) the pivot levels might change.
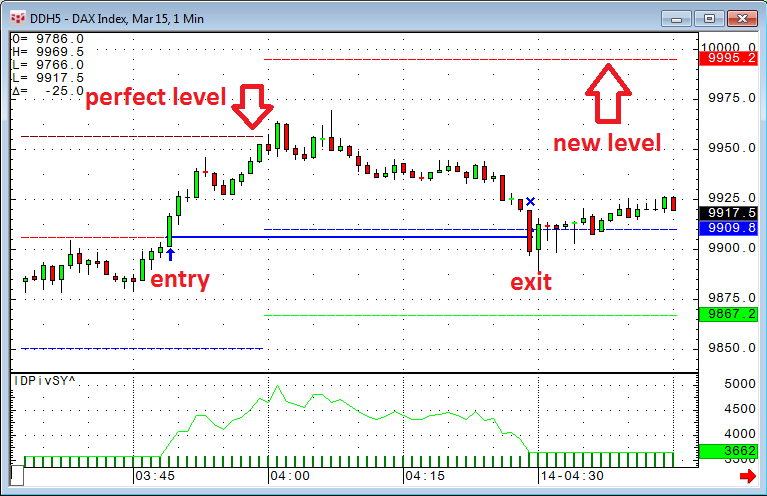
This would have been a perfect trade, but the trading system did not exit at the old level because by the time the market reached the perfect exit level, the time was already up and we had new levels based on the last full hour. The market lost steam and a 1200€ winning trade turns into a very small gain.
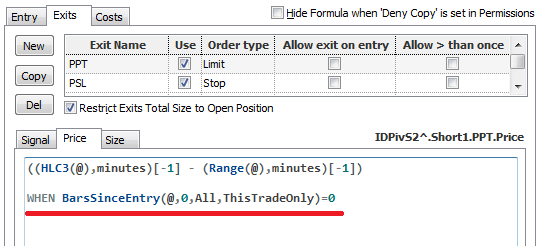
To prevent this, we need to pin down the levels at the moment of the entry. This can be done by adding a small piece of code to all the exits.
As always, this is not trading advice! The trading system is only a programming example demonstrating how to tackle certain things when creating trading systems. If you evaluate this trading system on different markets or built your own ideas around this concept, please keep in mind that sometimes moves happen very fast and you should expect some slippage.

In this example we make 9300€ within ten trading days, but if we are pessimistic and add two points slippage getting in and getting out of the trade, that would be 100€ per trade times 87 trades. That sums up to 8700€ eating up all our profits even without commission.
To learn more about auto trading, you can watch this recorded webinar.