
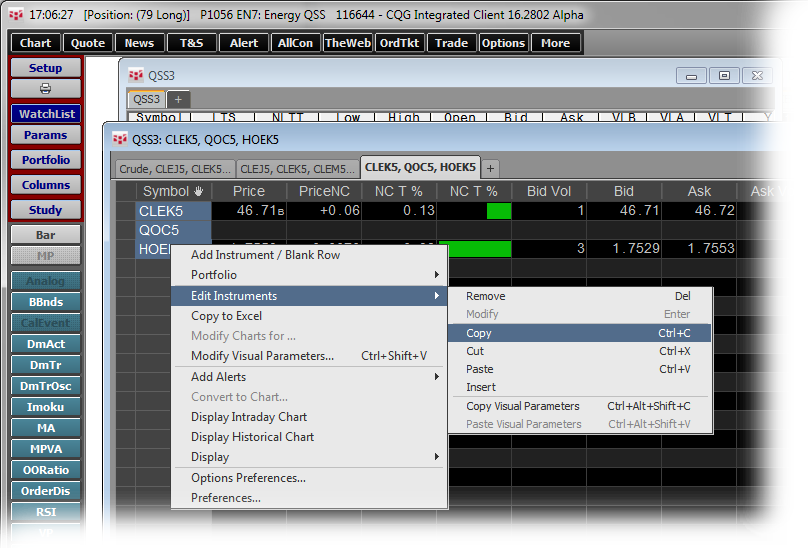
If you have a list of symbols in CQG Integrated Client or CQG QTrader that you want to get into CQG M, here’s the best way to do it. You can easily paste a comma delimited list into CQG M.
… more
This Microsoft Excel® spreadsheet offers a unique format where the current market data is displayed as borders around the chart information. The markets are heat-mapped based on percent net change… more
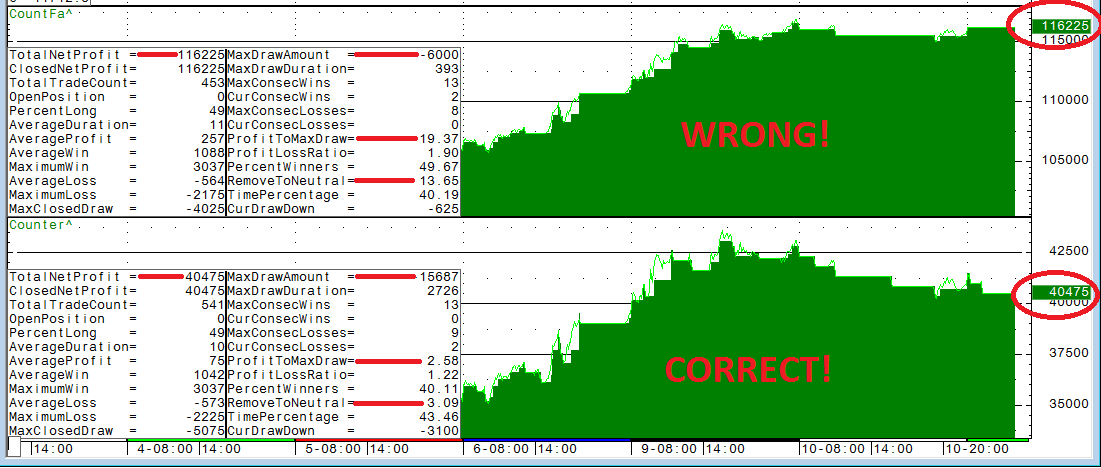
In this article I want to show how misleading a peak-ahead failure can be on a trading system.
I was working on a countertrend system and the backtesting results showed that it picked up… more
This CME Group news release announces the winners of the CQG-sponsored CME Group Trading Challenge. The 12th annual competition for college and university students attracted over 500 teams… more

Boca Raton, FL, March 10, 2015 - At FIA Boca, CQG, Inc. announced live connectivity to Eris Exchange, a U.S.-based futures exchange offering swap futures as a capital-efficient alternative to OTC… more
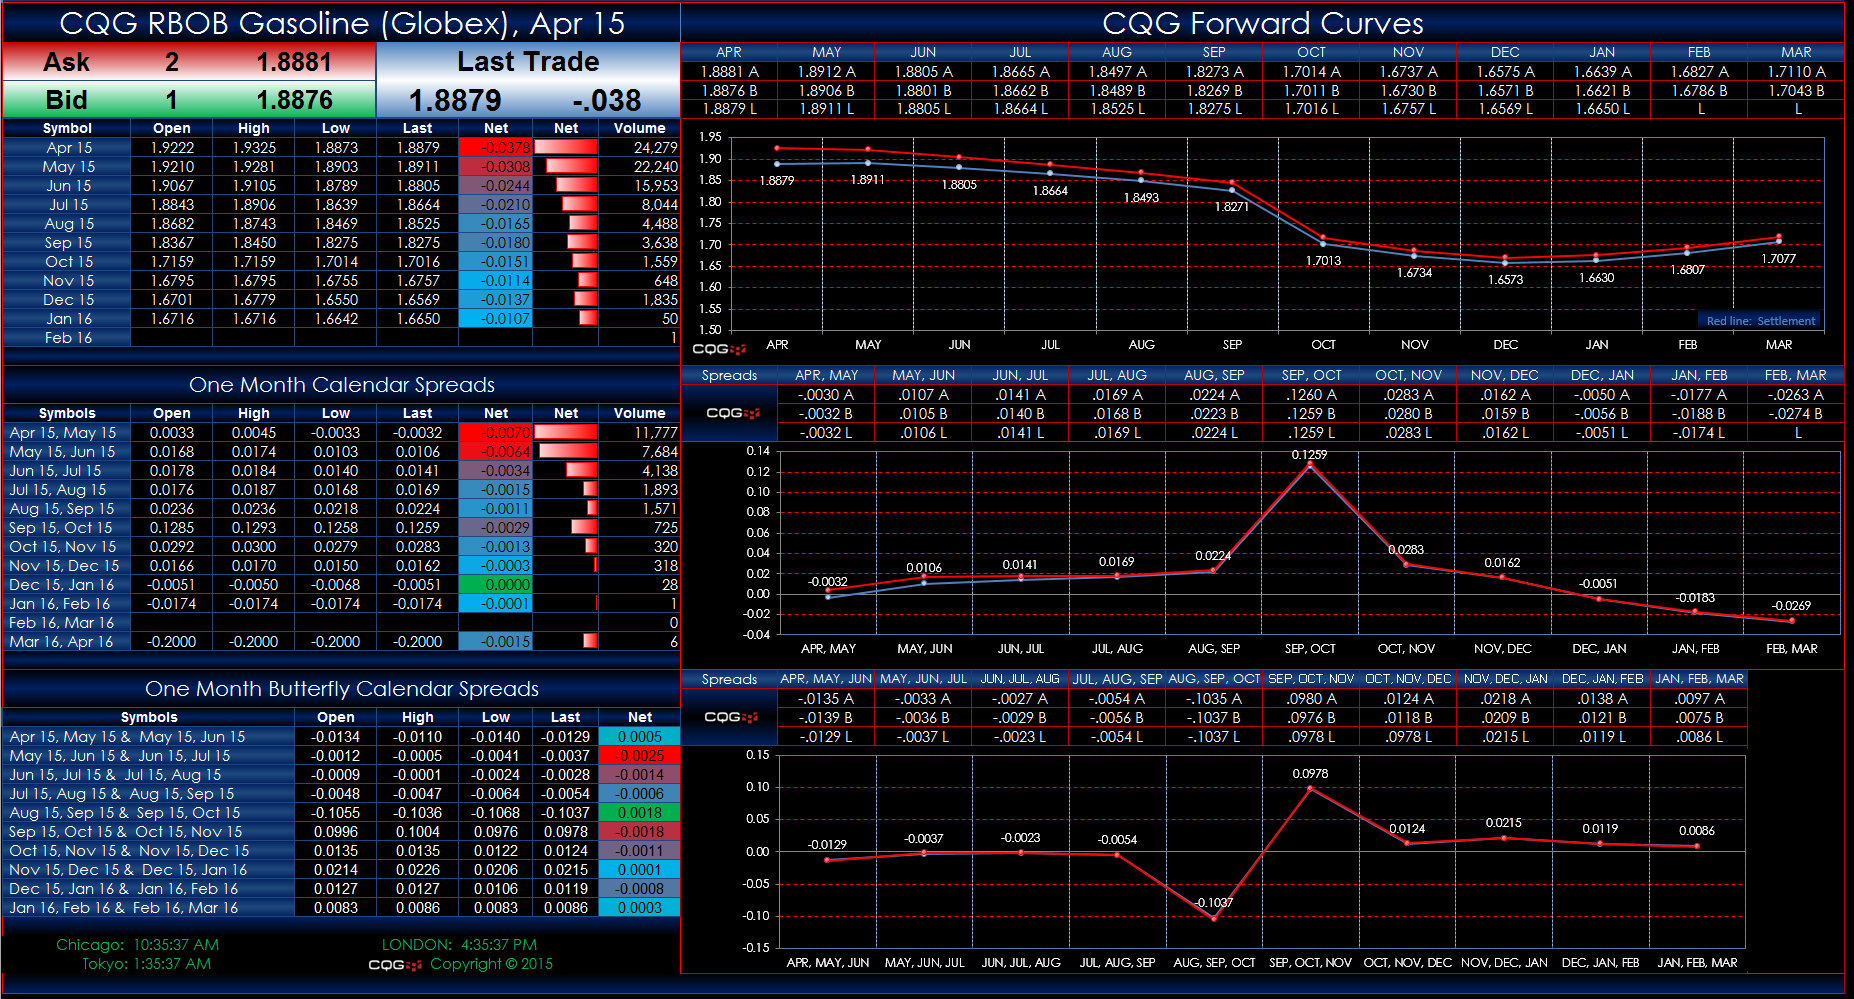
This Microsoft Excel® spreadsheet presents market data and forward curves of the Globex RBOB Gasoline contracts. The data includes the outrights, exchange-traded calendar spreads, and synthetic… more
The price of active month NYMEX crude oil is what everyone is focusing on these days, but that price is only a view from thirty thousand feet of what is actually going on in the global oil patch.… more
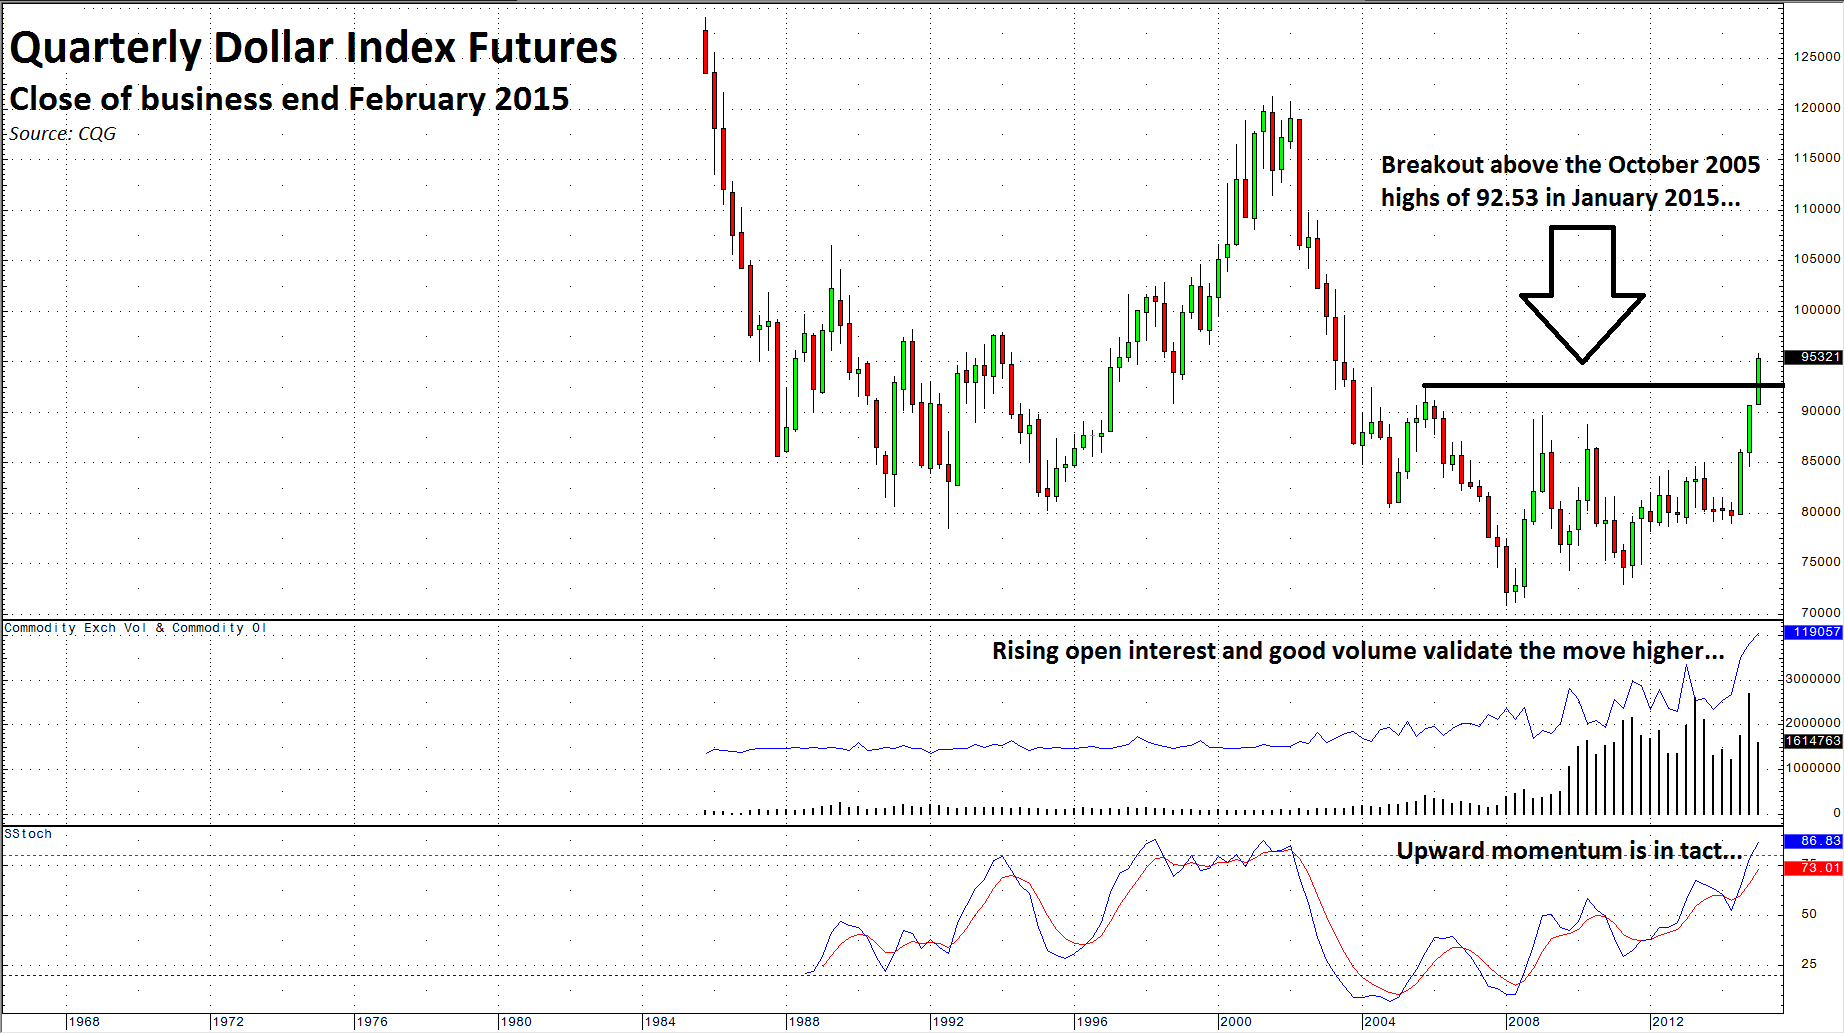
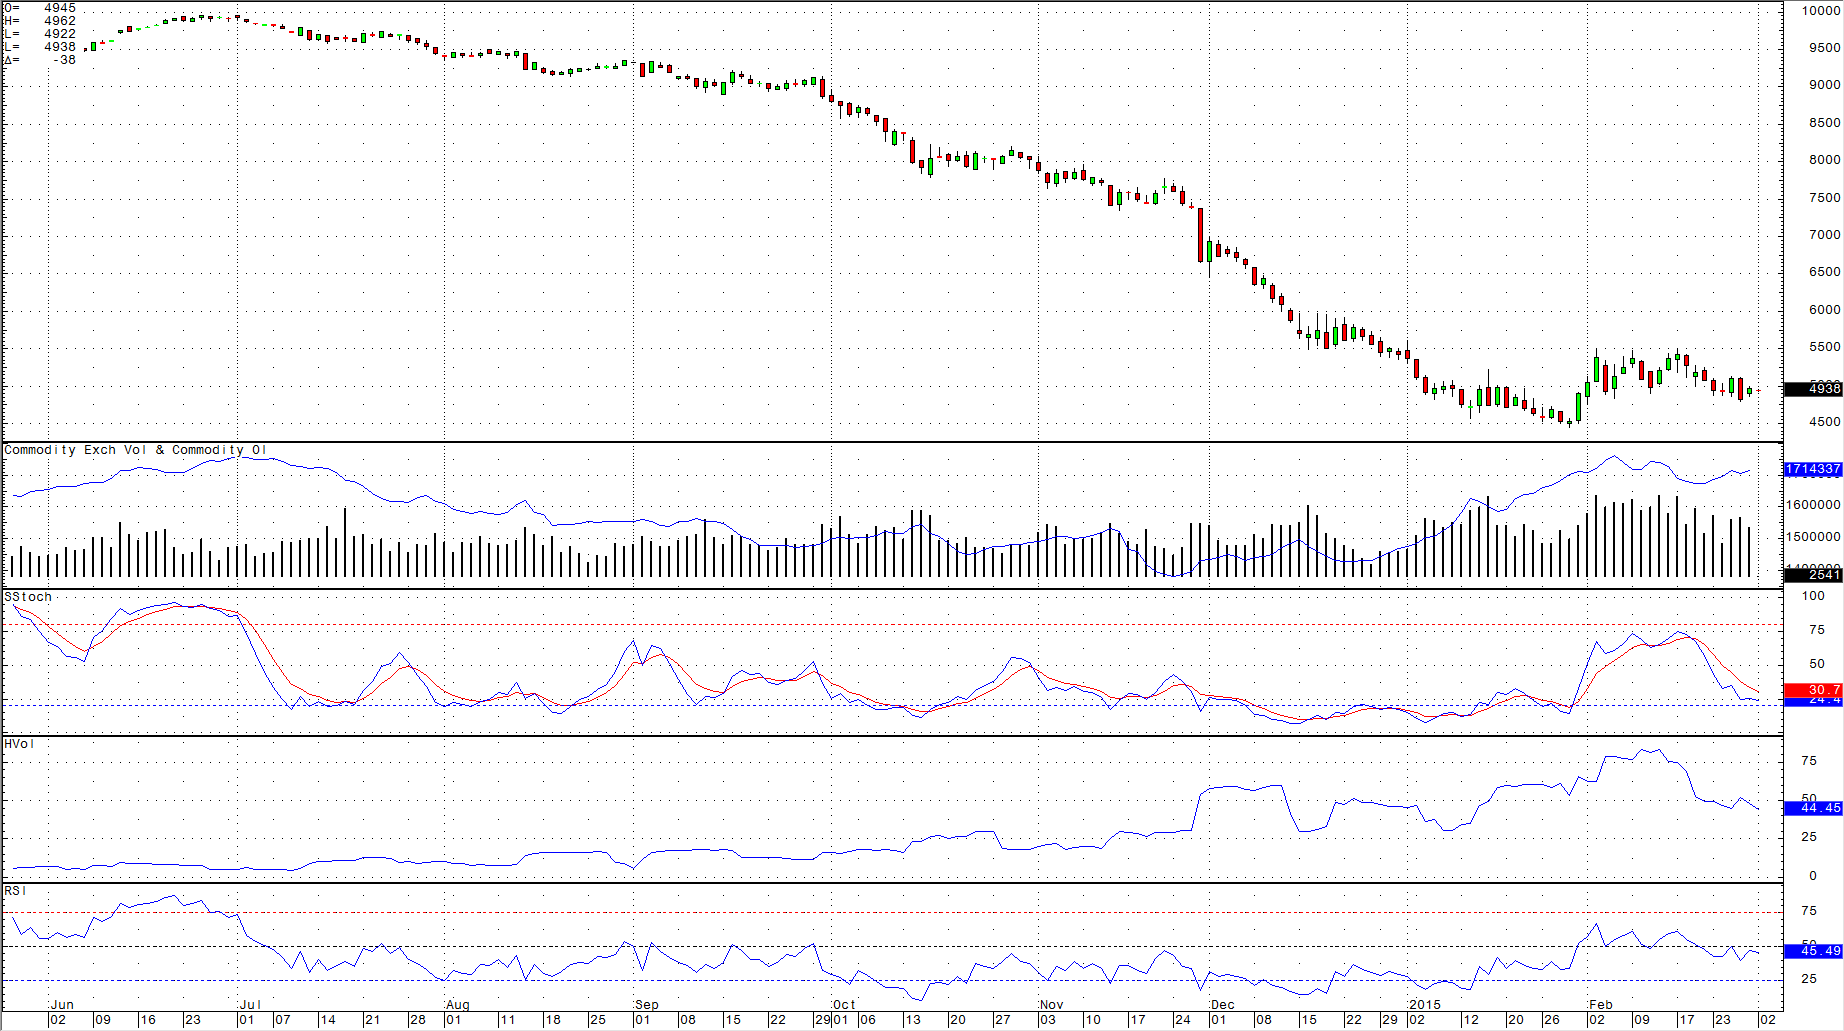
The bull market in the dollar continues to power forward. The US dollar index was up 11.97% in 2014. So far this year the greenback is up another 5.16%. The dollar is one of the strongest markets… more
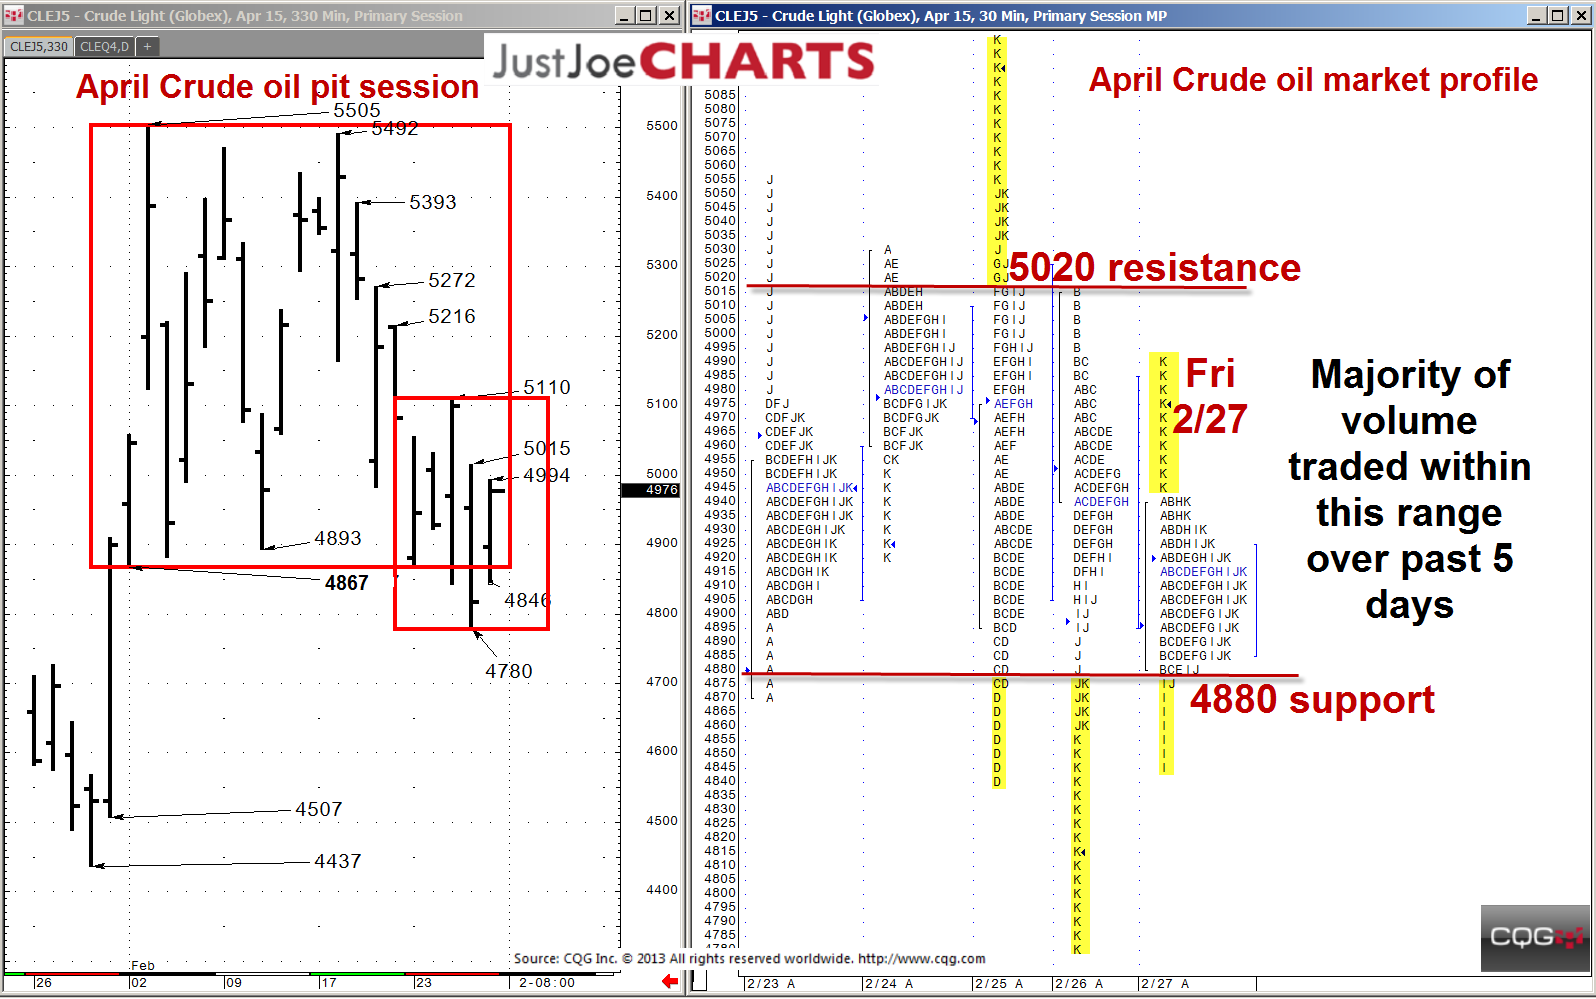
Over the past three weeks, April crude oil found a rotational balance range of 4867-to-5505, traveling from the bottom to the top and back to the bottom of that range a few times. However, three… more
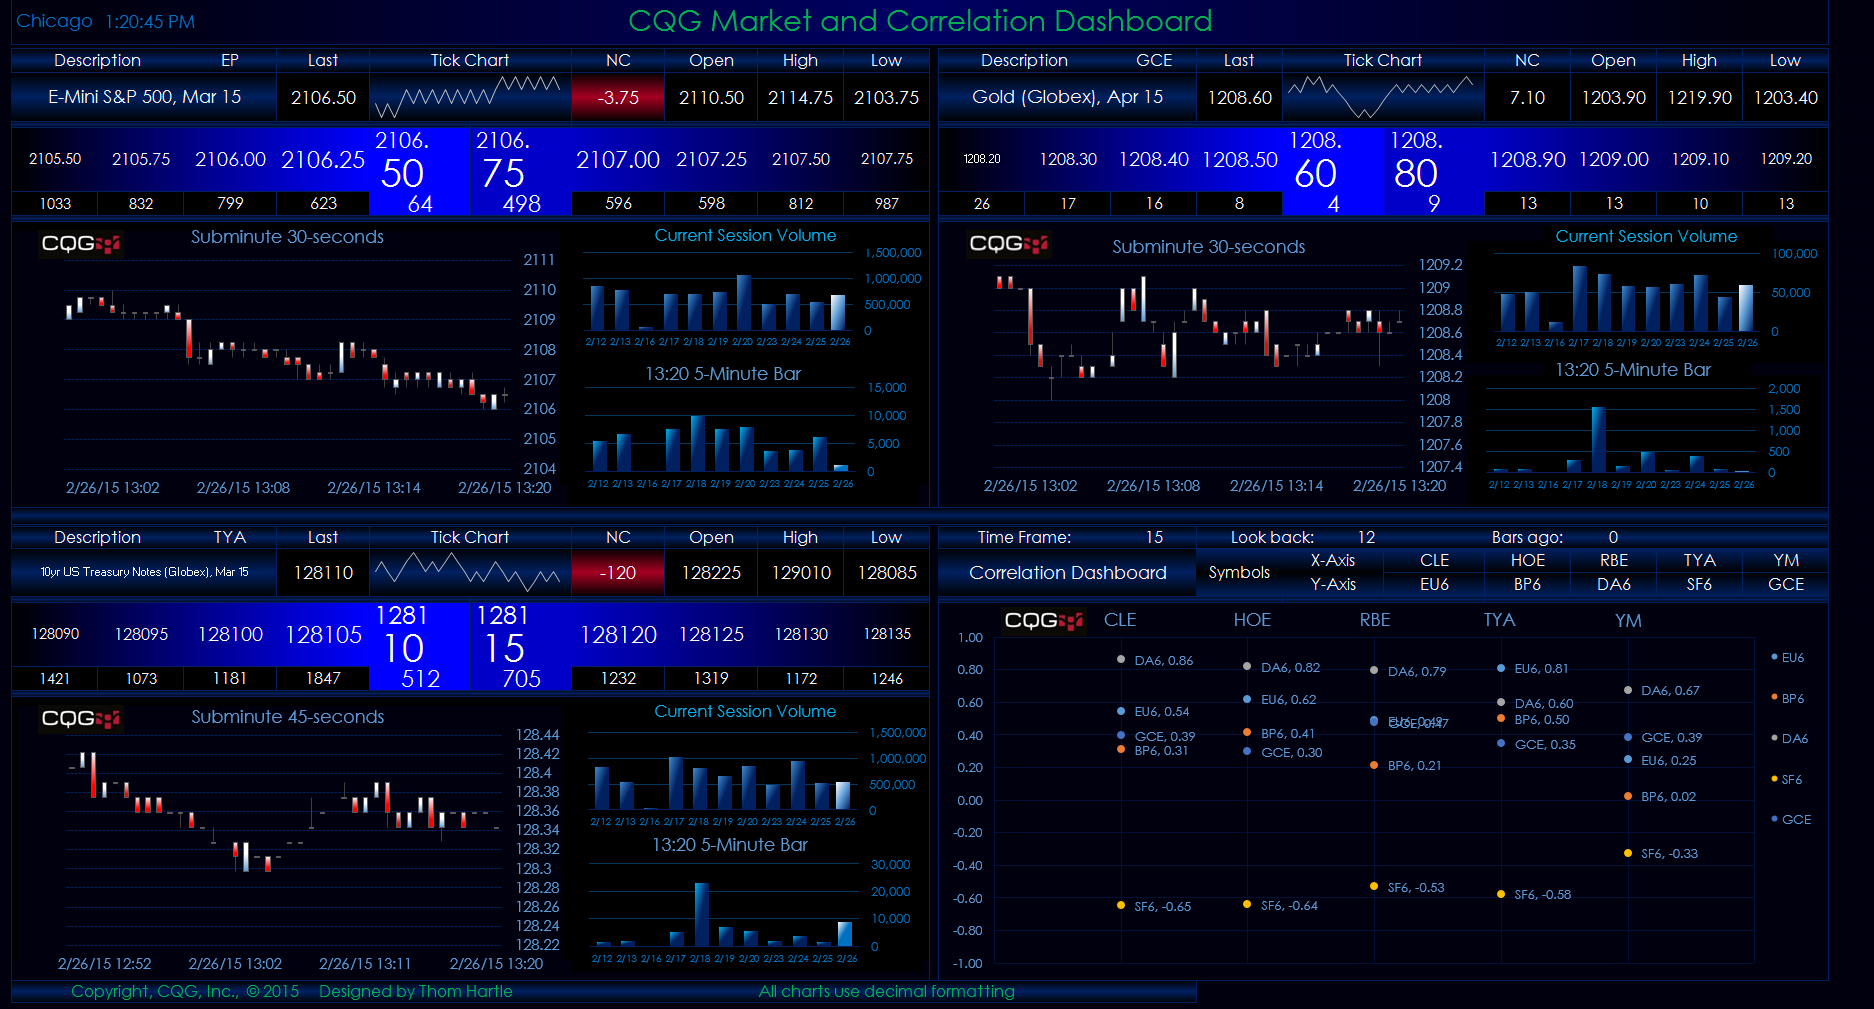
This Microsoft Excel® spreadsheet is an updated version of the CQG-Powered Excel Horizontal DOM Dashboard, which also includes a correlation display. Two histogram charts have been added to each… more