The price of active month NYMEX crude oil is what everyone is focusing on these days, but that price is only a view from thirty thousand feet of what is actually going on in the global oil patch. There is so much more to the price of crude oil, or any commodity for that matter, than the price we see on the screen.
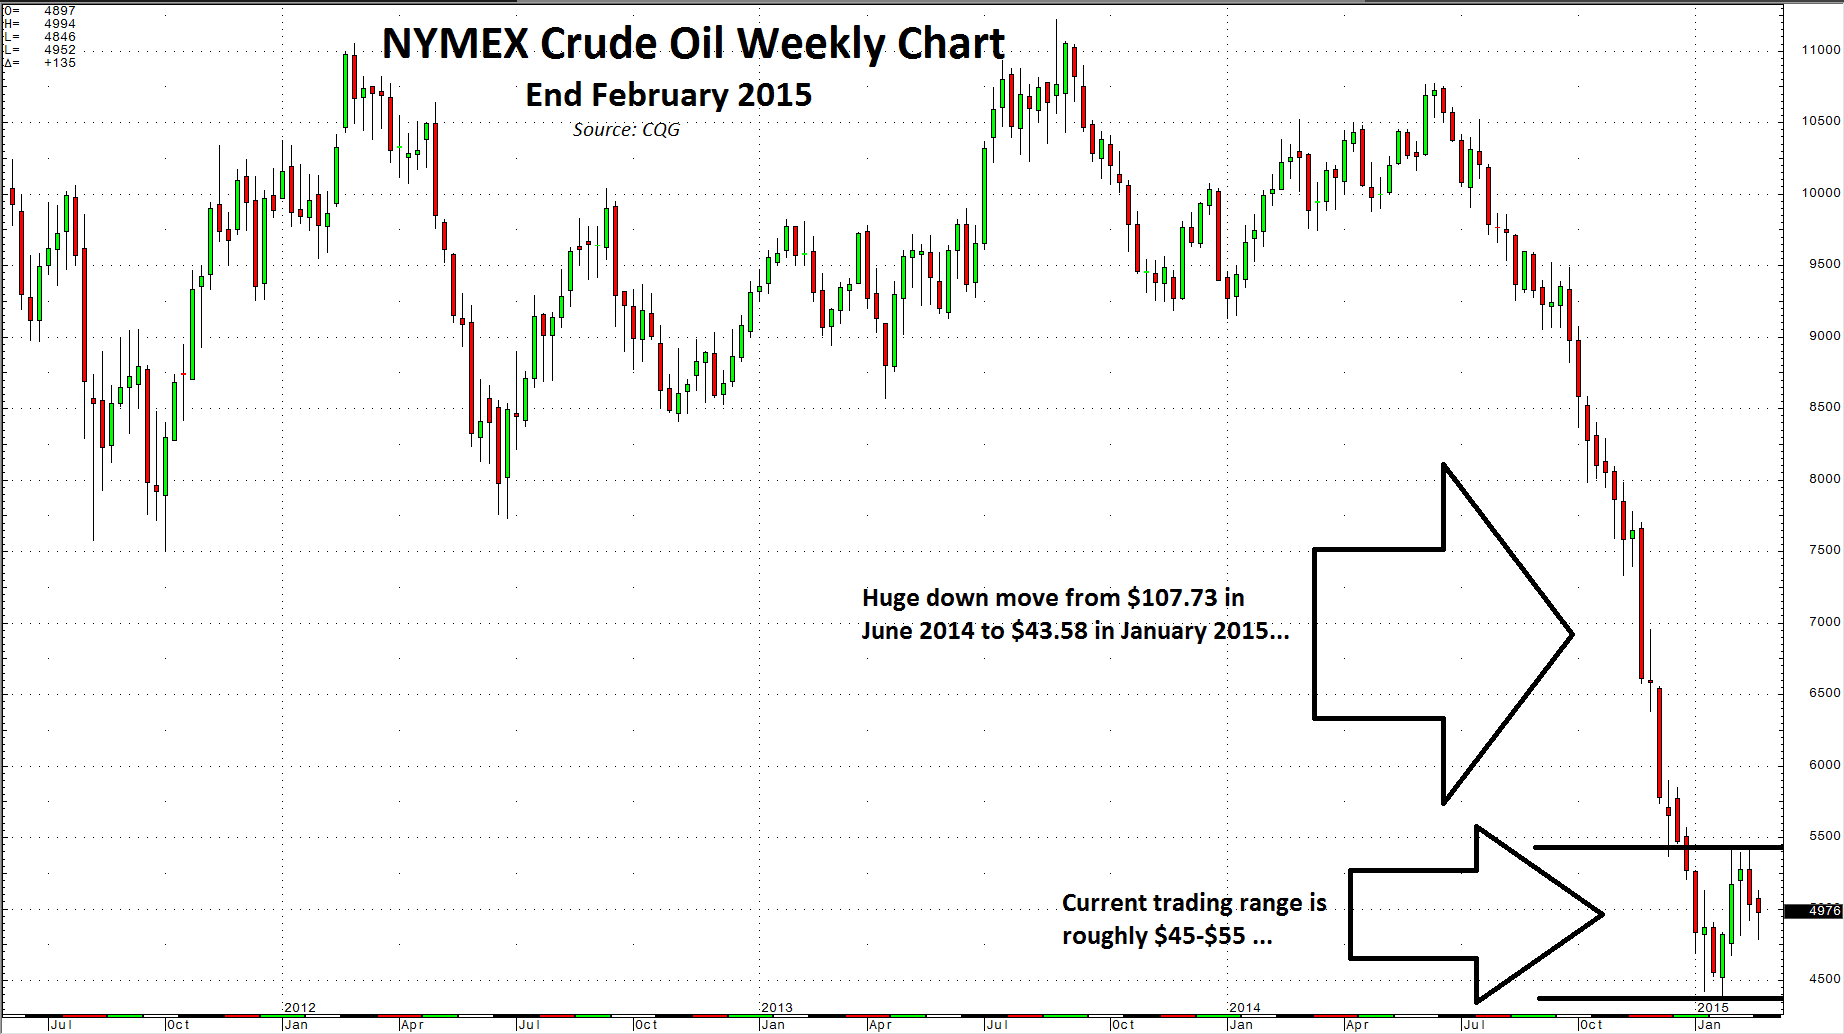
After falling from $107.73 in June 2014 to lows of $43.58 in late January, NYMEX active month crude oil has gone into a sideways trading range between $45 and $55 per barrel. The crude oil market is like a jigsaw puzzle: many pieces collectively come together to create the benchmark price. A review of the pieces that make up the oil price may yield important clues as to the future direction of price for this global and political commodity.
Supplies: Bearish
Inventories continue to rise in the US, setting another record last week at 434.1 million barrels. Although rig counts are falling, down 39% from October highs according to the latest Baker Hughes rig count number, the US continues to be awash in oil. OPEC is sticking to its guns: no production cuts. The current state of global oil supplies remains bearish.
Brent-WTI: Bearish
Over past decades, NYMEX WTI crude oil generally traded at a small premium to Brent crude oil. This is because WTI has lower sulfur content and is easier to refine into gasoline. The Arab Spring in 2011 caused this relationship to flip with Brent moving to a premium to WTI.
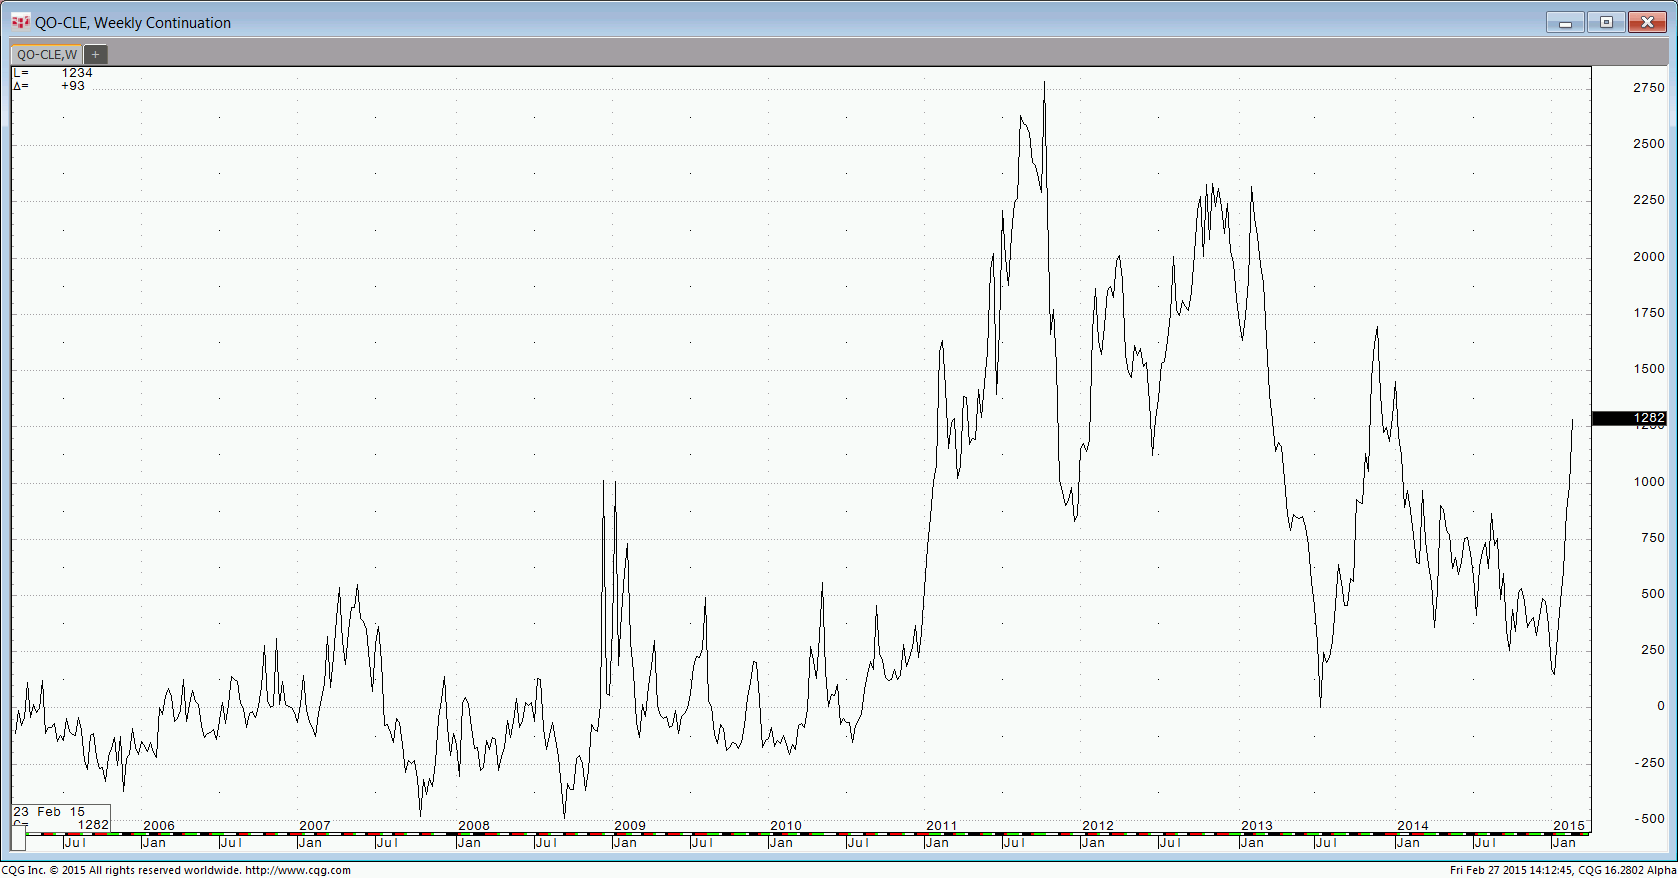
There are two reasons that Brent went to a premium: First, fears about future supplies from the Middle East due to the uprising in the region caused Brent to rally. Second, the US started pumping out more crude oil in its quest for oil independence. The Brent premium went as high as $28. In January, the April Brent crude oil versus April NYMEX crude returned to historically normal levels as it traded down to flat.

Since January, growing US supplies has caused the Brent premium to reassert itself. This time it is not so much a rally in Brent as a depressed value for WTI crude. The current state of the Brent versus WTI spread is bearish for price. The April Brent premium over WTI closed at $12.82 as of the last trading session of February.
Processing Spreads: Bullish
Both heating oil and gasoline futures have outperformed crude oil since making lows in January 2015. April gasoline has rallied from lows of $1.4965 to close February at $1.9779, an increase of more than 32%. Heating oil has rallied from $1.5480 in January to close February at $1.9737, an increase of 27.5%. On the other hand, crude oil traded to lows of $44.37 on the active month April contract and closed February at $49.76, an increase of 12%. Clearly, oil products have outperformed crude oil. The current strike affecting 20% of refineries in the US is only part of the reason that oil products have moved higher. In fact, the rally in heating oil and gasoline began before the strike commenced. Processing spreads are bullish for crude oil.
Term Structure: Bearish
Both Brent and WTI futures spreads remain in contango. NYMEX April 2015 versus April 2016 spreads closed February at $12.19, or a 24.5% contango. Brent April 2015 versus April 2016 spreads closed the month at $7.29, or an 11.65% contango.
The contango in both benchmark crudes indicates a condition of oversupply; therefore, term structure in crude oil remains bearish.
Technicals: Neutral
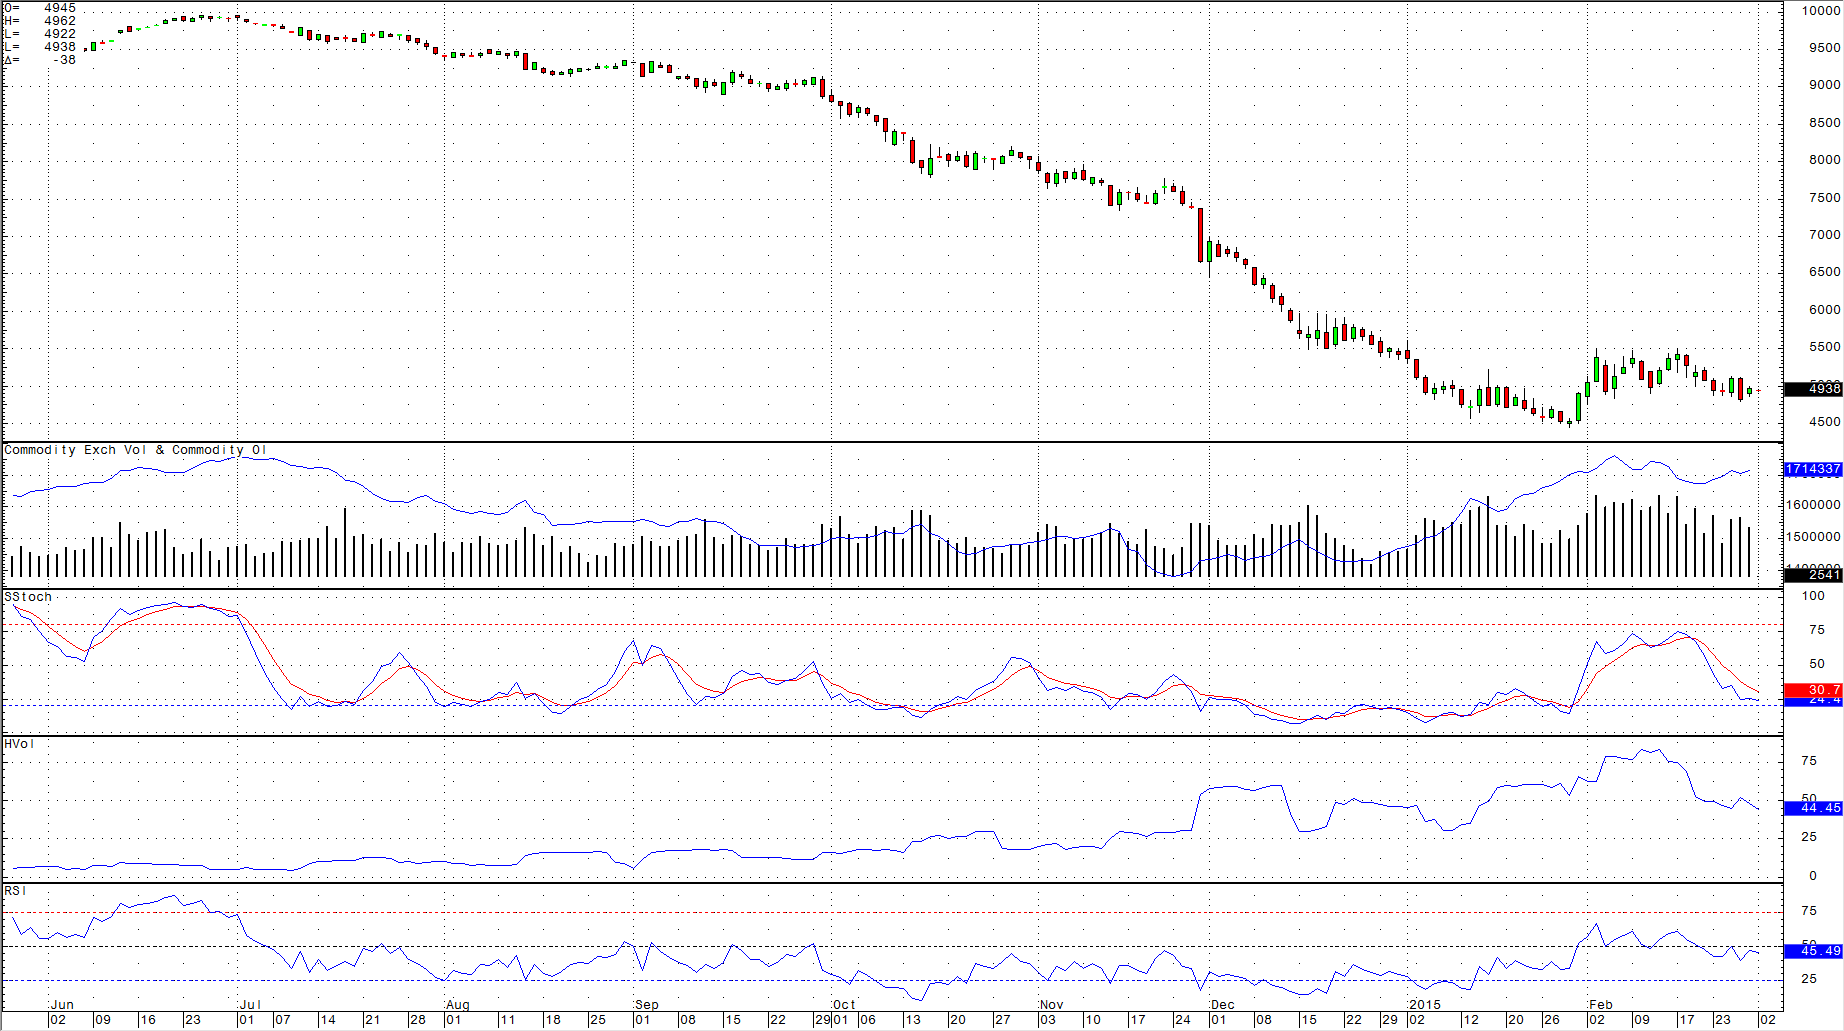
As the daily April NYMEX crude oil chart illustrates, the market is in a sideways range. Momentum indicators are slightly bearish, relative strength is neutral, and daily historical volatility has been dropping. The current technical state of the crude oil price is neutral.
Technomentals: Neutral $45-$55
An examination of the many pieces that make up the crude oil puzzle leads me to conclude that the market is neutral. Active month NYMEX crude oil futures could remain in the current price range between $45 and $55 per barrel.
Commodity markets are some of the most volatile markets that trade. Therefore, there is always the chance of an exogenous event that will move the price of oil. However, given all of the data available at this time, crude oil appears to be in a trading range.