Each Wednesday this article will be updated with the current seasonal study using CQG's Seasonal analysis applied to the Soybean, Wheat and Corn markets. You can download the CQG pac providing the… more
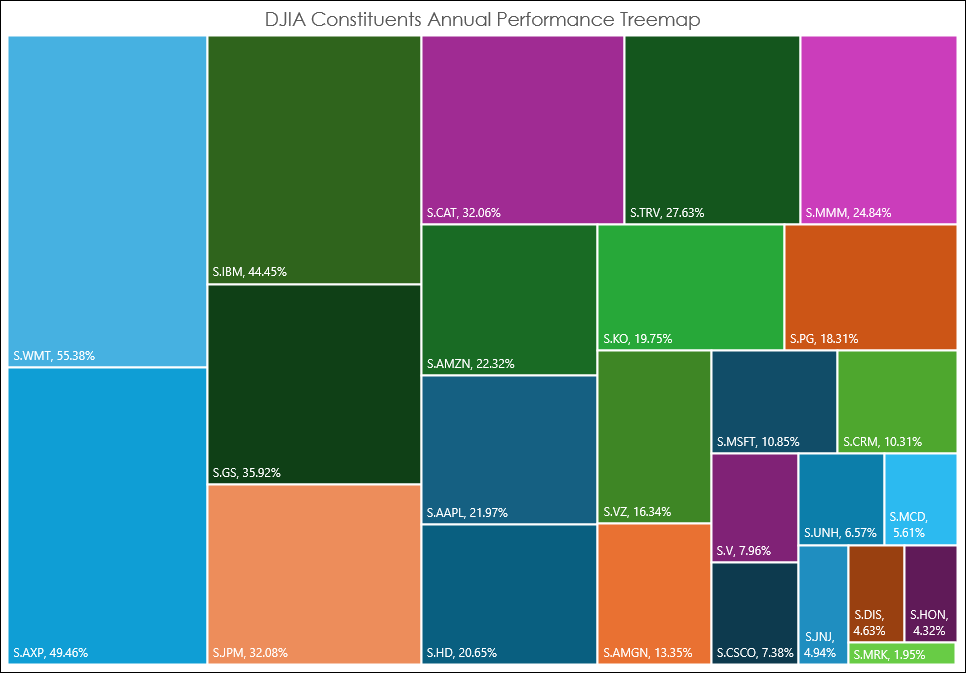
The Excel Treemap chart displays a hierarchical view of the data. The Treemap chart below displays the annualized performance of the 30 stocks in the Dow Jones Industrial Average. The size of the… more
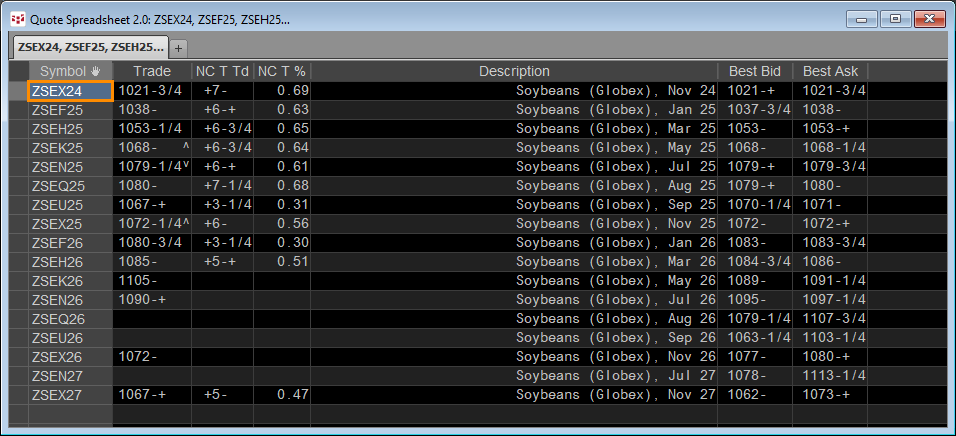
In the CQG Quote Spreadsheet the first symbol of a list of symbols can be entered and then hitting the key combination of CTRL+Enter will populate the spreadsheet with all of the available symbols… more
Midweek, the TSE 10 Year JGB, Dec 24 contract is down -0.42%. The best performer in the US market is the 2yr US Treasury Bonds (Globex), Dec 24 contract which is down -0.18%. The best… more
This midweek look shows the best performer in the Japanese market is the Nikkei 225 (Osaka), Dec 24 contract with a +2.83% gain. The best performer in the US markets is the E-mini NASDAQ-… more
Each Wednesday this article will be updated with the current seasonal study using CQG's Seasonal analysis applied to the Soybean, Wheat and Corn markets. You can download the CQG pac providing the… more
Midweek, the TSE 10 Year JGB, Dec 24 contract is down -0.17%. The best performer in the US market is the 2yr US Treasury Bonds (Globex), Dec 24 contract which is down -0.16%. The best… more
This midweek look shows the best performer in the Japanese market is the JPX Prime 150 Index, Dec 24 contract with a -0.80% loss. The best performer in the US markets is the E-mini Dow ($5… more
Each Wednesday this article will be updated with the current seasonal study using CQG's Seasonal analysis applied to the Soybean, Wheat and Corn markets. You can download the CQG pac providing the… more
In 2024, Bank of Japan finally decided to steer in a new direction for its monetary policy and exited from the long-lasted zero or negative interest rate policy. Entering the "economic… more
