The CQG Rank Study ranks the individual chart points of a market over a specified number of previous trading periods. For example, if the current bar's close had a rank of 3, and the periods were ranked from highest to lowest and the user selected a ranking over 25 periods, that would indicate the current close was the 3rd highest close over the 30-period time frame.
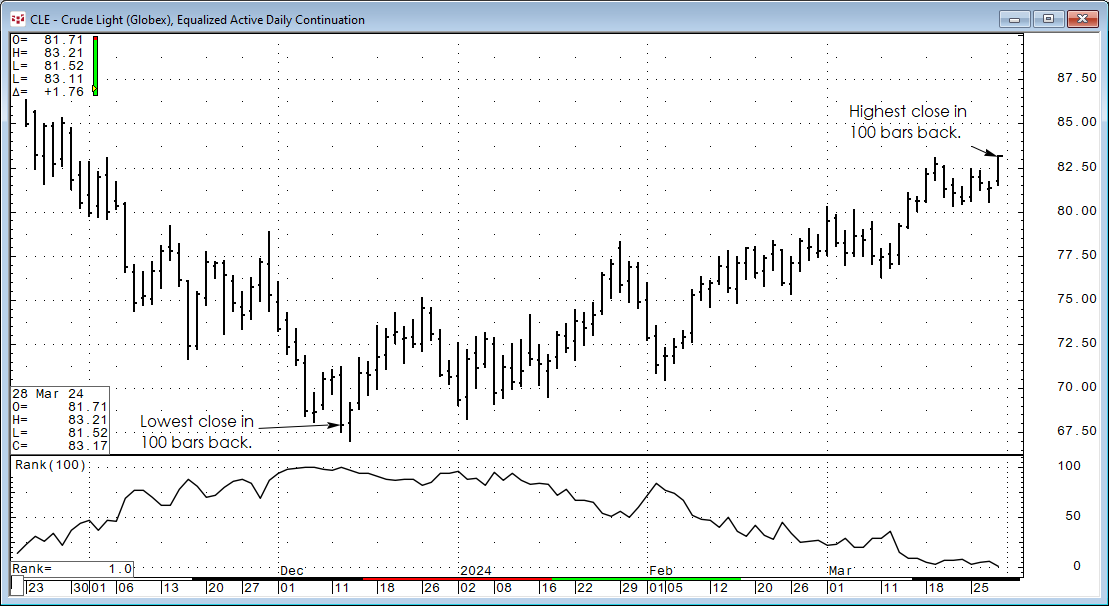
The image below is crude oil (symbol: CLE) with the Rank study looking back 100 bars. The last bar's close is a rank of 1, indicating this is the highest close in the last 100 bars.
Back on 12/12/2023 the rank was 100, in other words that was the lowest close in the previous 100 bars.
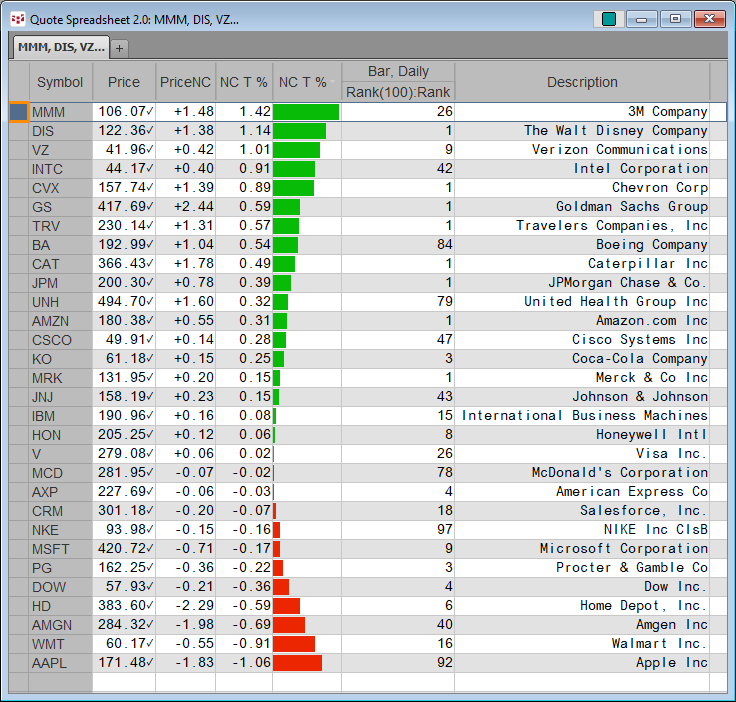
The Rank Study can be useful when looking at a portfolio of instruments in QSS V2 with the Rank Study used as a column. This image below is the 30 stocks in the Dow Jones Industrial Average. The symbols are sorted by today's percentage net change.
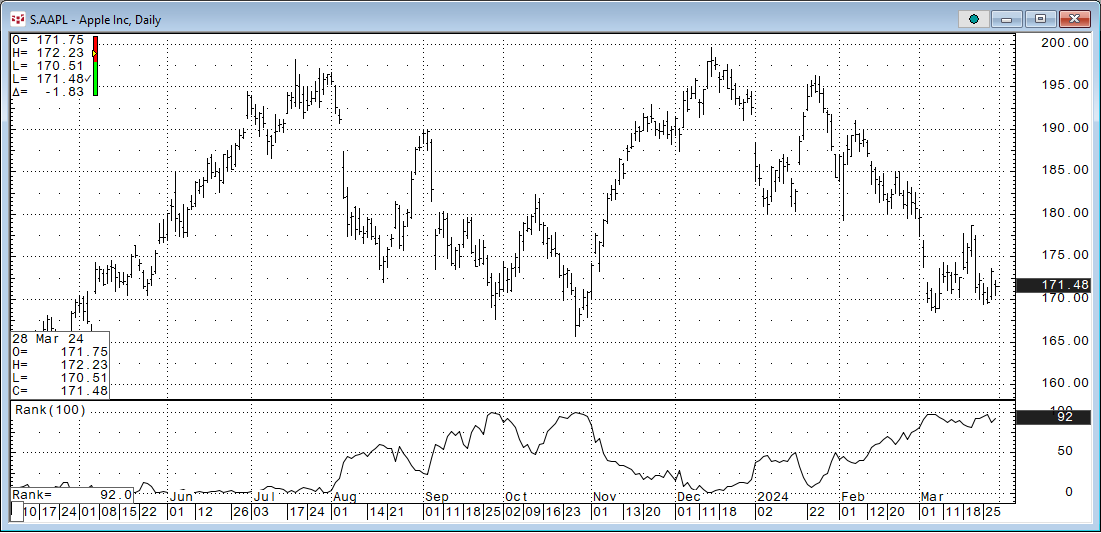
Eight of the stock's close on this day were ranked 1 out of the last 100 bars. Also, on this day Apple was the weakest and the Ranking is 92. Below is the image of the daily bar for Apple.
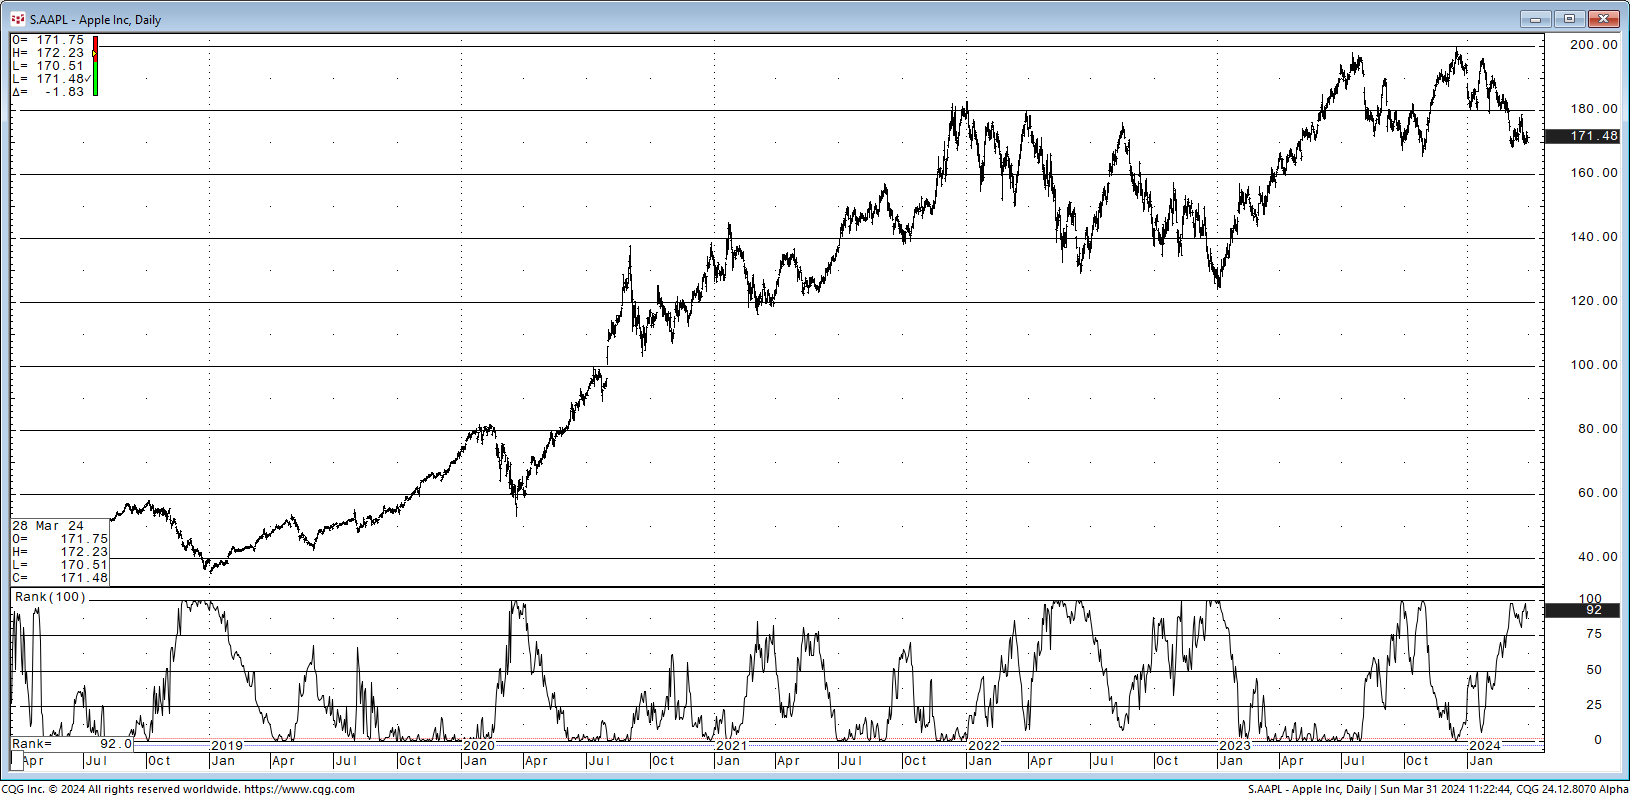
Over the past five years, with the benefit of hindsight, readings near 100 were buying opportunities.
The downloadable CQG PAC at the end of the post is a CQG Page that includes the above Quote Spreadsheet 2.0 and a second Quote Spreadsheet 2.0 with the magnificent seven and a chart linked to the Quote Spreadsheet 2.0.
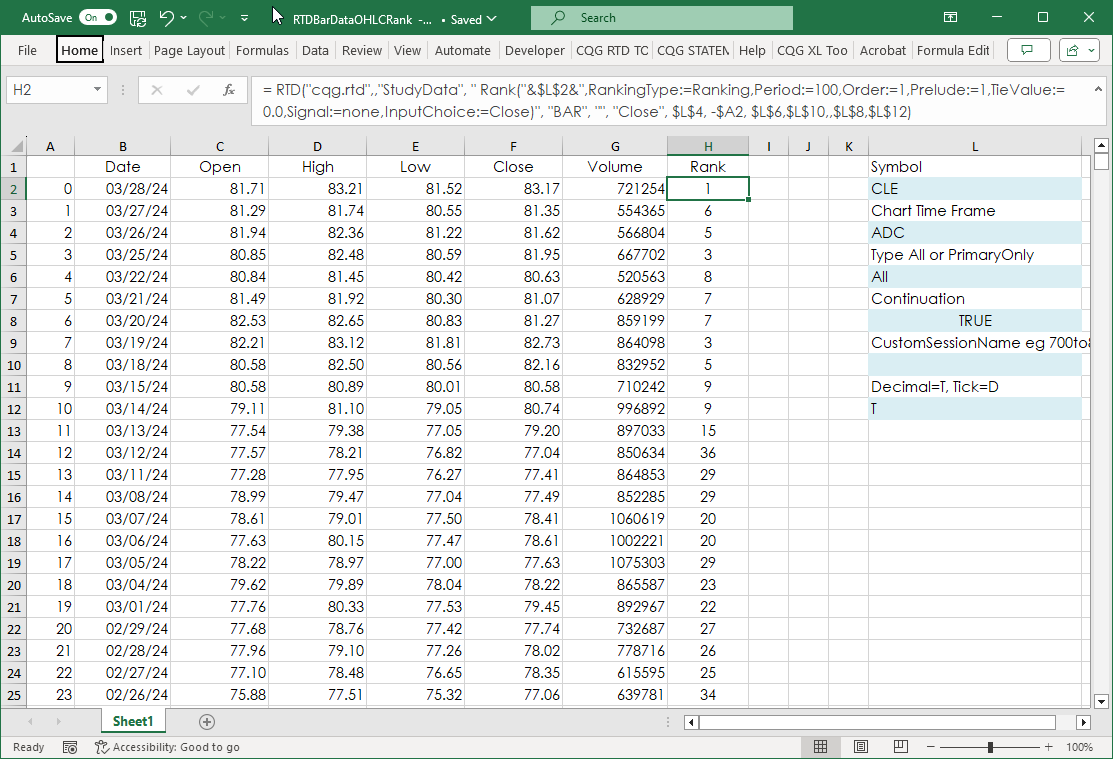
In addition, also available for download is a sample Excel spreadsheet providing the RTD call for the Rank formula:
= RTD("cqg.rtd",,"StudyData", " Rank("&$L$2&",RankingType:=Ranking,Period:=100,Order:=1,Prelude:=1,TieValue:=0.0,Signal:=none,InputChoice:=Close)", "BAR", "", "Close", $L$4, -$A2, $L$6,$L$10,,$L$8,$L$12)Requires CQG Integrated Client or CQG QTrader, and Excel 2016 or more recent.
