This macro-enabled Microsoft Excel® spreadsheet tracks the holdings of the iShares Semiconductor ETF (SOXX). The ETF tracks the investment results of an index composed of listed US equities in the semiconductor sector. The ETF is based upon the NYSE Semiconductor Index.
The ETF has 30 stocks.
| S.US.ADI | Analog Devices Inc |
| S.US.AMAT | Applied Materials Inc |
| S.US.AMD | Advanced Micro Devices |
| S.US.ARM | Arm Holdings plc |
| S.US.ASML | ASML Holding NV NY Reg Shs |
| S.US.ASX | ASE Technology Holding Co., Ltd. |
| S.US.AVGO | Broadcom Inc. |
| S.US.ENTG | Entegris Inc |
| S.US.INTC | Intel Corporation |
| S.US.KLAC | KLA Corporation |
| S.US.LRCX | LAM Research Corporation |
| S.US.LSCC | Lattice Semiconductor |
| S.US.MCHP | Microchip Technology Inc |
| S.US.MKSI | MKS Inc. |
| S.US.MPWR | Monolithic Power Systems Inc |
| S.US.MRVL | Marvell Technology, Inc. |
| S.US.MU | Micron Technology Inc |
| S.US.NVDA | NVIDIA Corp |
| S.US.NXPI | NXP Semiconductors N.V. |
| S.US.OLED | Universal Display Corporation |
| S.US.ON | ON Semiconductor Corp |
| S.US.ONTO | Onto Innovation Inc. |
| S.US.QCOM | QUALCOMM Inc |
| S.US.QRVO | Qorvo |
| S.US.STM | STMicroelectronics N.V. |
| S.US.SWKS | Skyworks Solutions Inc |
| S.US.TER | Teradyne Inc |
| S.US.TSM | Taiwan Semiconductor Manufacturing Co |
| S.US.TXN | Texas Instruments Inc |
| S.US.UMC | United Microelectronics Corp ADR |
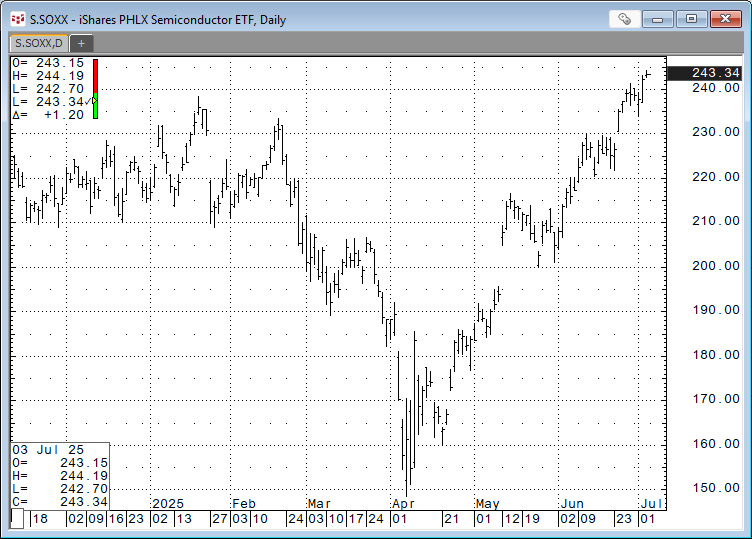
The chart below shows the recent price action of the ETF.
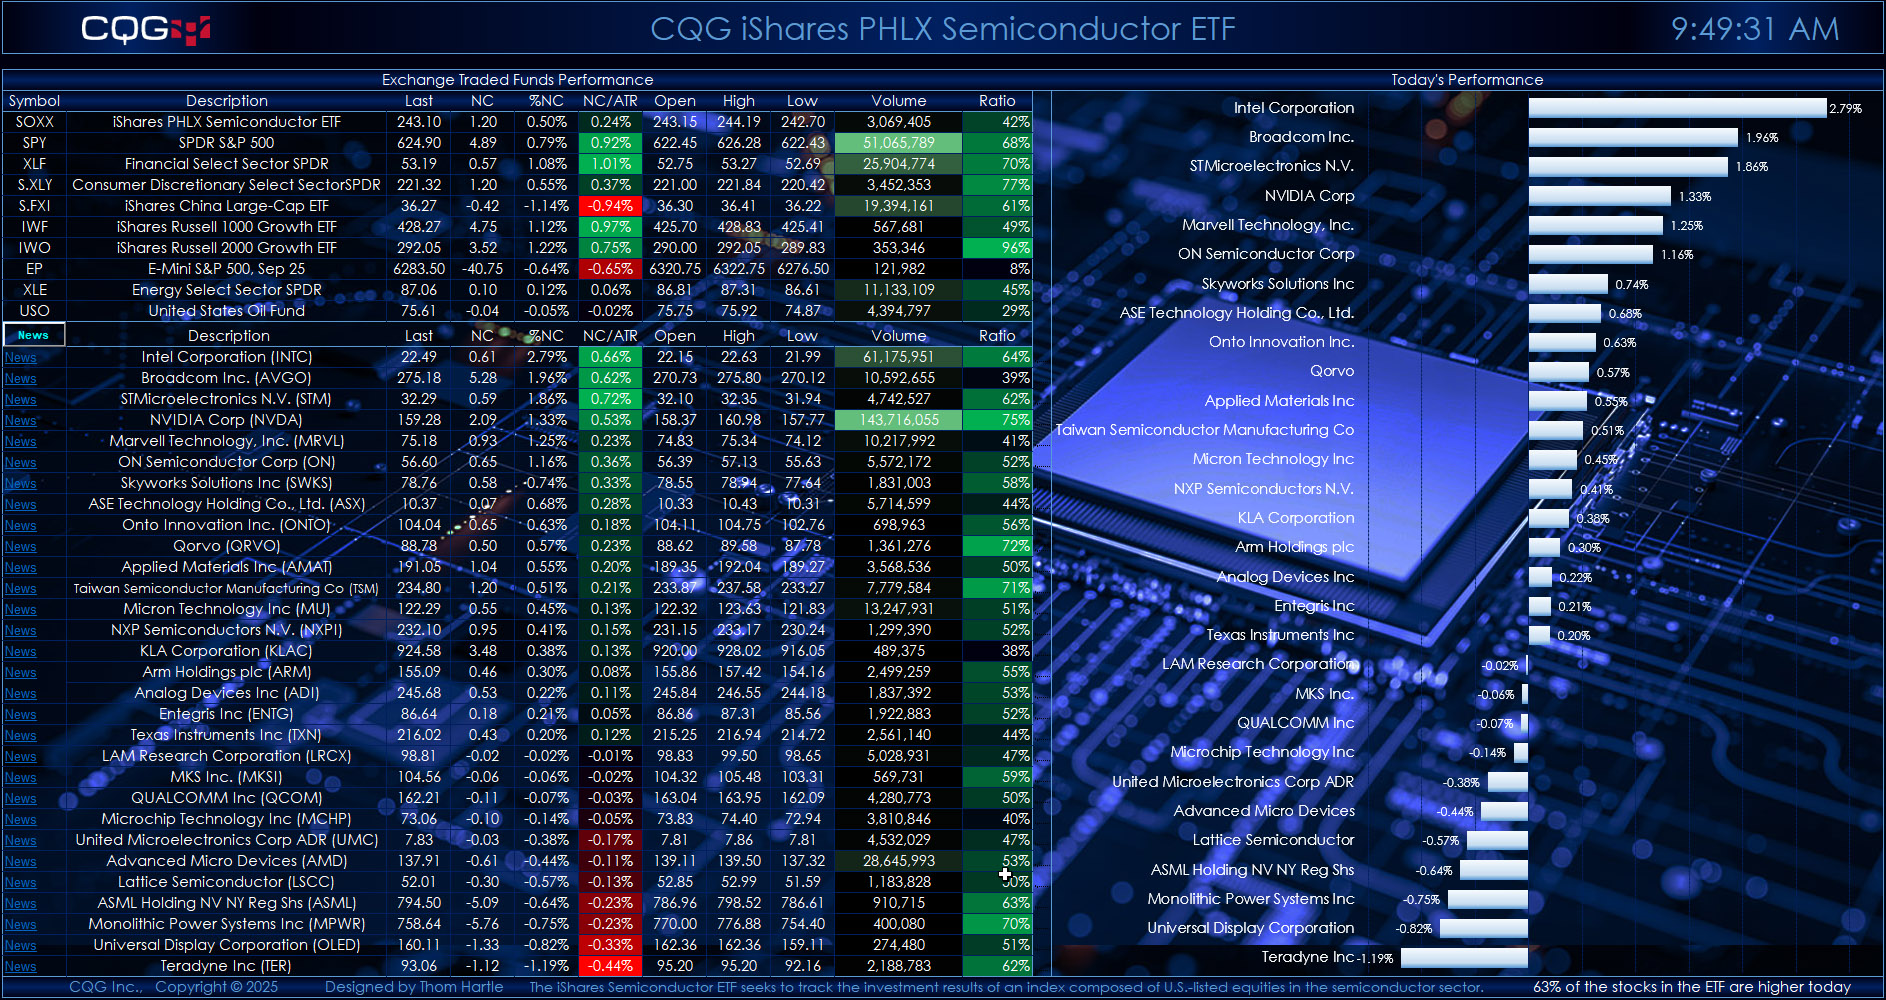
The quotes portion of the display is divided into two sections: The first section allows you to enter your own symbols. The second section displays the individual stocks in the ETF ranked by the current session's net percent change. The chart uses the same ranked performance.
Quote data includes today's net change as a ratio to the 21-day Average True Range study. Next to today's traded volume is a column that calculates the ratio of today's volume versus the 21-day average of the volume. This ratio column gives you a sense of how active today's trading is. Readings of 100% and higher indicate active trading.
Next to each company name is a link to Yahoo Finance. Clicking the News link will take you to the Yahoo page for that symbol. Note that this could take approximately 30 seconds to open in a browser.
If you open another Excel spreadsheet, then this dashboard will no longer be the active spreadsheet. The macro that updates the links and ranks the stocks by performance will stop. To start the macro, simply click the News toolbar button in the first column.
Make sure to lower your Excel RealTimeData (RTD) throttle to 50 milliseconds or lower. Learn how to do that here.
Requires CQG Integrated Client or CQG QTrader, data enablements for the NYSE and Nasdaq stocks, and Excel 2016 or more recent.