Range Deviation Pivots represent one of the core studies as part of the Fourth-Dimension suite. The calculation differs from standard Pivot theory in that they compute the range over the last 22 periods. It takes that average and when the bar opens it fixes 1, 2 and 3 standard deviations beyond that opening point. This means that the values are fixed and therefore enable you to be proactive. From that premise there is an added variable that analyses the trend. This means that the deviations above and below are not symmetrical. If the trend is down then the pivots below will be further apart and vice versa. This will be amplified if overall range is expanding as well in the recent past. This allows the current trend to breathe and makes the valuation of a normalized extreme (which is qualified by reaching the 3rd Deviation) more difficult to achieve. Originally designed for daily charts they can be placed on any timeframe chart, whilst they also possess the ability to visualise higher and lower timeframe charts via a custom study I have created. This has created a multitude of further uses including the development of the Range Relativity Study.
Range Deviation Pivots have the following uses:
- Computes the normalized extreme of range
- Computes when the extreme of range signals a trend ending or accelerating
- Provides entry points via limit orders to pyramid trading systems or identify entry points when there is a counter trend move to the dominant trend.
Most pyramiding techniques use the closing price as the point of entry, but whilst this should increase profitability it is done at the expense of stability. Using a counter trend move via the Range Deviation values means that both profitability increases but not at the expense of stability. The two charts below show the original trend following system followed by the Range Deviation pyramid. This places limit orders at the first and second deviation up in what is a downtrend. Note how the profit almost doubles but the stability statistics are almost unchanged.


As stated previously the Pivots can be placed on any timeframe chart and usually a lower one. The third deviation down represents the normalized limit of range for the day. The S&P chart below is connecting the Peak Range intraday supports and resistances. They plot Green (120), Pink (240), Brown (360), and Red (720 min). Note how the normalized limit of range (red dash) is just above a major half day support zone. The study below is another new Time-based study which computes the average volume for that time of day on the 60-minute chart (blue line) and overlays the actual volume that occurred (red line). The connection between volume for the time of day and patterns and support and resistance have a multitude of applications. In this case the volume was 50% lower than the average but still created a reversal as the strong support prevailed. Price bounces to the 3rd Deviation up which is also at resistance the next day.

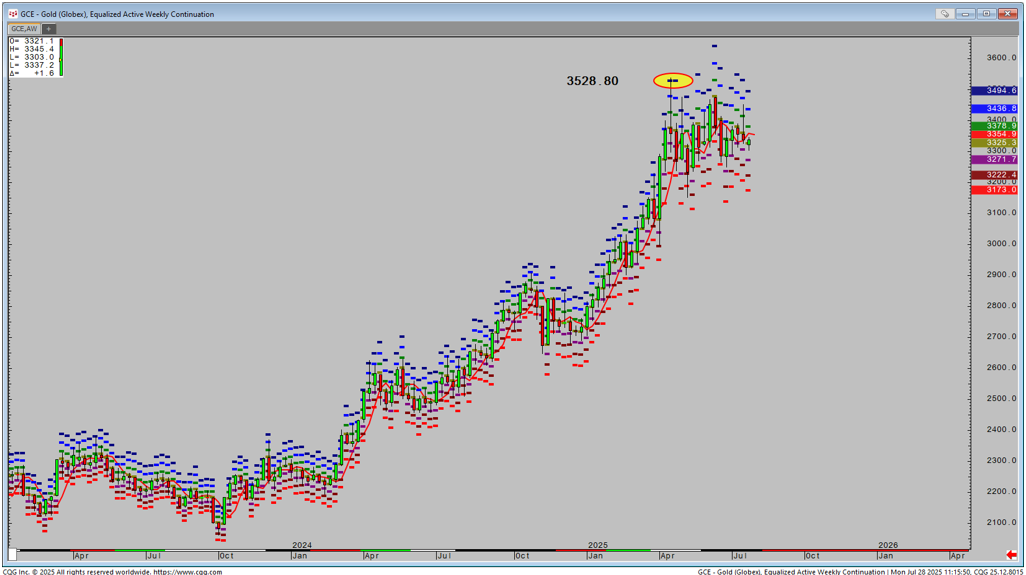
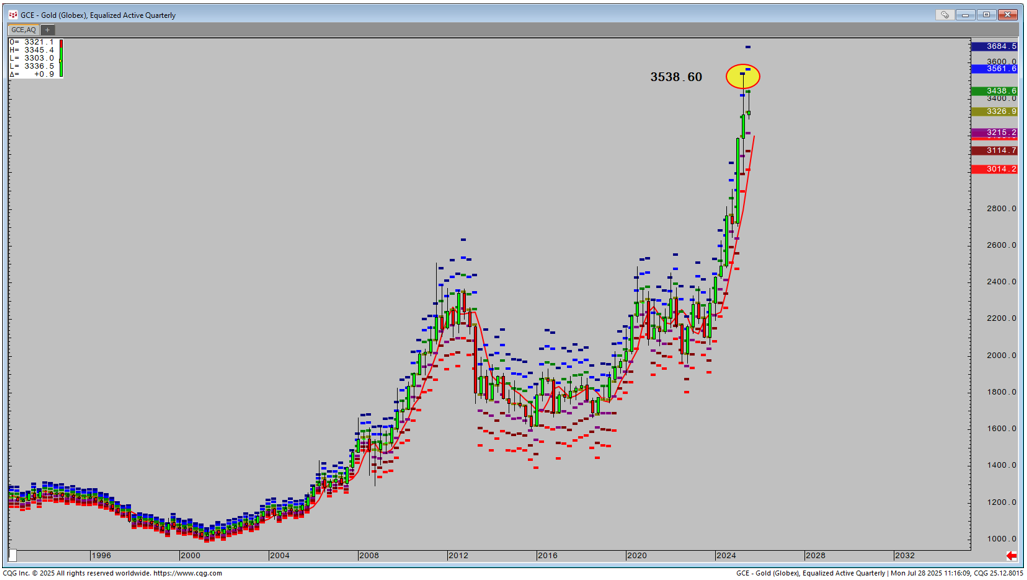
The use of multiple timeframe pivots are particularly useful if looking for a confluence, especially of an extreme or at times when we are trading at prices never seen before or for a very long time. The recent high in Gold in April is a prime example. Everyone knows the trend is up but there is very little analysis of where price can go and more importantly where it should stop. As price accelerated in April, the weekly limit of range lay at 3525.80. More importantly the quarterly limit of range was just above at 3538.60, thus creating a multiple timeframe zone extreme. The high was within it at 3537.90.
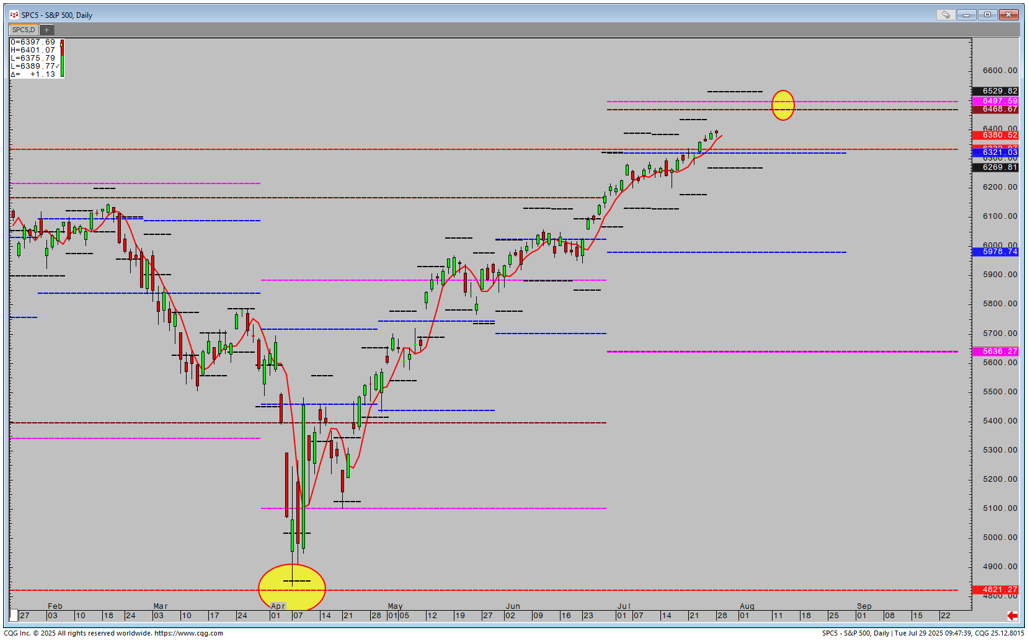
Range Relativity was born out of the application of multiple Timeframe Range Deviation Pivots. Previously I had Managed Funds purely in derivatives, before having the opportunity to do the same on American stocks. This presented a dilemma as my world had switched from 50 or so markets to thousands. Therefore I had to create a new suite of studies and patterns that were of sufficient rarity so that I would not be overrun with signals. Range Relativity is one such study and pattern. Stocks are also often less volatile intraday, and the uptrends can last far longer. Therefore the Pivots are applied to a daily chart and compute weekly, monthly, quarterly, semi-annual and annual data if there is sufficient history. These are just the 1st deviation up and down. The study can look messy and uninformative at first glance. Below is the S&P cash chart. The steep fall in April got very close to the final support and yearly level. Now, during the rally we have reached the yearly the other way, but as the new quarter and half year has begun a new set of levels have appeared as major zone above. This shifting through time and the resetting of levels is a crucial component in understanding where price can go and when it will stop.
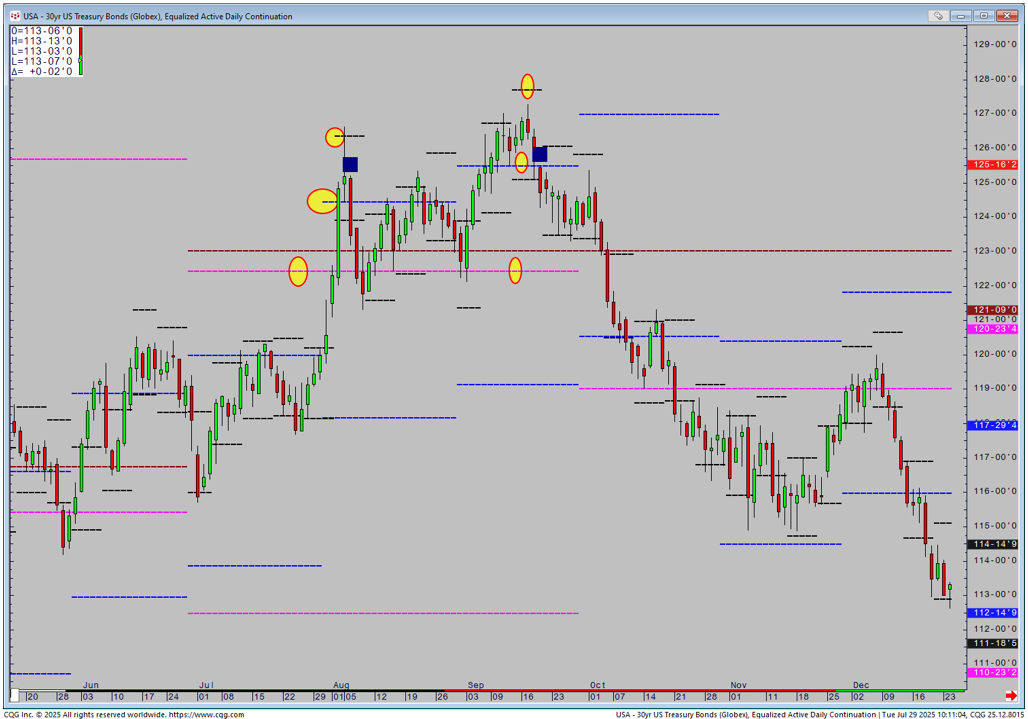
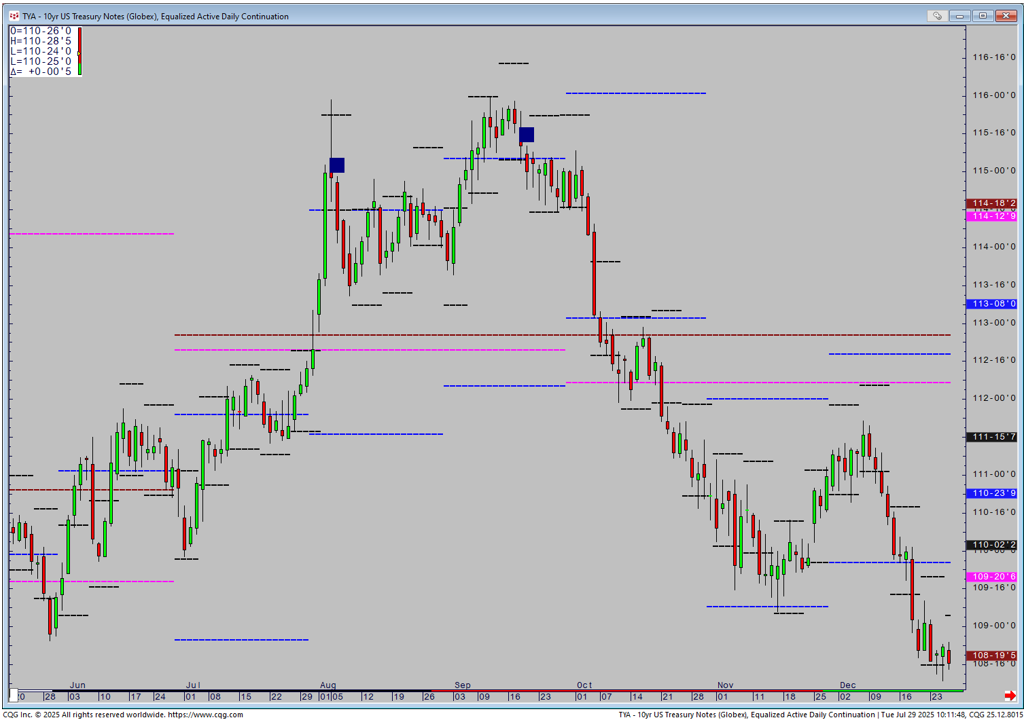
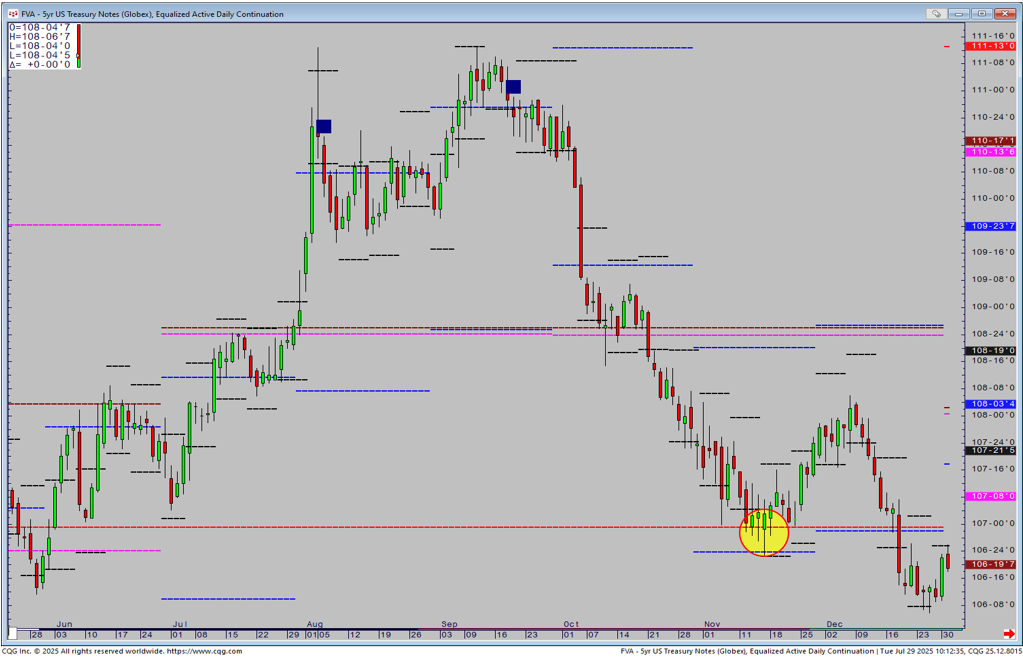
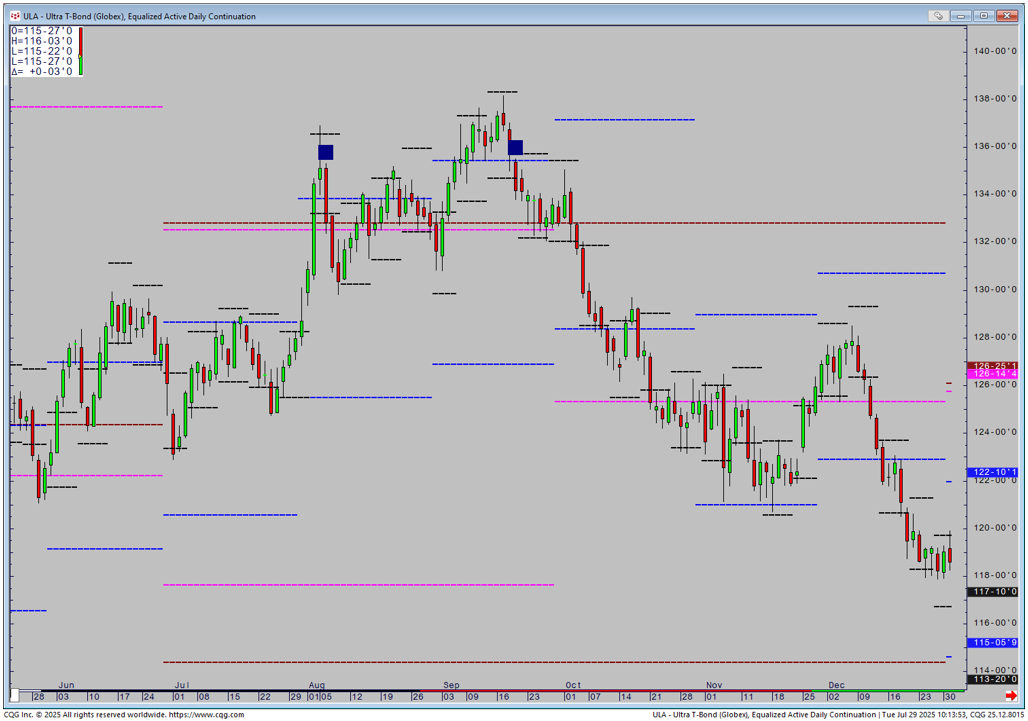
From this study that are a variety of patterns that can be programmed. The first is a measurement of when price is overbought or oversold and then if we have reversed. In an uptrend, the weekly high deviation is above the monthly high and the monthly high is above the quarterly. This tells us we are in a strong trend, and with the continuous time splicing every week and month, this can remain the case for some time. The reversal is confirmed when price makes a daily close below the lower weekly deviation. The whole Bond curve recently produced patterns as marked.
The first signal in April was premature, before the second occurrence set off a major fall. The second signal is usually more powerful.
T Bonds
10 Years
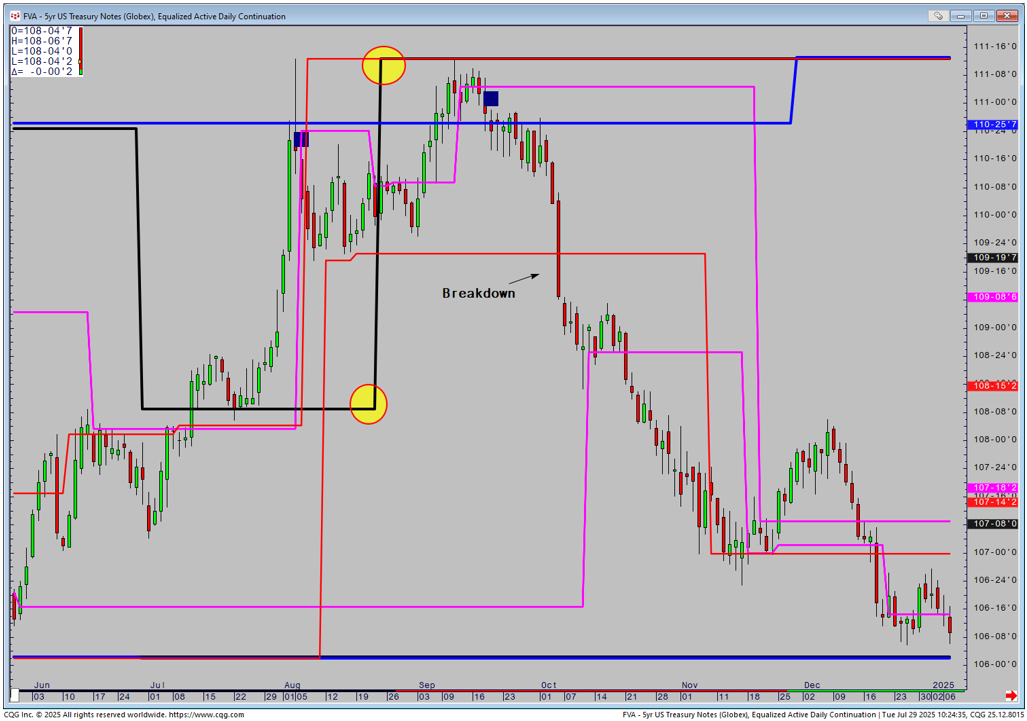
5 Years
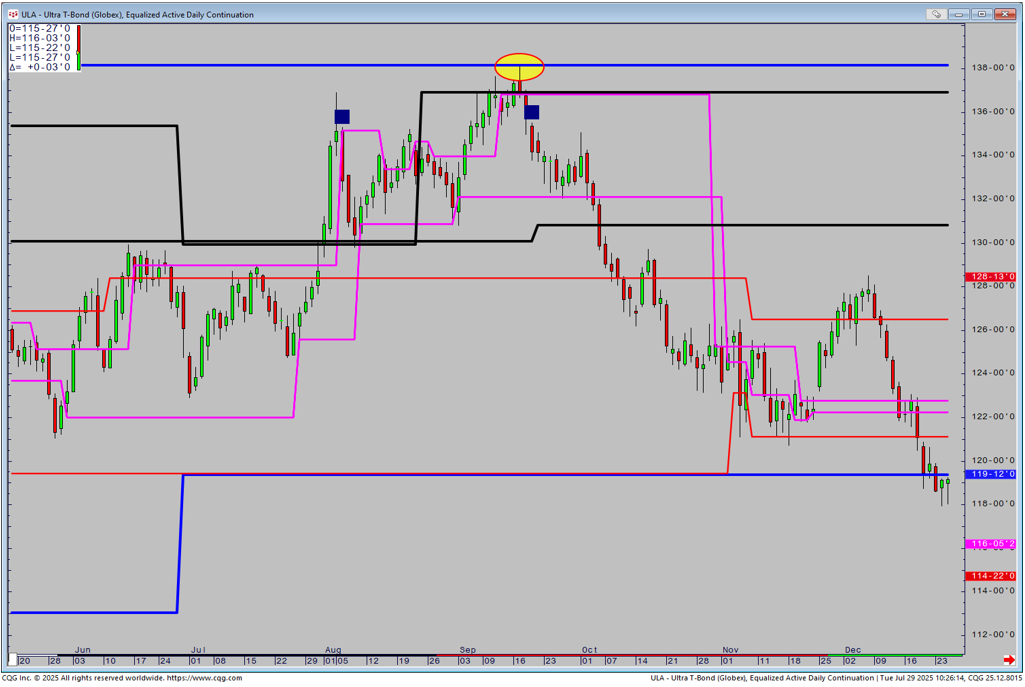
Ultras
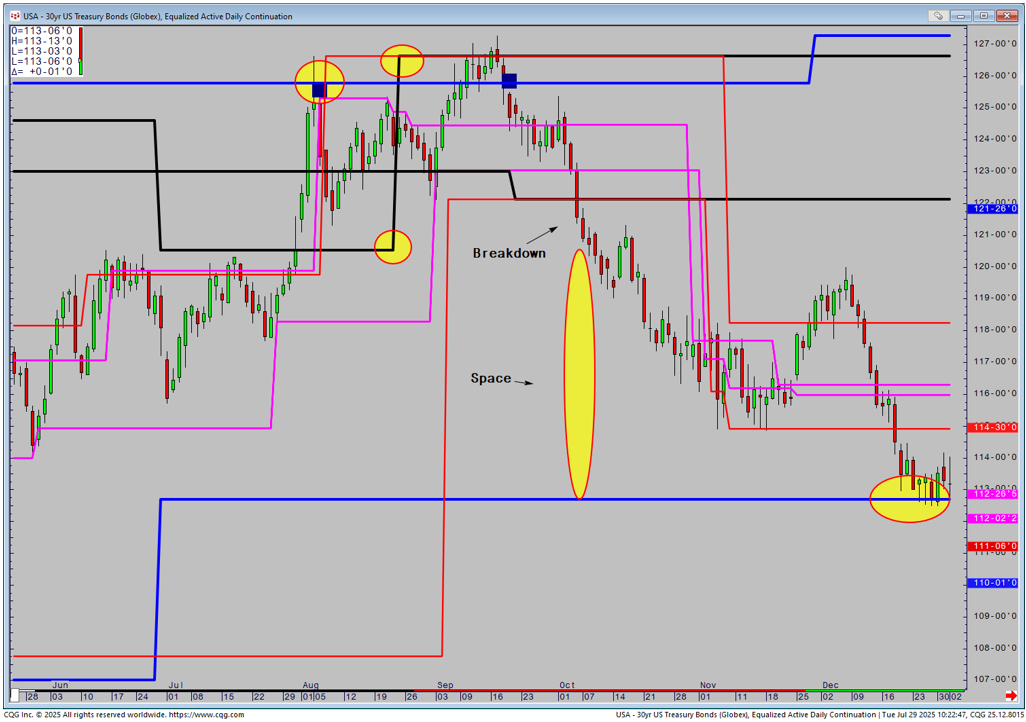
Whilst the pattern has power in its own right, its power is increased considerably when connected to support and resistance. On T Bonds the first signal was after we had reached major monthly resistance, but the move lower was brief. In contrast the second signal had now entered a more powerful zone above as a weekly support had switched to resistance as circled. When price broke down it then had space to fall as support was far away.
10 Years followed a similar pattern

5 Years went 1 tick above the final resistance but took longer to reach the downside target than the rest of the curve.
Ultras set-up was different as the first signal was not at resistance. However, the subsequent high was the monthly based resistance to the tick.
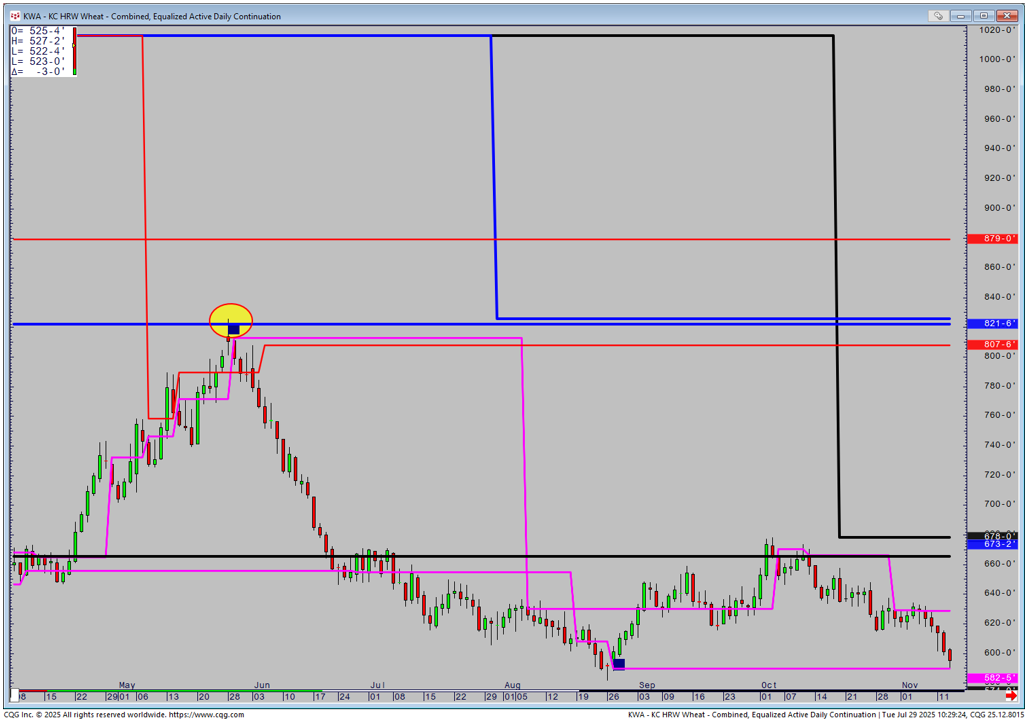
A similar pattern appeared on Kansas Wheat last year.
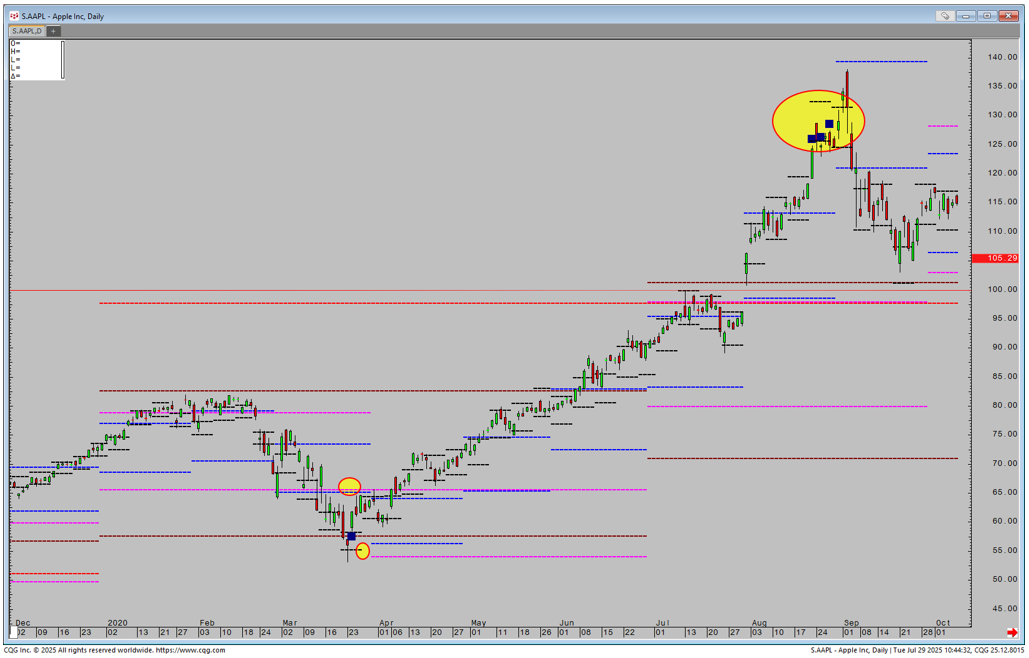
Returning to Stocks, whilst the Range Relativity pattern is rare on Derivatives, there will be far more on Equities. Therefore I expanded the Range Relativity concept to concentrate on the 3rd Deviation confluence instead of the 1st. The example is on Apple and to highlight how rare it is to reach the 3rd Deviation it has only manged to hit the monthly 3 times back to 2007 and the quarterly twice. All represented major lows. The latest signal was back in early 2020. We have a zone between 54.30 and 48.50.
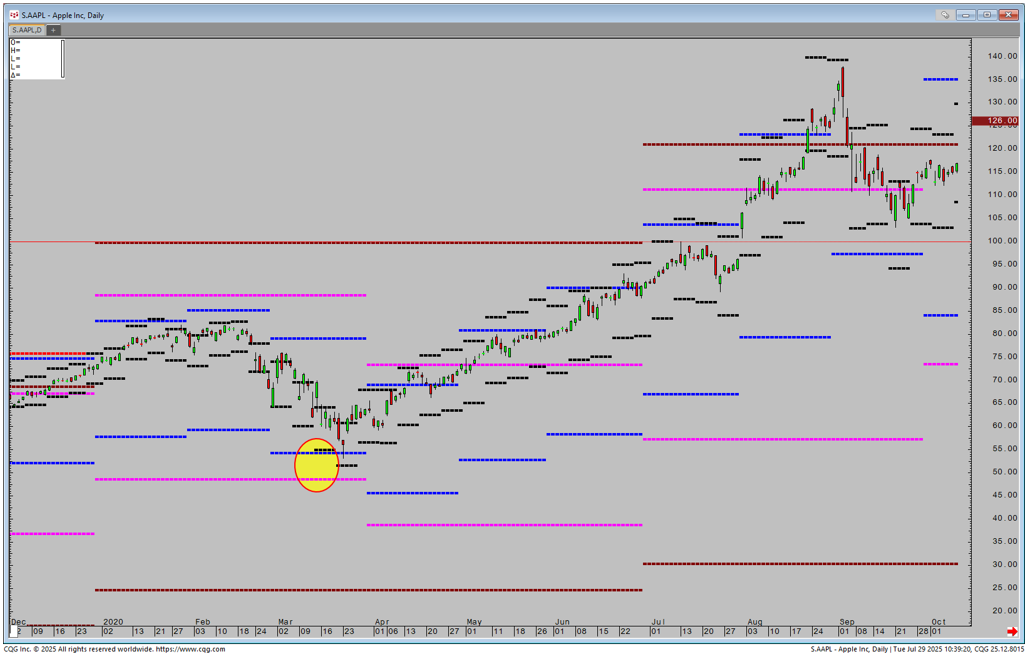
The normal Range Relativity was also in a set-up and produced the pattern. The weekly was below the monthly and monthly below the quarterly as circled, before closing back above the weekly high. Near the top some 6 months later, negative Range Relativity signals appeared.
The advantage of using Range Deviation Pivots and Relativity is the fact that the values are fixed at the opening of each period. There proactive nature means that there is ample time to graze through stocks or derivatives that are of interest. I normally look at monthlies at the end of week 2 and quarterlies 6 weeks in. This allows you to place the markets on your watchlist and begin to get a flavor to how they perform against the overall market or peers.
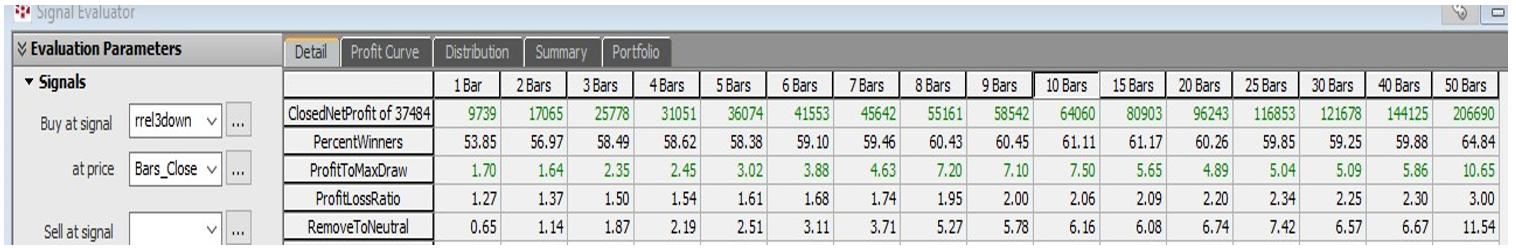
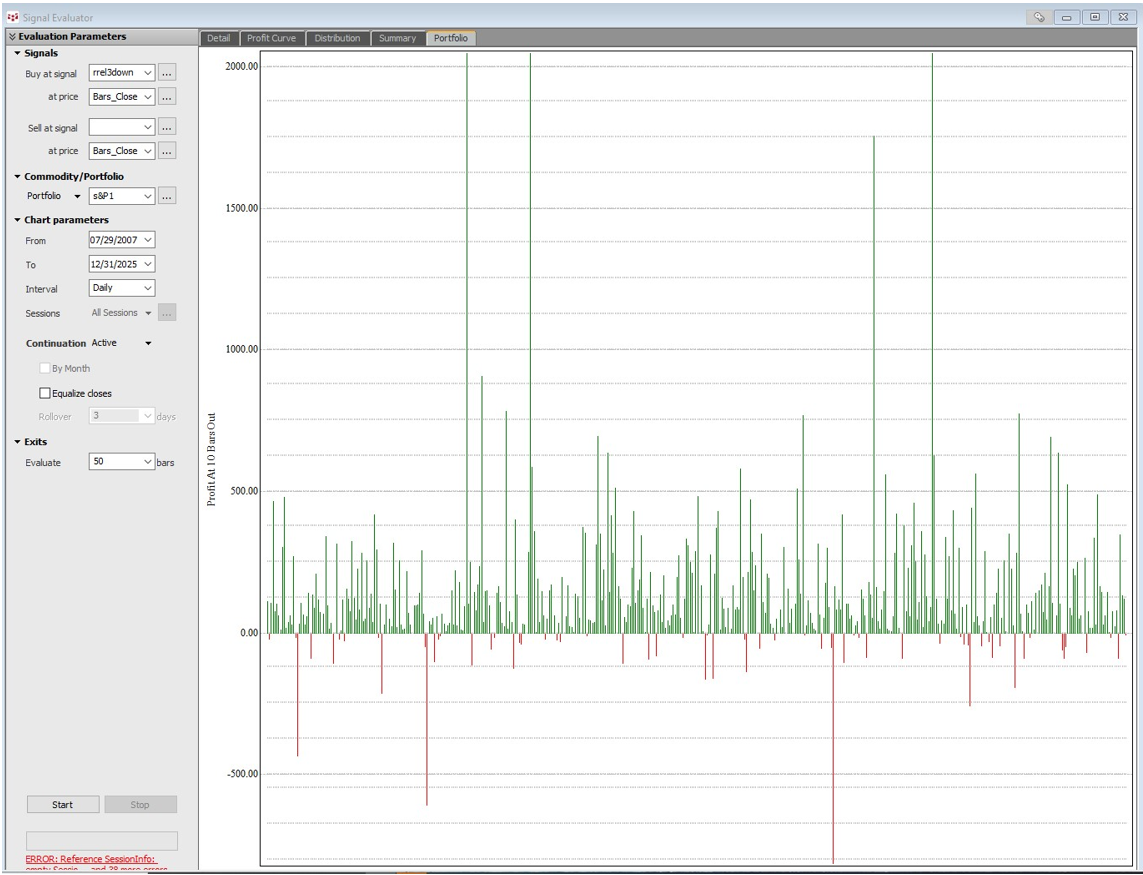
CQG's Entry Signal Evaluator is an excellent tool for analysing if a pattern has a statistical bias and is therefore worth working with. It then be used to scan each day so what signals are appearing. Your Cqg Application Specialist can provide you with more help.
Below is the results of a scan dating back to 2007 on the S&P 500 stocks when price hits the 3rd Monthly deviation down. Note how the accuracy through time is around 60%. On the Portfolio positives far out way negatives.
Next month we will look at Step Theory. How to ride the trend up through Timeframes.
I can be contacted at shaun.downey@aol.com to answer any questions.
