CQG’s Portfolio T&S Monitor displays trades using a time & sales format for a portfolio of instruments. The standard T&S display shows you trading activity for just one instrument. With the Portfolio T&S Monitor you can monitor the trading activity of multiple instruments and gain insight into who are the aggressors: buyers or sellers. The genesis of this article is CQG Product Specialist Stan Yabroff who uses the Portfolio T&S Monitor in his work.
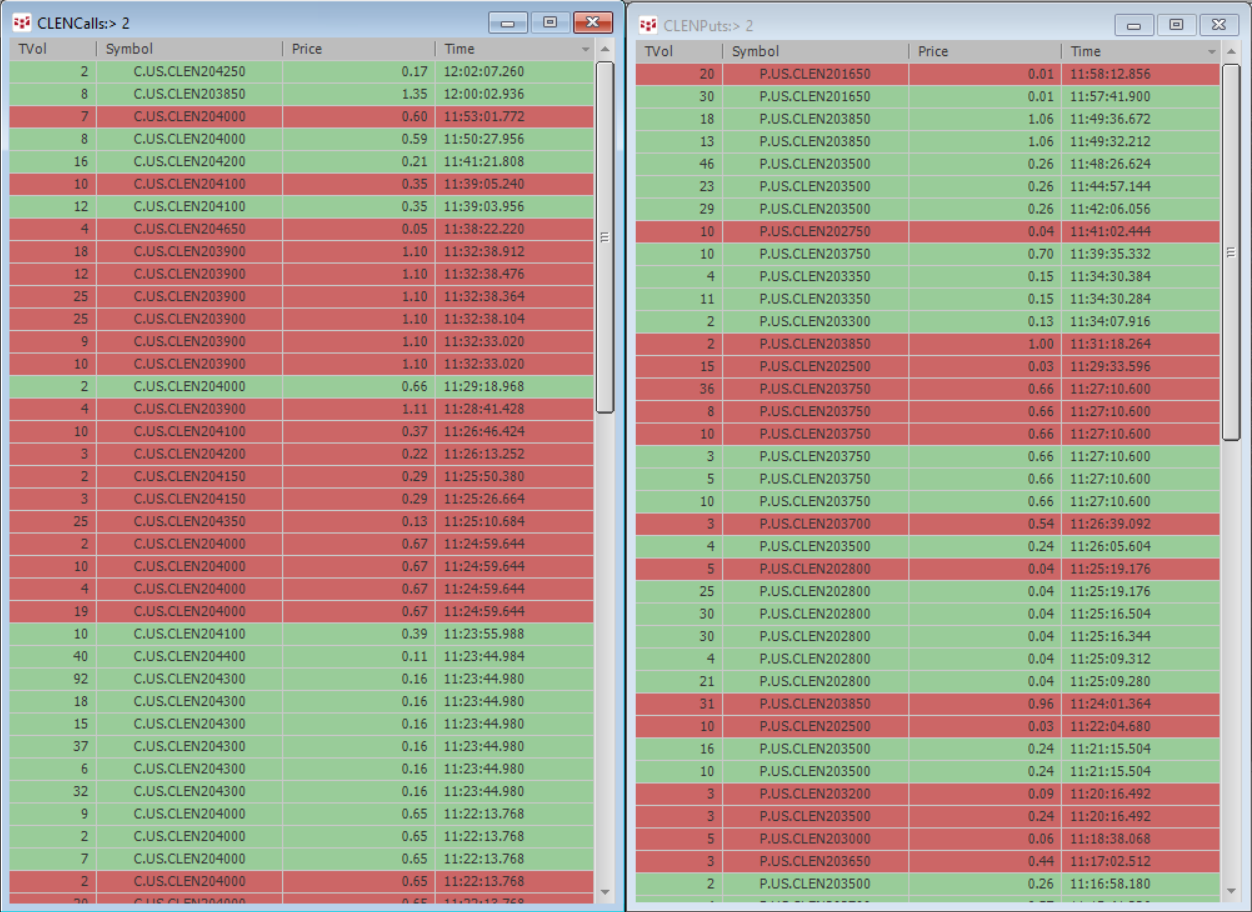
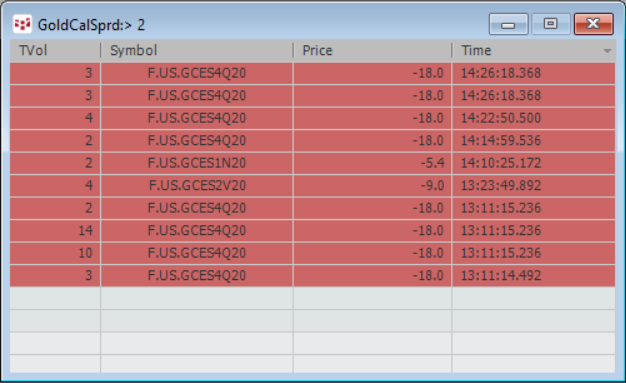
For example, you can monitor a collection of options on a contract using a range of strikes as shown below. The window displays trade volume, price, and time for the selected contracts. The aggressor side is indicated by red (best ask) and green (best bid) highlights of trade volume. You can set a trade volume threshold and the trade volume threshold is displayed on the title bar. The Portfolio T&S monitor allows you to sort by the time column. This article walks you through setting up a portfolio and using the Portfolio T&S monitor as displayed below.
For more details about the Portfolio T&S monitor here is a link to the Help file:
http://help.cqg.com/cqgic/20/#!Documents/portfoliotimesales1.htm
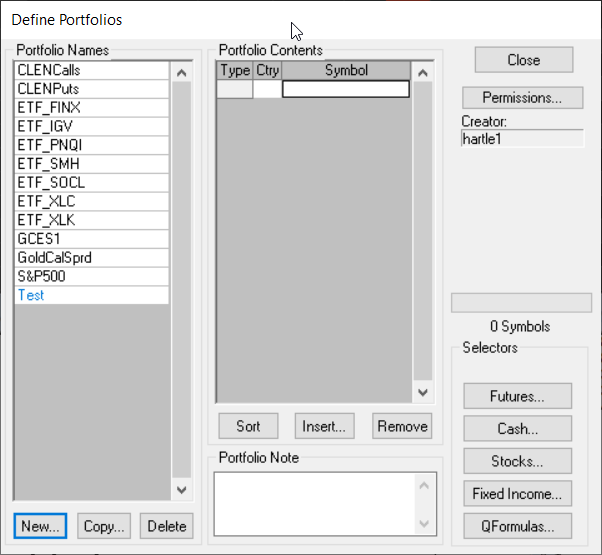
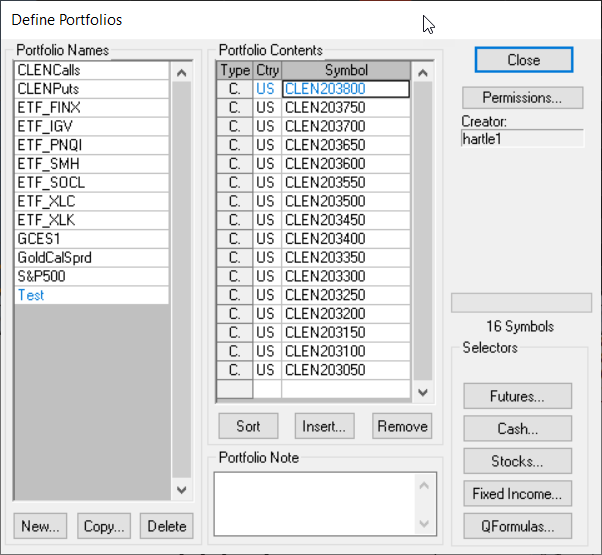
The first step to using the Portfolio T&S monitor is to create a portfolio. The Portfolio manager is found on the Symbols Toolbar button. Click “New”, Give the portfolio a name, and then you enter in the symbols for the portfolio. Manually entering symbols is tedious. Fortunately, there is an easy solution.
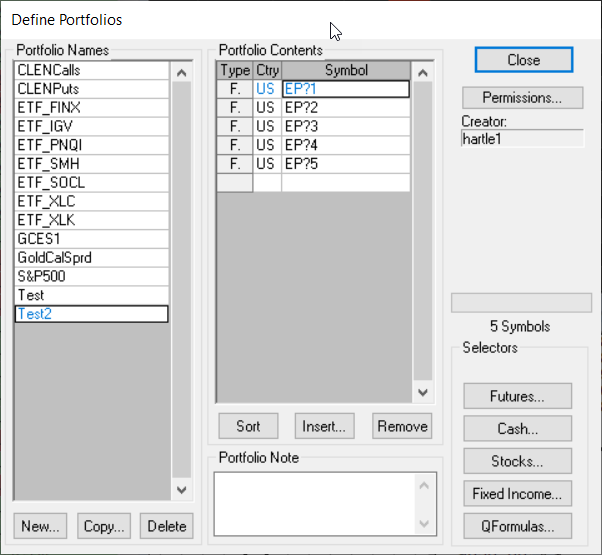
CQG’s original Quote Spreadsheet and the updated Quote Spreadsheet 2.0 have a feature where you can enter in a symbol, such as “EP” and hit the key combination “CTRL + Enter” and then the Quote Spreadsheet will populate with all available symbols for symbol “EP”.
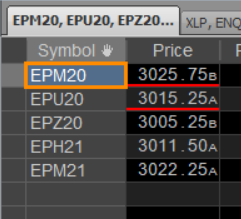
This feature is very helpful because you can select the first symbol, hold down the Shift Key and select the bottom symbol, hit the key combination “Ctrl + C”, which places the list of symbol on your clipboard and then return to the Portfolio Contents dialog, select the empty cell at the top and hit the key combination “Ctrl + V” and paste in the symbols.
There is an additional feature for the options contracts. If you enter in symbol C.CLE you will see all of the call strikes populate for the front options contract for symbol CLE. Perhaps, you only want 10 strikes. You would enter “C.CLE,10” and hit “Ctrl + Enter”. The QSS populates with the At-The-Money strike and 10 strikes above and 10 strikes below.
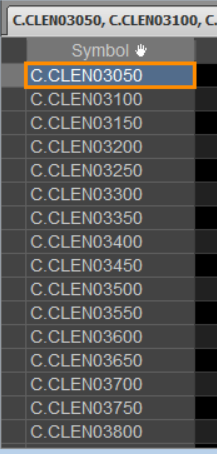
These options symbols are then copied and pasted into the Portfolio Contents dialog.
Now, that you have a portfolio you open the Portfolio T&S Monitor from the T&S toolbar button. Right-click on the title bar of the Portfolio T&S monitor and choose a portfolio from the list. The monitor does not store data, so it starts displaying trades as they occur when the monitor is opened. The monitor preferences allow you to Move the columns and filter the trades by trade volume size.

One drawback is that whenever a contract rolls you have to repeat this process of building a new portfolio. If you enter wildcard symbols into the Quote Spreadsheet they are automatically converted to full symbols. You could enter in the symbols as wild cards by hand, and they will roll.
Another solution is to use Excel to build wildcard symbols. In Excel, you can have one column be the generic symbol, the next column be the wildcard symbols, and the third column merges the contents of the first two columns (=A3&B3). For example, Gold Calendar Spread wildcard symbols are generated in column C:
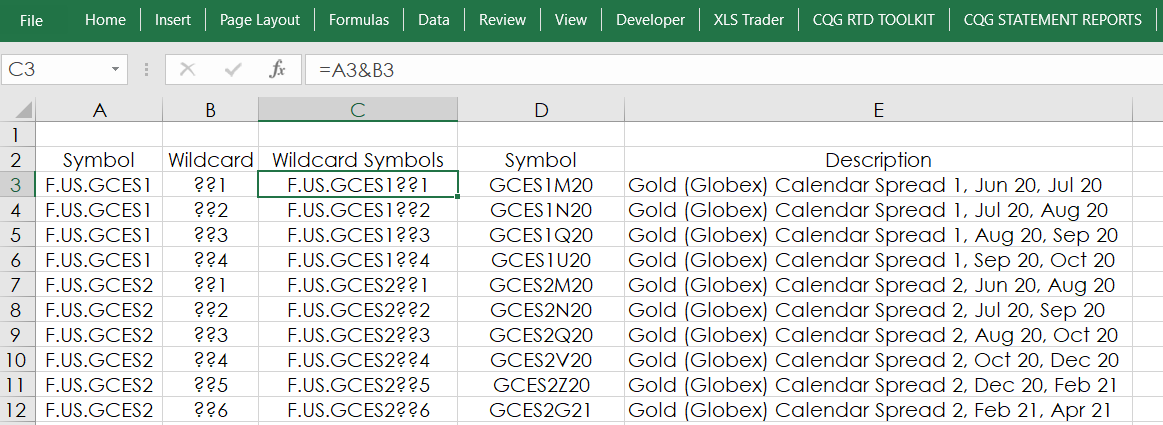
You can copy column C from Excel and paste into the Portfolio Contents dialog.
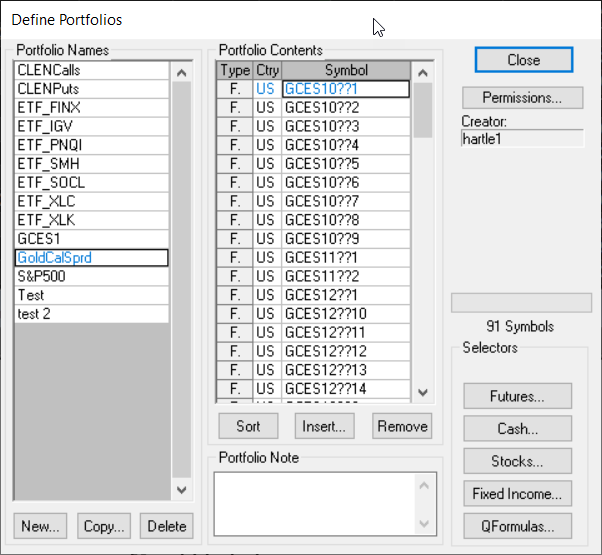
Using wildcards for the symbols allows the symbols to roll. One idea to note and that is some markets, such as Gold Calendar Spreads do not have the same number of months for each group of calendar spreads. For example, GCES1 always has 4 symbols while GCES6 has 17 months. You can use CQG’s All Contracts window to count the number of wildcard symbols you will need.
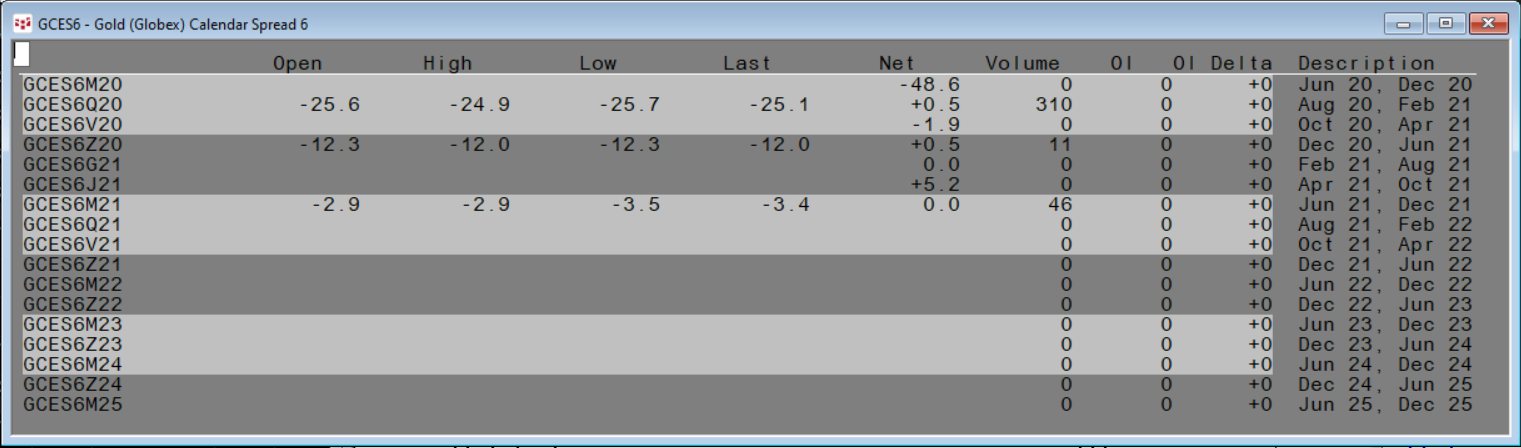
The trading activity in the Gold Calendar Spreads are displayed here.
The Excel sample spreadsheet and a sample CQG page with the Portfolio T&S monitor are available below.