This study goes by a number of other names, including the end point moving average, least squares moving average, moving linear regression, and time series forecast.
To explain this study Microsoft’s Excel LINEST function will be the basis. The LINEST function calculates the statistics for a line by using the "least squares" method. The function calculates a straight line that best fits the data points. In this example, the daily closing prices for the Emini Nasdaq 100 (Symbol: ENQ) futures contract are the data points. The LINEST function returns an array of values that describes the line.
The equation for the line is: y = mx + b where m is the slope of the line and b is the y-intercept and x are dates.
Because the LINEST function returns an array of values, it must be entered as an array formula. However, using the INDEX function wrapped around the LINEST function will return the statistics individually.
For the slope (m) of the line using a 20-bar lookback with the closing prices in column F:
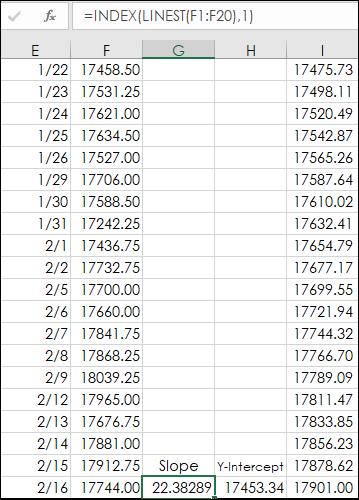
=INDEX(LINEST(F1:F20),1)
For the y-intercept (b) of the line using a 20-bar lookback with the closing prices in column F:
=INDEX(LINEST(F1:F20),2)
Using Excel’s INDEX and LINEST functions for some recent data returned a slope = 22.38289 and the y-intercept = 17453.34.
End Point = (20)(22.38289)+17453.34 = 17901.00
The I column is the straight best fit line along with the closing prices from the F column displayed in this Excel chart.
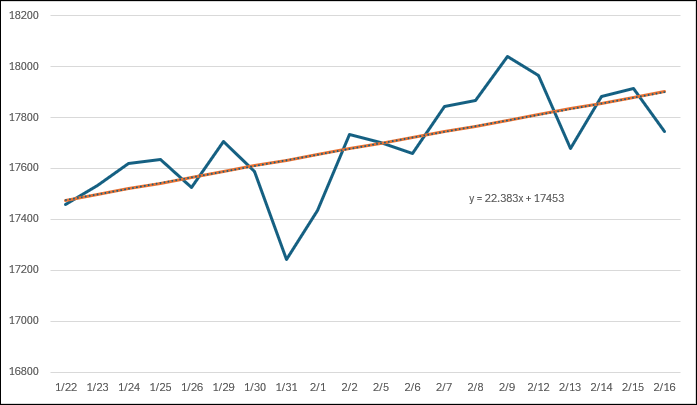
The best fit line is sloping upward, and the end point of the line is 17901. If the same functions are used except just a 5-bar lookback produces this chart.
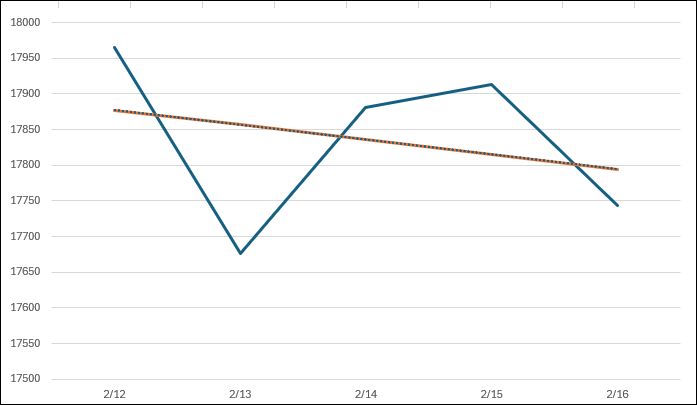
The slope is negative, and the end point value is 17797.47. This next chart has both trendlines displayed.
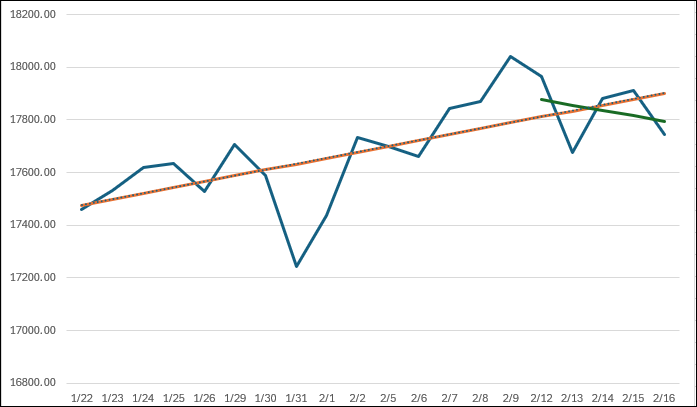
From the above chart the case can be made that the long-term trend (using the 20-bar LINEST function) is up, and the short-term trend (using the 5-bar LINEST function) is down.
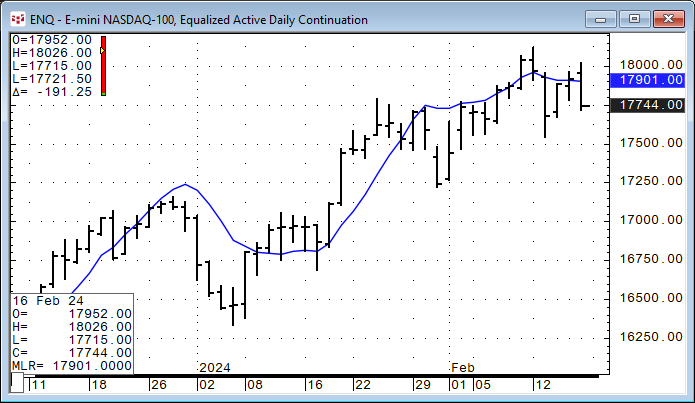
The above image is the MLR study applied to the CQG chart. Recall that the blue line is the end point value of the 20-day least squares best fit trend line for each bar.
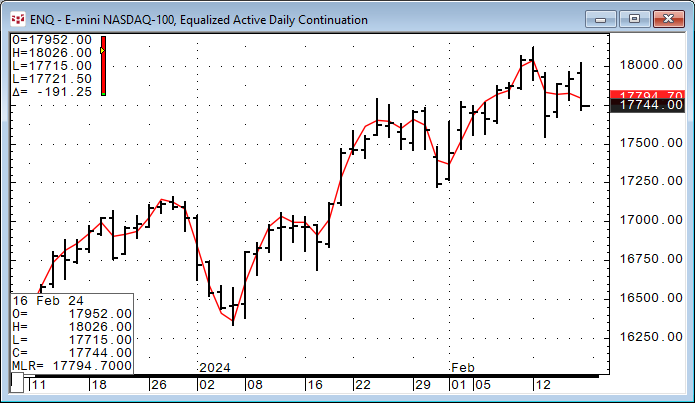
The above chart shows the 5-bar MLR study applied to the CQG chart.
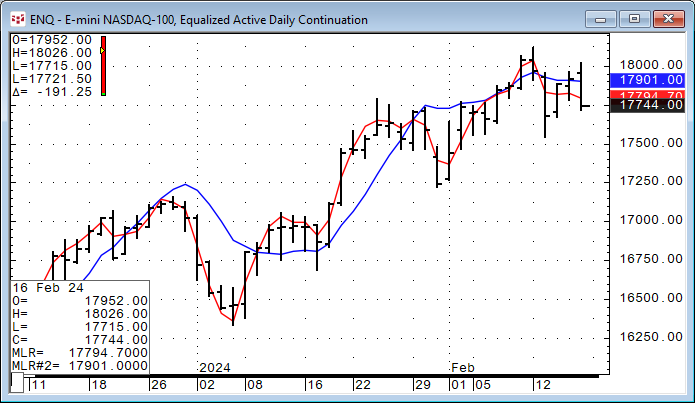
The above chart is a combination of the 5-bar and 20-bar MLR studies.
The MLR study is unique because of the application of the least squares statistical technique for smoothing the data.
This link is to the CQG Help file for the MLR study.
For more information regarding regression analysis this link is to an article that walks you through using Microsoft® Excel’s LINEST function to determine the three coefficients and y-intercept of a 3rd order polynomial. In addition to the downloadable sample Excel spreadsheet, a CQG PAC is provided that uses the XLTS study to pull the results from Excel into CQG to display on a chart.
Requires CQG Integrated Client or CQG QTrader, and Excel 2016 or more recent.