The Moving Average Convergence/Divergence indicator (MACD) was invented by Gerald Appel over 40 years ago. The study is an unbounded oscillator with two lines: MACD and MACDA.
- MACD = Exponential MA1 - Exponential MA2
- MACDA = Exponential MA of MACD
The study calculates the difference between two exponential moving averages of different lengths, the default settings are a 12-period EMA minus a 26-period EMA. The two EMAs will smooth the price data, which will introduce lag. When the differences are calculated the data is detrended.
In addition, the trailing moving average of the MACD is plotted (MACDA), this is commonly referred to as the "Signal" or "Trigger" line. The MACDA uses a 9-period EMA applied to the MACD.
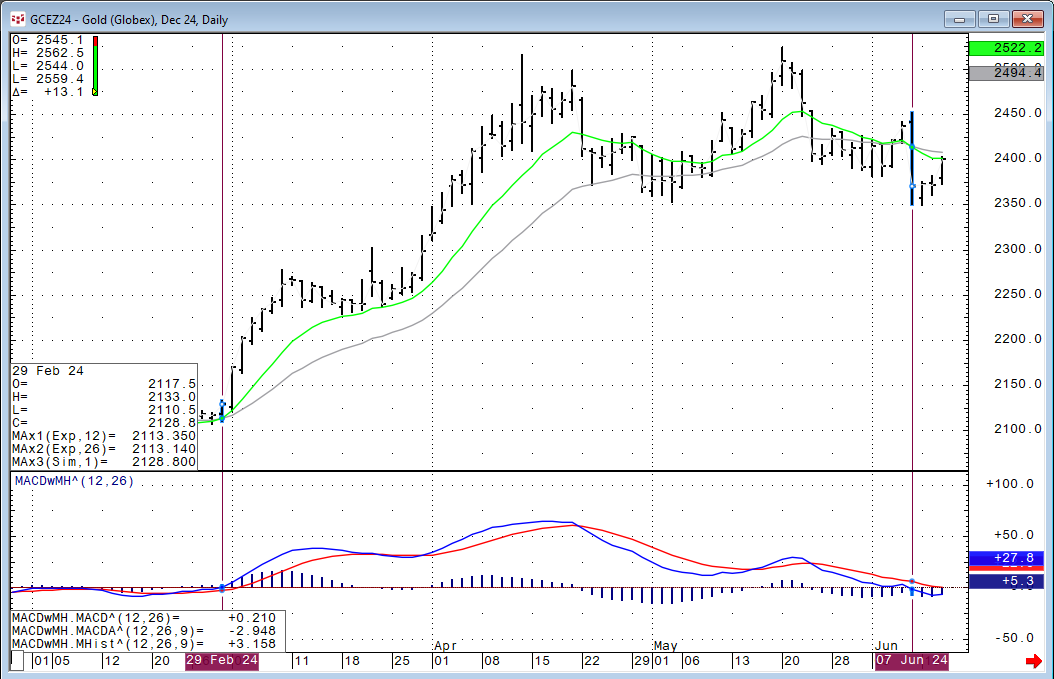
This next image shows the MACD study applied to a daily bar chart of gold. The blue line in the study is the MACD and the red line is MACDA (Signal Line).
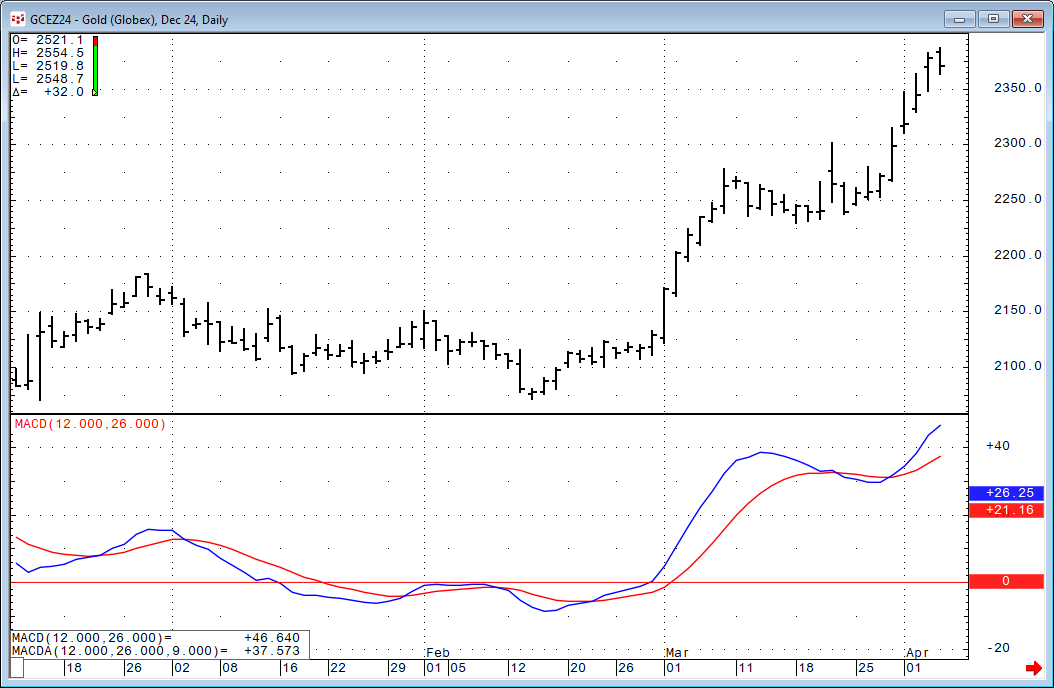
The MACD has two basic trading signals:
- A cross above zero generates a buy signal, while a cross below zero is a sell signal.
- A cross of the MACD and the MACDA may be used to generate buy and sell signals, as well. This technique can identify the resumption of a trend when the MACD has not crossed zero.
To better understand the signals this next image includes 12-period EMA, and the 26-period EMA applied to the daily bars.
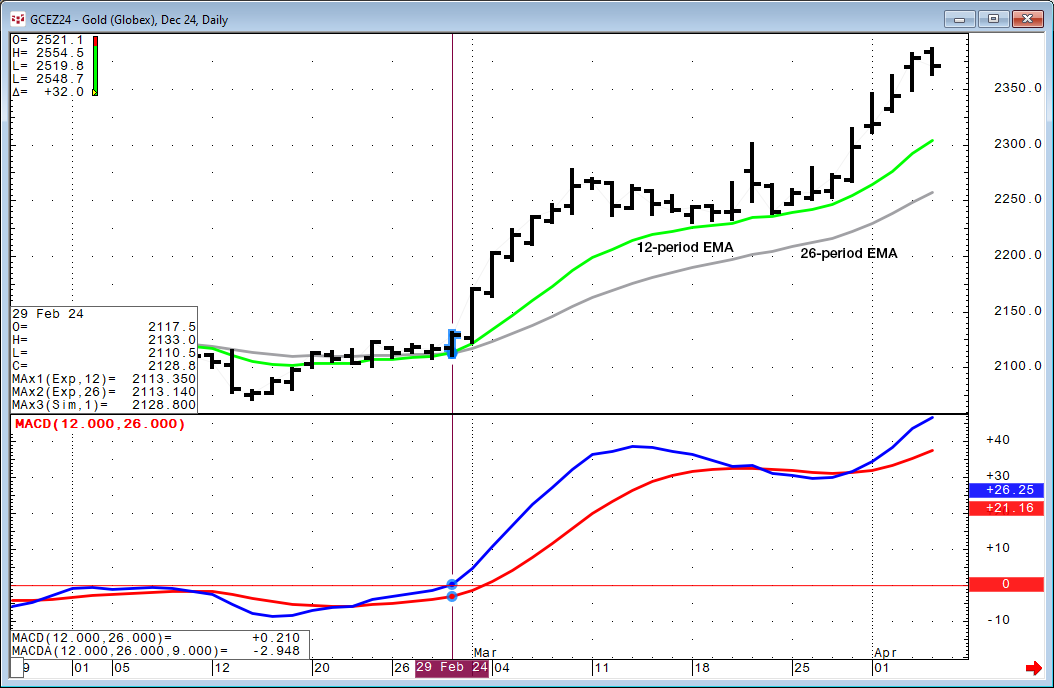
The image above: On February 29 the 12-period EMA crossed above the 26-period EMA. The MACD crossed above zero signaling a possible emerging uptrend.
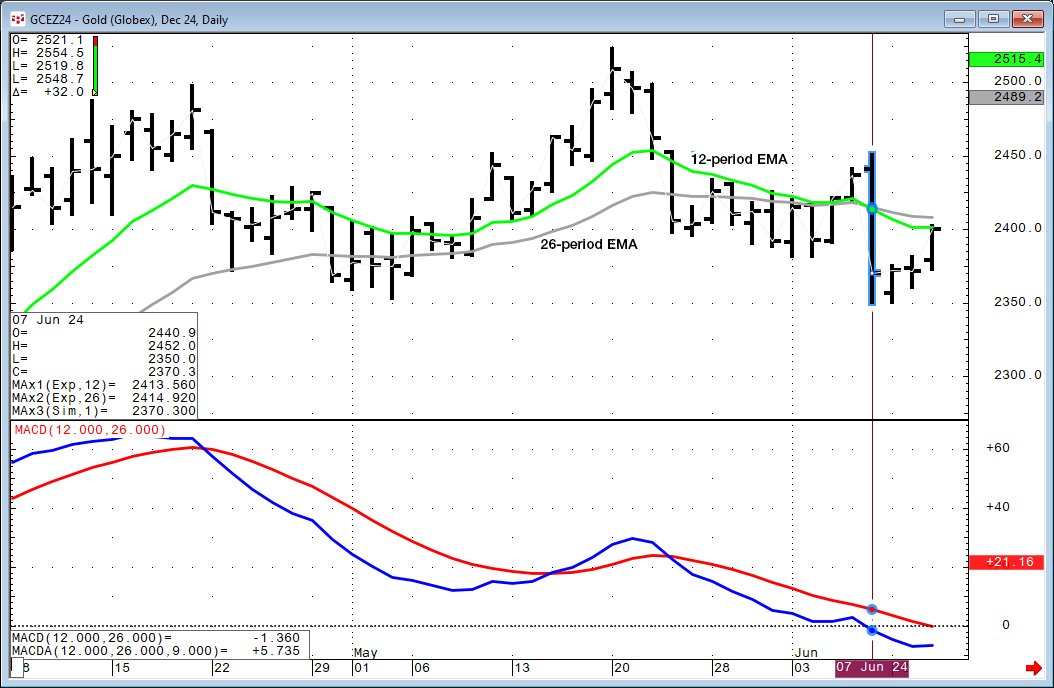
The image above: On June 7 the 12-period EMA crossed below the 26-period EMA. The MACD crossed below zero signaling a possible ending of the uptrend.
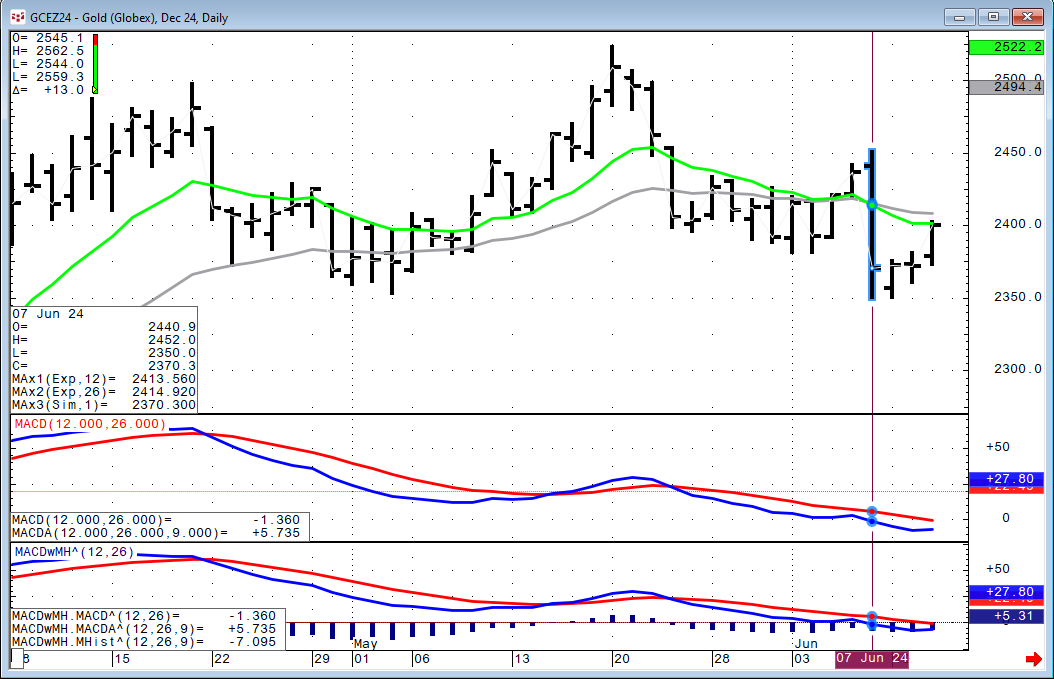
The image above: Includes the MACD, MACDA, and a histogram displaying the difference between the MACD and the MACDA. This is the cqg.MACD w/Histogram custom study set to 12, 26, 8 parameters.
The image above: The MACD crossover of the zero line above and below along with the histogram are highlighted.
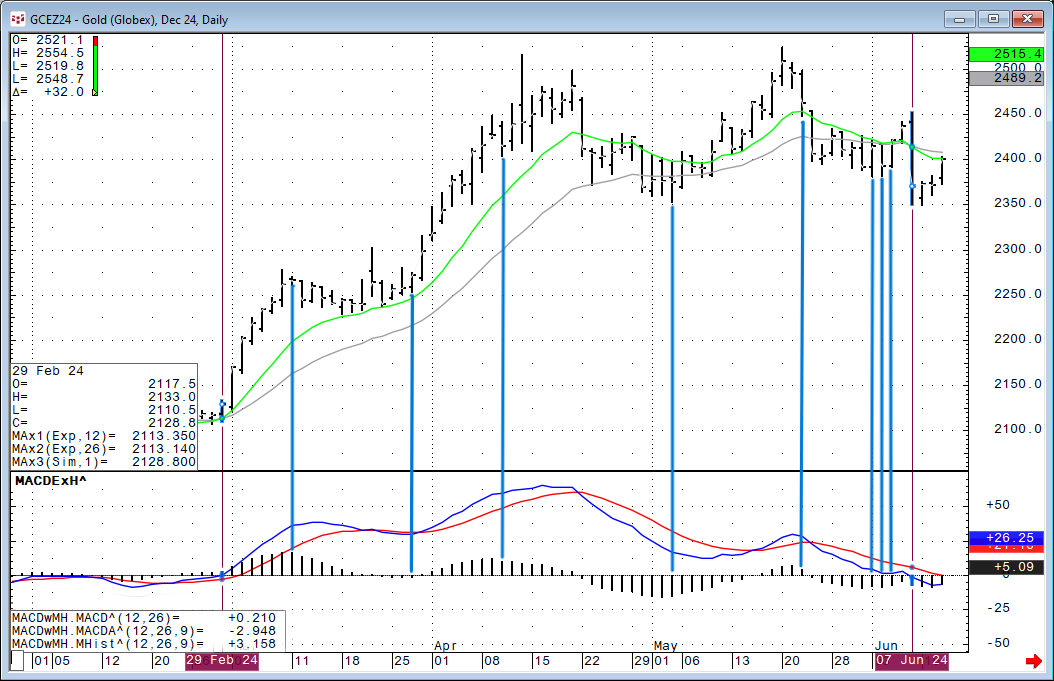
The image above: The changes from the histograms rising to the histograms falling as well as the histograms falling to the histogram rising are marked.
The MACD study is interesting due to its use of both smoothing the price data and the calculating differences.
For customers using RTD and Excel, a sample Excel spreadsheet is available.
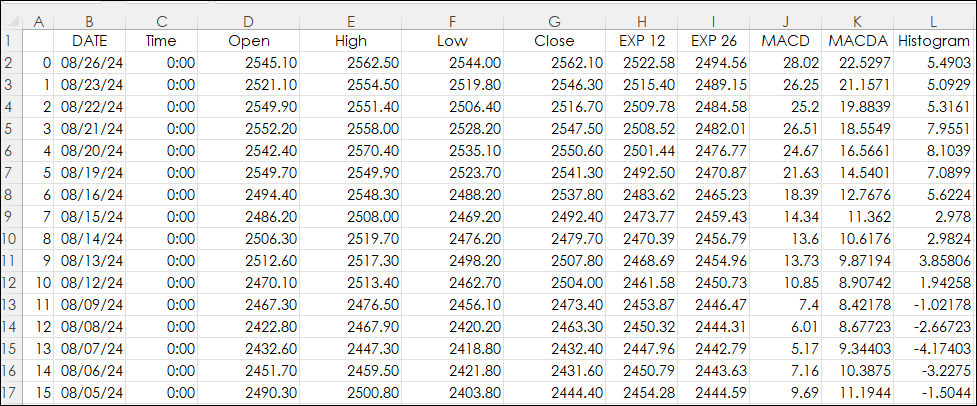
Requires CQG Integrated Client or CQG QTrader, and recommended Excel 365 or Excel 2021 or higher. Excel has to be installed on the local computer, not in the cloud.